Adults' Year 6 Annual Report (April 2025 - March 2026)
Published 9 September 2026
Applies to England

© Crown copyright 2026
This publication is licensed under the terms of the Open Government Licence v3.0 except where otherwise stated. To view this licence, visit nationalarchives.gov.uk/doc/open-government-licence/version/3 or write to the Information Policy Team, The National Archives, Kew, London TW9 4DU, or email: psi@nationalarchives.gov.uk.
Where we have identified any third party copyright information you will need to obtain permission from the copyright holders concerned.
This publication is available at https://www.gov.uk/government/statistics/the-people-and-nature-surveys-for-england-data-tables-and-publications-from-adults-survey-year-6-april-2025-march-2026/adults-year-6-annual-report-april-2025-march-2026
1. Summary of the main findings
The Adults’ People and Nature Survey (A-PaNS) produces accredited official statistics that are nationally representative findings of people living in England. A visit to green and natural spaces is defined in this survey as a visit of any duration (including short trips to the park, dog walking etc.) to green and blue spaces in towns and cities (e.g. parks, canals); the countryside (e.g. farmland, woodland, hills and rivers); or the coast (e.g. beaches, cliffs, open sea). They do not include gardens, outside spaces visited as part of someone’s employment or spaces outside the UK. Data collection started in April 2020 and has been ongoing since. This annual report focuses on data collected between April 2025 and March 2026, unless otherwise stated.
Over two in three people had visited a green and natural space in the previous 14 days.
- Most people (nearly seven in ten) estimated they visited green and natural spaces on a weekly basis in the past year.
Over half of the visits lasted an hour or less, including travel time.
- Over two in three people used an active travel mode (i.e. they went on foot, by bike, or by mobility aid) in their most recent visit to a green and natural space.
- The mode of transportation switched from mostly active travel to mostly passive travel (i.e. they went by car, van, motorbike or by public transport) between two- and three-miles travel distance.
Most people who did not visit a green and natural space would have liked to.
- The most common reason cited for not spending free time outside in the last fourteen days was bad weather.
- However, that was superseded by physical health for people who stated that they never visited green and natural spaces in the last twelve months (based on the last four years of data).
- Bad health was the biggest barrier to visiting green spaces when focusing on visit frequency broken down by demographic variables (health, age, deprivation, ethnicity, gender, urban/rural).
Nearly two thirds of people who did not visit in the last fourteen days had concerns about visiting green spaces.
- Of those with concerns, the top three reasons were anti-social behaviour, visiting after dark and a lack of facilities (such as toilets, benches, and baby changing).
- That changed for people who never walk to their nearest local greenspace to a lack of facilities, anti-social behaviour and being isolated (based on the last four years of data).
Gardens and urban/local green spaces were particularly important for spending time outdoors.
- Urban green spaces have remained the most visited type of green and natural space.
- More people thought the quality of local green and natural spaces had improved (over four in ten) rather than reduced (nearly one in four).
More people visited any green space when local green spaces were a short walk away.
- Nearly seven in ten people agreed that local green spaces were within easy walking distance.
- Nearly seven in ten people also stated they can walk to their nearest local green space within 15 minutes.
Certain groups were more likely to report that they do not have local green spaces within easy walking distance.
- Younger adults, people living in an urban or deprived location, and people identifying as Asian or Asian British.
People feel greater nature connection when local greenspaces are a short walk away (five minutes or less).
- Fewer than half of adults felt highly connected to nature.
- But most people agreed that being in nature makes them happy.
Most respondents agreed that spending time outdoors is beneficial for their physical and mental health.
- Getting fresh air and physical health and exercise were the main reasons for people visiting a green and natural space.
Climate change was the environmental issue most people are concerned about.
- Most people said that protecting the environment was important to them (over eight in ten).
- Recycling was the most common action taken by people to protect the environment.
2. What is the Adults’ People and Nature Survey?
The Adults’ People and Nature Survey for England is one of the main sources of data and statistics about how people in England experience and think about the environment. It has been collecting nationally representative data monthly since April 2020. So far, data has been published that was collected between April 2020 and March 2026. Data is collected via an online panel of adults aged 16 years and older. It is an accredited official statistic. Any differences mentioned in the annual report (something being higher or lower or the same) refer to statistically significant differences based on z-tests in the annual summary table.
Data from the Adults’ People and Nature Survey for England enables users to:
- Understand how people use, enjoy and are motivated to protect the natural environment.
- Monitor changes in use of the natural environment over time, at a range of different spatial scales and for key groups within the population.
- Understand how being in the natural environment can have an effect on wellbeing.
- Understand environmental attitudes and the actions people take at home, in the garden and in the wider community to protect the environment.
This data contributes to Natural England’s delivery of statutory duties, informs Defra policy and natural capital accounting, and contributes to the outcome indicator framework for the 25 Year Environment Plan, now the Environmental Improvement Plan (specifically the G indicators).
The official statistics in this publication are based on continuous online data collection between:
- 2 April 2020 and 31 March 2021 (Year 1),
- 1 April 2021 and 31 March 2022 (Year 2),
- 1 April 2022 and 31 March 2023 (Year 3),
- 1 April 2023 and 31 March 2024 (Year 4),
- 1 April 2024 and 31 March 2025 (Year 5), and
- 1 April 2025 and 31 March 2026 (Year 6).
There were 24,994 surveys conducted in Year 1, 24,987 in Year 2, 24,987 in Year 3, 24,961 in Year 4, 25,026 in Year 5, and 25,034 in Year 6. The survey replaces the Monitor of Engagement with the Natural Environment (MENE) survey which ran from 2009 to 2019.
A modular questionnaire has been designed to maximise the number of questions asked in the survey while maintaining a survey length that is not overly burdensome for respondents. Chart 2-1 provides a simplified summary of the questionnaire modules. Only Module 1 and Module 6 are asked of all respondents. Other modules are asked of different subsets of respondents. Each chart presented in this report includes notes about the sample size where applicable. A more detailed breakdown of the full questionnaire and sample sizes for each module can be found in the questionnaire details for the adult survey.
Chart 2-1 Structure of the Adults’ People and Nature Survey questionnaire (A-PaNS). A-PaNS is an online panel survey, sampling around 2,000 adults monthly in England on a continuous basis.
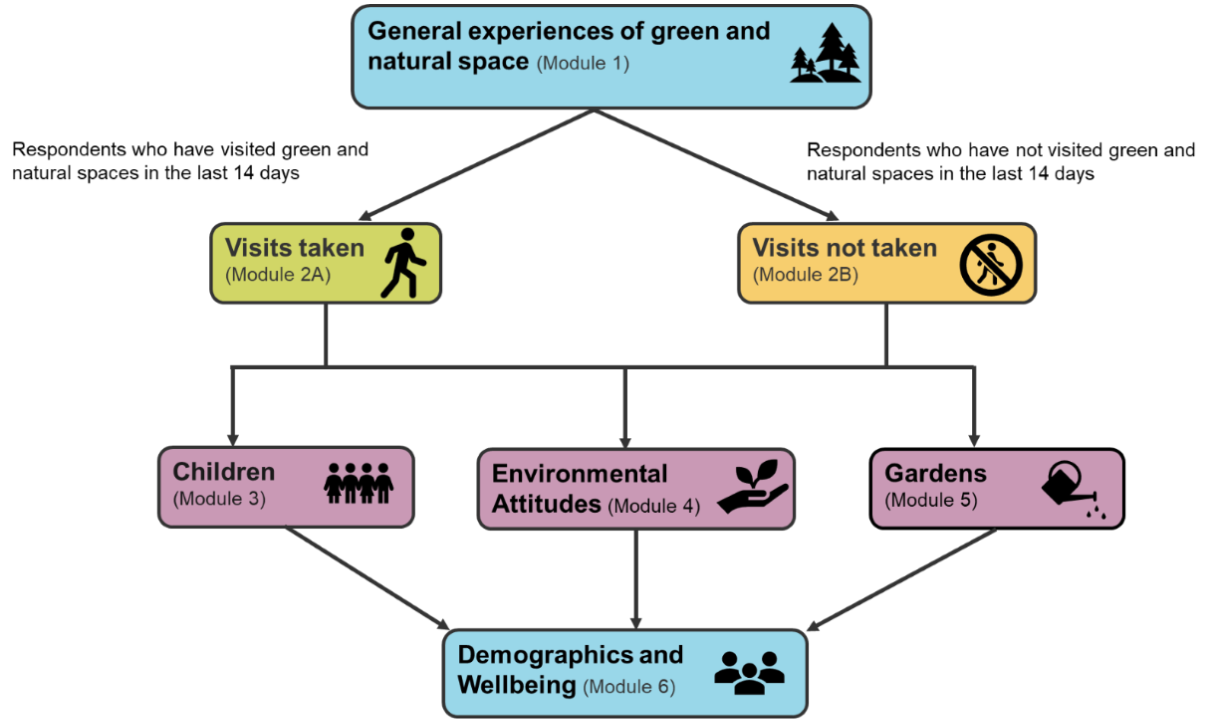
Chart notes
- Data collected between April 2020 and March 2026 (inclusive).
- Module 1 and Module 6 are asked of 100% of respondents.
- Module 2A is only asked of respondents who report they have visited a green and natural space in the last 14 days. These respondents are asked more specific questions relating to their visit, including the location, duration, activities and benefits of their visit. This is estimated to be asked of around 67% of respondents.
- Module 2B is only asked of respondents who report they have not visited a green and natural space in the last 14 days. These respondents are asked about their reasons for not visiting and their access via transport. This is estimated to be asked of around 23% of respondents.
- Module 3 is asked of around 50% of respondents. These respondents are asked about children’s experiences of green and natural spaces, their barriers to visiting and reasons for not spending more time outside.
- Module 4 is asked of around 20% of respondents and includes questions relating to environmental attitudes and behaviours.
- Module 5 is asked of around 40% of respondents and includes questions on gardens and gardening behaviours.
3. Visits to green and natural spaces
Over two in three people had visited a green and natural space in the previous 14 days:
- Over two in three (68%) adults had visited a green and natural space in the previous 14 days in Year 6. This was higher than all previous years (66% in Year 5, 67% in Year 4, 65% in Year 3, 63% in Year 2, and 62% in Year 1).[footnote 1]
- Twenty-two percent of adults had not visited a green and natural space in the previous 14 days in Year 6. This was lower than Year 5 (25%), Year 2 (25%) and Year 1 (29%), but the same as Years 4 and 3 (both 22%).
- A substantial minority of people chose ‘Don’t know’ when asked how many visits they took in the last 14 days (9% in Years 6 and 5, 10% Year 4, 11% Years 3 and 2, 9% Year 1).
Chart 3-1 Percentage of adults in England (weighted percentage) visiting a green and natural space in the last 14 days between April 2020 and March 2026.
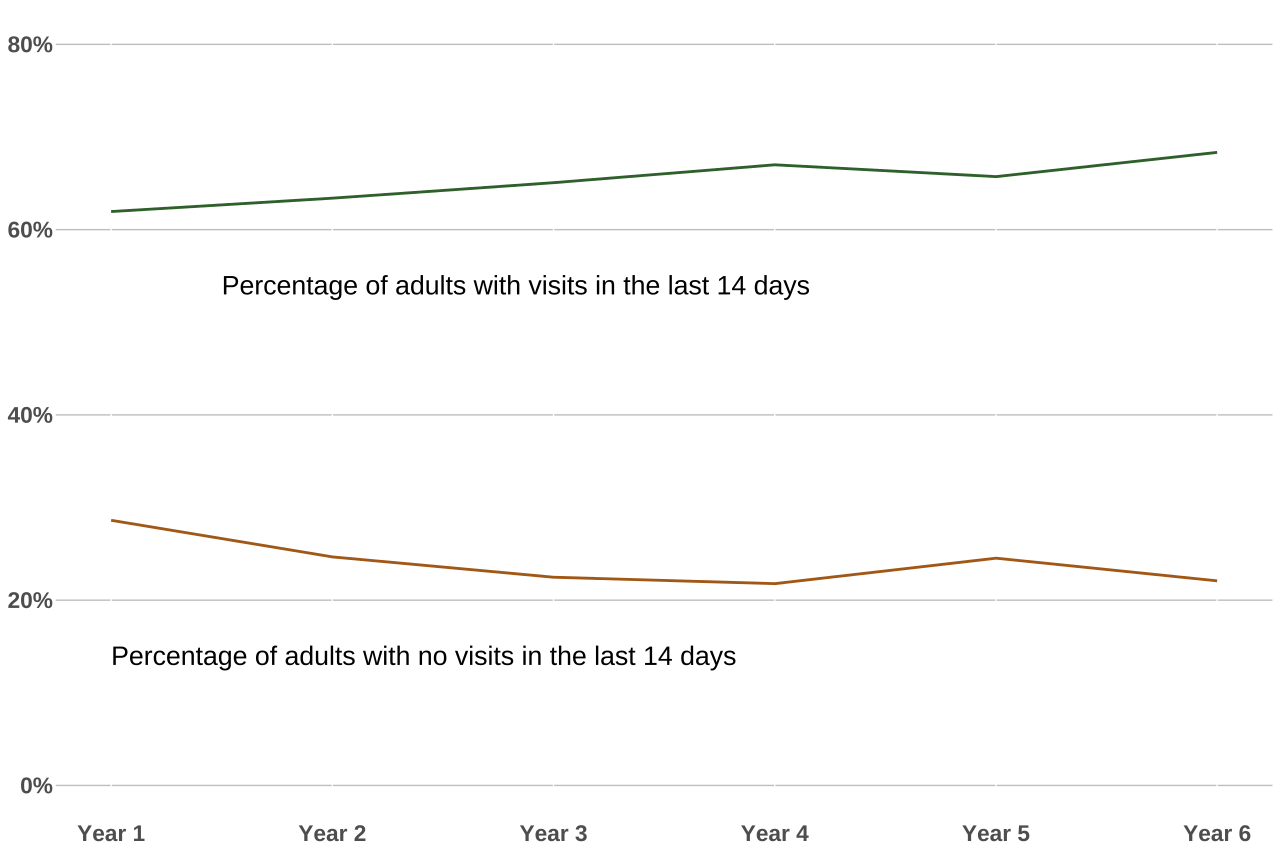
Chart notes
Source: No_Of_Visits How many times, if at all, did you make this type of visit to green and natural spaces in the last 14 days?
- Data collected between April 2020 and March 2026.
- The samples for this question were 22,463 (Year 1), 22,458 (Year 2), 22,417 (Year 3), 22,399 (Year 4), 22,349 (Year 5), 22,537 (Year 6).
- ‘Don’t know’ / ‘Prefer not to say’ responses are not included in this chart.
- All percentages can be found under the ‘Visits to green spaces’ tab in the annual summary table.
Nearly seven in ten people visited green and natural spaces at least weekly:
- Daily (16%) and weekly (53%) visit frequency combined for Year 6 resulted in nearly seven in ten (69%) people stating that they visited at least weekly in the last 12 months.
- The at least weekly visiting percentage in Year 6 (69%) is higher than in Year 5 (68%), the same as Years 3 and 2 (both 69%) and lower than Year 4 (70%) and Year 1 (71%).
- When excluding the years with Covid restrictions (Years 1 and 2) and focusing on Year 3 onwards only (see Chart 3-2), there are only very small fluctuations (only one percentage point) in the percentages of people going out daily, weekly, monthly, less often than monthly, or never, some of which are significant (see the annual summary table for details).
Chart 3-2 Frequency of free time spent outdoors in green and natural spaces in last 12 months between April 2022 and March 2023 (Year 3), April 2023 and March 2024 (Year 4), April 2024 and March 2025 (Year 5) and April 2025 and March 2026 (Year 6).
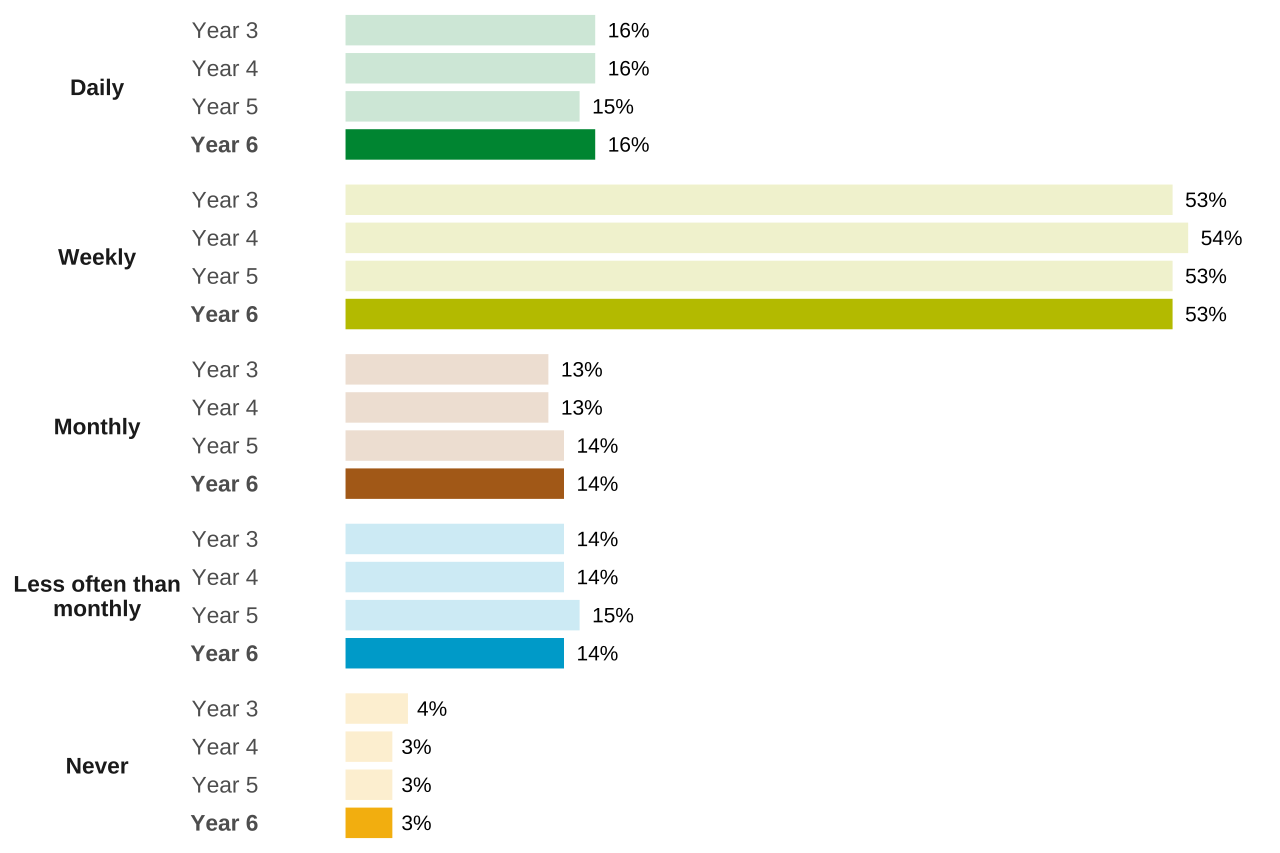
Chart notes
Source: M1_Q1 In the last 12 months, how often, on average have you spent free time outside in green and natural spaces?
- Data collected between April 2022 and March 2026.
- The samples for this question were 24,987 (Year 3), 24,961 (Year 4), 25,026 (Year 5), 25,034 (Year 6).
- ‘Don’t know’ / ‘Prefer not to say’ responses are not included in this chart.
- All percentages can be found under the ‘Visits to green spaces’ tab in the annual summary table.
3.1. Gross visits estimates
Another useful way of understanding how often people visit green and natural spaces is the estimated number of gross visits. This is calculated by extrapolating survey respondents’ visits in the previous 14 days for all adults living in England.
The number of gross visits taken has stayed the same compared to the last financial year:
- In Year 6, the number of estimated visits for the whole of England was 4 billion. This was the same as Year 5 (3.9 billion), Year 3 (3.8 billion) and Year 2 (4 billion). It was lower than in Year 4 (4.1 billion) and Year 1 (4.5 billion).
| Year 1 | (April 2020 – March 2021) | 4,505,400,000 |
| Year 2 | (April 2021 – March 2022) | 4,016,438,000 |
| Year 3 | (April 2022 – March 2023) | 3,841,948,000 |
| Year 4 | (April 2023 – March 2024) | 4,119,820,000 |
| Year 5 | (April 2024 – March 2025) | 3,853,209,000 |
| Year 6 | (April 2025 – March 2026) | 3,958,855,000 |
Chart 3-3 Estimated gross visits for all adults living in England between April 2020 and March 2026.
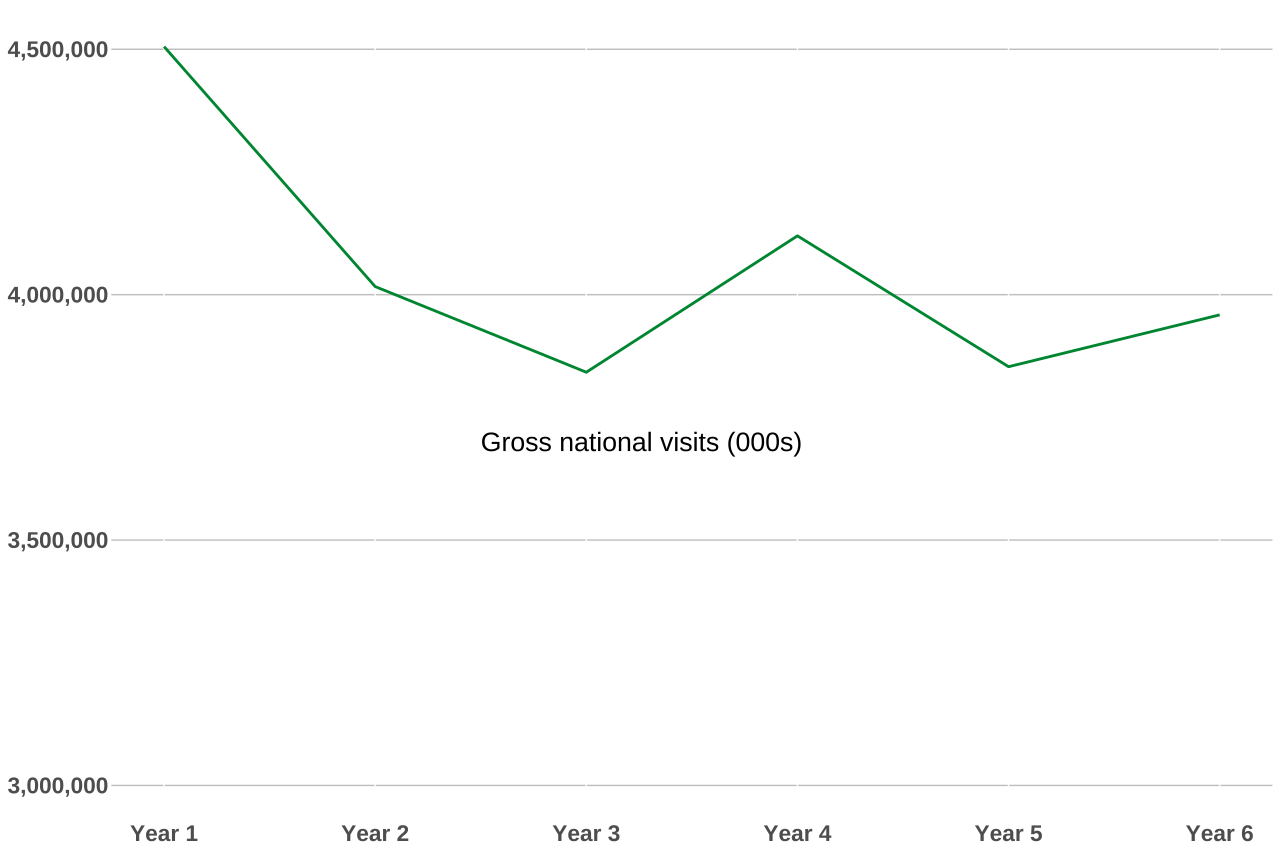
Chart Notes
Source: No_Of_Visits How many times, if at all, did you make this type of visit to green and natural spaces in the last 14 days?
- Data collected between April 2020 and March 2026.
- The samples for this question were 22,463 (Year 1), 22,458 (Year 2), 22,417 (Year 3), 22,399 (Year 4), 22,349 (Year 5), 22,537 (Year 6).
- ‘Don’t know’ / ‘Prefer not to say’ responses are not included in this chart.
- All gross number of visits can be found under the ‘Visits to green spaces’ tab in the annual summary table.
4. Places that people visit
Gardens and urban/local green spaces were particularly important for spending time outdoors:
- In Year 6, three out of four (76%) adults with access to a garden said they spent time in it at least once per week, with no significant difference to previous years (Years 5 and 4 (both 75%), Year 3 (77%), and Year 2 (76%)[footnote 2].
- In Year 6, 9% of adults reported that they did not have access to a garden or allotment. This is higher than in all previous years (8% in Years 5 and 4, 7% in Year 3, and 8% in Years 2 and 1).
- Visit destinations outside of gardens are shown in Chart 4-1. In Year 6, urban green spaces (such as a park, field, or playground) were the most frequently visited green and natural spaces (by 49% of adults). This was relatively stable over time, (50% in Year 5, 51% in Year 4, 50% in Year 3, 51% in Year 2, and 49% in Year 1).
- Rivers, lakes, or canals were the second most frequently visited green or natural spaces in Year 6 (visited by 31% of people). This was closely followed by both fields / farmland / countryside and woodland or forest (both visited by 30% of people) and by beach / other coastline / sea (visited by 29% of people).
Chart 4-1 The types of green and natural spaces people have spent time in during the last month between April 2020 to March 2026.
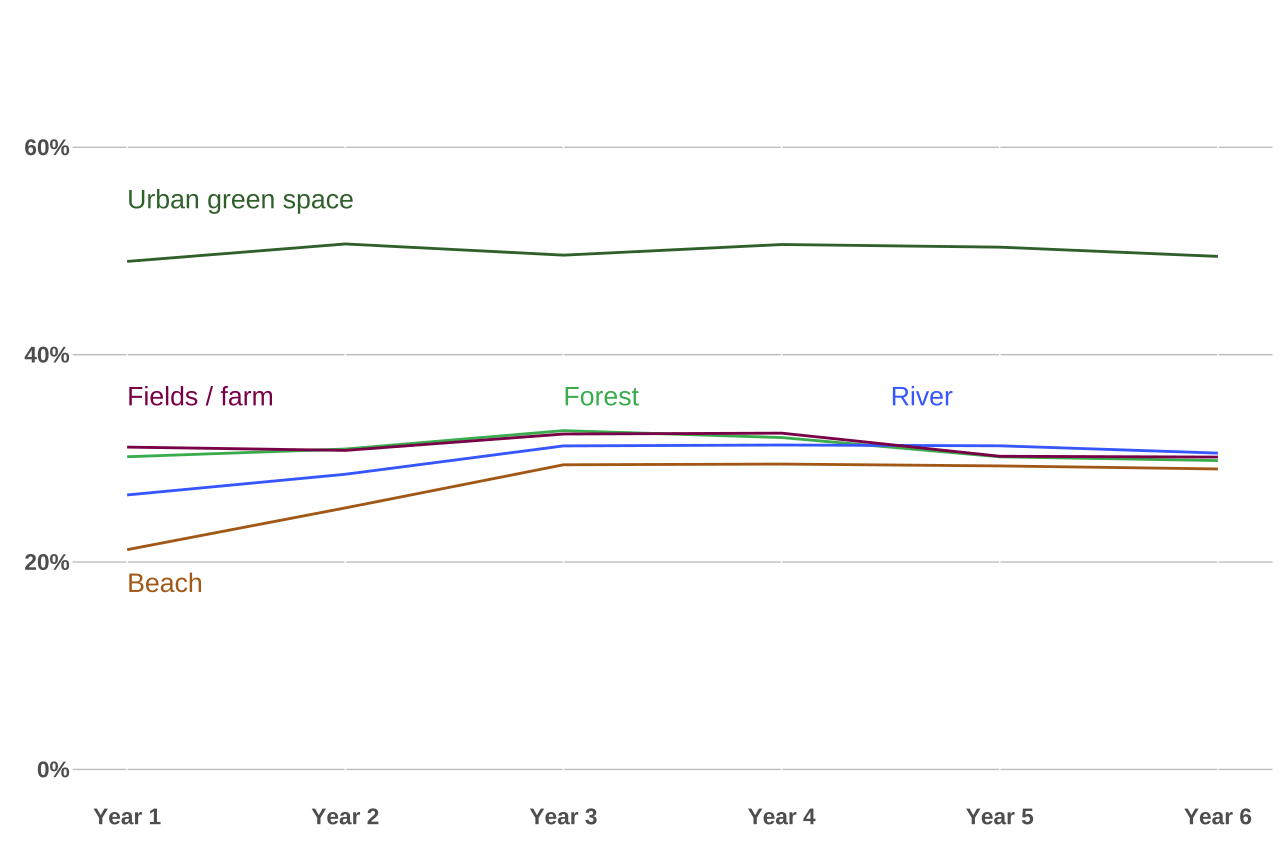
Chart notes
Source: M1_Q2 Which of the following type(s) of green and natural spaces have you visited during the last month? [Select all that apply]. Answer options subset: Urban green space (such as a park, field, or playground), Fields / farms / countryside, Woodland or forest, River, lake or canal, Beach / other coastline / sea.
- Data collected between April 2020 and March 2026.
- The samples for this question were 24,017 (Year 1), 23,710 (Year 2), 24,104 (Year 3) 24,258 (Year 4), 24,252 (Year 5), 24,363 (Year 6)
- Only a subset of types of green and natural spaces have been presented (the top five endorsed for Year 6). More information on the questionnaire is available here.
- ‘Don’t know’ / ‘Prefer not to say’ responses are not included in this chart.
- All percentages can be found under the ‘Where do people go’ tab in the annual summary table.
Out of the destination types picked for Chart 4-1, visits to blue spaces (river, lake or canal and beach/ other coastline) remained more stable from Year 3 onwards. For the two years affected by Covid restrictions (Year 1 and Year 2), blue spaces were the least visited out of the destination types selected, with fewer visits compared to Year 3 onwards. This could potentially be due to fewer people living close to blue spaces and thus, having been unable to access them in view of Covid lockdown restrictions during Years 1 and 2.
5. Local green spaces
Nearly seven in ten people agreed that local green spaces are within easy walking distance:
- In Year 6, nearly seven in ten (69%) people agreed that local green and natural spaces are within easy walking distance. This was the same as Year 5 and an increase compared to the other previous years: Year 4 (66%), Year 3 (65%), Year 2 (66%), and Year 1 (65%).
- In turn, almost two in ten disagree with local green spaces being within easy walking distance in Year 6 (19%), the same as Year 5, and lower compared to the previous years (23% Year 4, 24% Year 3, 23% Years 2 and 1).
Nearly seven in ten people stated they can walk to their nearest local green space within 15 minutes:
- In Year 6, nearly seven in ten (69%) people stated that they can walk to their nearest local green space within 15 minutes.
- Roughly one in four (27%) people stated they walk more than 15 minutes to their nearest local green space.
- Three percent of adults never walked to their nearest local green space.
- For those who do walk to their nearest local green space, 79% said their nearest local green space is the space they visit most frequently.
More people visit any green space when local green spaces are a short walk away:
- In Year 6, with very local green spaces available (5-minute walk or less), 76% of adults visited any green space within the last 14 days. Whereas 16% of people with a very local green space did not visit any green space in the last 14 days.
- With local spaces a little further away (walking 6-15 minutes), 72% of adults visited any green space within the last 14 days, and 21% did not.
- With green spaces further away than 15 minutes, the percentage of people visiting decreased, and the percentage of people not visiting increased (from 22% to 26%). People who stated that they do not know (DK) if they visited or preferring not to say (PNS) if they visited also increased (from 13% to 21%).
Chart 5-1 Percentage of adults in England visiting a green and natural space in the last 14 days by the walking distance to their nearest local green space between April 2025 to March 2026 (Year 6).
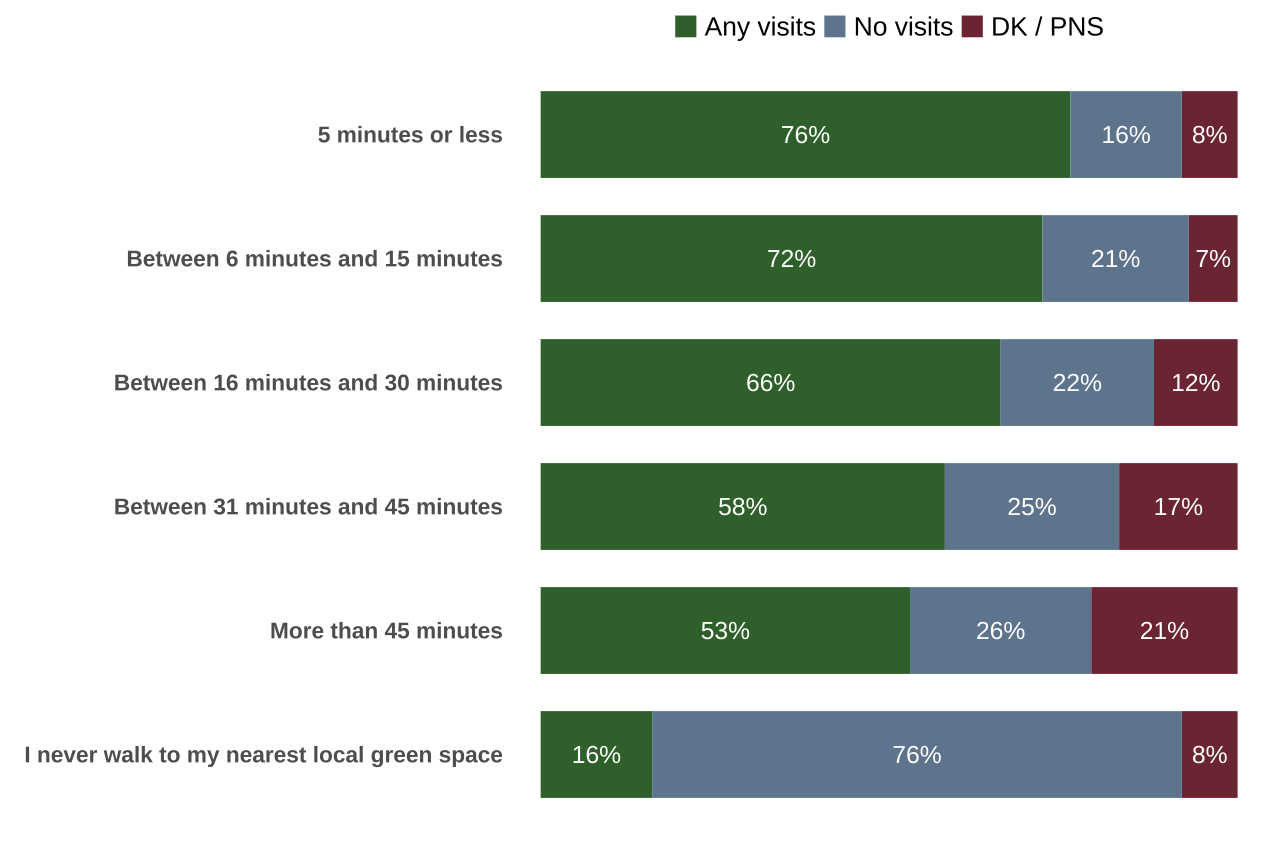
Chart notes
Source: M1_Walk_a How long does it take you to walk to your nearest local green and natural space? and No_Of_Visits: How many times, if at all, did you make this type of visit to green and natural spaces in the last 14 days?
- Data collected between April 2025 and March 2026.
- The samples for this question were 6,659 (5 minutes or less), 9,026 (between 6 and 15 minutes), 4,174 (between 16 and 30 minutes), 1,353 (between 31 and 45 minutes), 635 (More than 45 minutes), 671 (I never walk to my nearest local green space).
- DK stands for ‘Don’t know’.
- PNS stands for ‘Prefer not to say’.
- All percentages can be found under the ‘Local green spaces’ tab in the annual summary table.
Younger adults, people living in an urban or deprived location, and people identifying as Asian or Asian British were more likely to report that they do not have local green spaces within easy walking distance:
- Younger people were generally less likely to report that local green spaces are within easy walking distance. One in four (25%) 16–24-year-olds disagree that local green spaces are within easy walking distance compared to 14% of those 65+.
- Nearly 3 in 10 adults (28%) identifying as Asian or Asian British reported that they do not have local green spaces within easy walking distance. This is compared to Mixed or Any other ethnic group or background (both 27%), and Black or Black British (23%). The lowest percentages were reported by adults identifying as White (17%).
- More people living in the most deprived areas disagreed that green and natural spaces are within easy walking distance (20%) compared people in less deprived areas (16%).
- More urban dwellers disagreed that green spaces are within easy walking distance (18%) compared to rural dwellers (15%).
Chart 5-2 Percentage of adults disagreeing that local green spaces are within easy walking distance by five demographic variables (age, ethnicity, gender, deprivation, urban/rural) between April 2025 and March 2026 (Year 6).
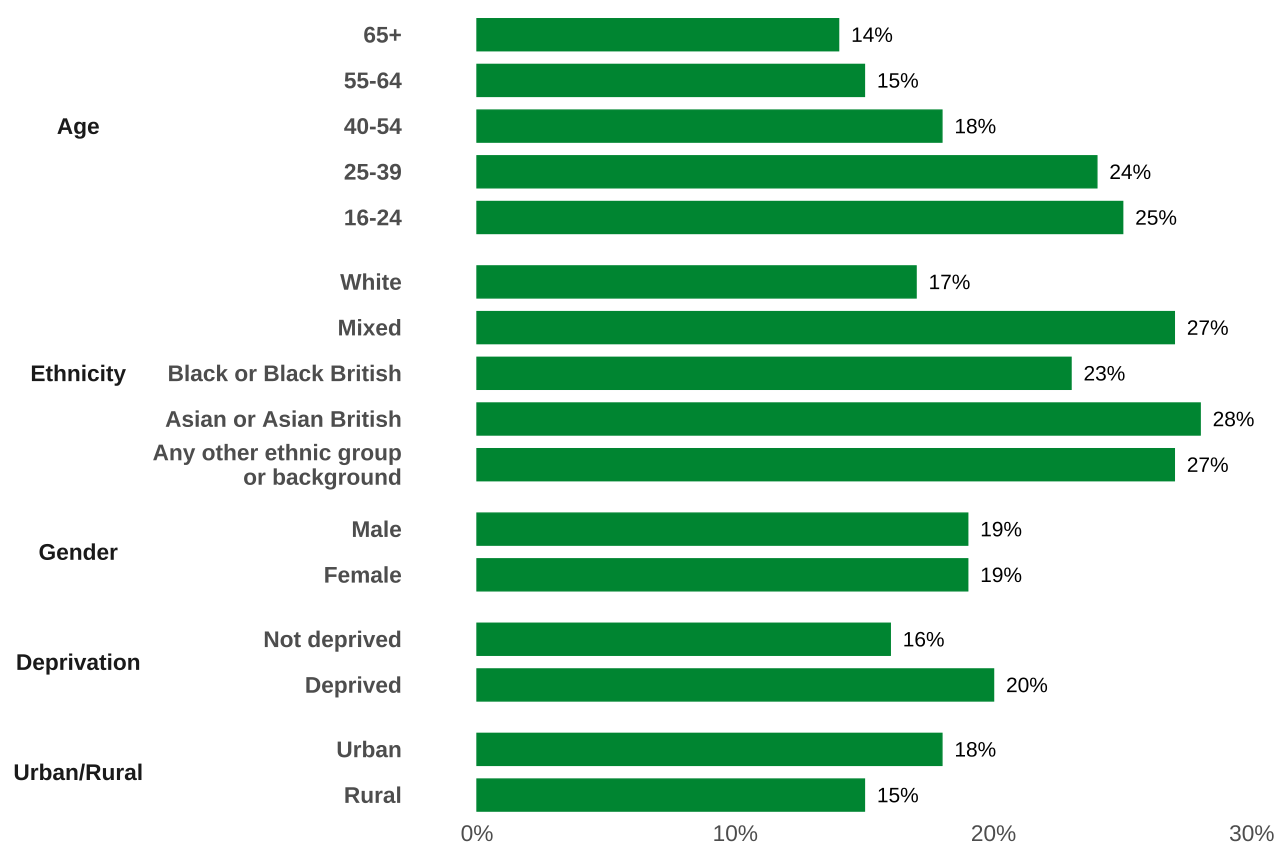
Chart notes
Source: M1_Q5_a Now, thinking about green and natural spaces close to where you live, how much do you agree or disagree with the following statements? NET disagree including ‘Disagree’ and ‘Strongly disagree’.
My local green and natural spaces actually are: a) Within easy walking distance.
- Data collected between April 2025 and March 2026.
- The samples for this question were 3,214 (16-24), 6,161 (25-39), 5,777 (40-54), 4,061 (55-64), 5,821 (65+), 21,105 (White), 500 (Mixed), 1,274 (Asian or Asian British), 1,959 (Black or Black British), 191 (Any other ethnic group or background), 12,028 (Male), 12,980 (Female), 4,376 (Deprived), 14,813 (Not Deprived), 2,605 (Rural), 16,584 (Urban).
- ‘Don’t know’ / ‘Prefer not to say’ responses are not included in this chart.
- Deprived in this report refers to the households in the bottom 20% of the IMD – Index of Multiple Deprivation (see glossary - deciles 1 and 2, out of ten total).
- All percentages can be found under the ‘Local green spaces’ tab in the annual summary table.
5.1. Local green space quality
More people thought the quality of local green and natural spaces had improved rather than reduced:
- Overall, across all regions in England, four in ten thought that the quality of green and natural spaces close to where they live had improved in the last five years (43% in Year 6, 42% in Years 5, 4, and 3, 41% in Year 2 and 39% in Year 1).
- Nearly one in five (24%) thought green spaces close to them had reduced in quality in Year 6., This is the same as Years 5 (24%) and 4 (23%) but an increase on previous years (22% in Year 3, and 20% in Years 2 and 1).
People in London were most likely to agree that the quality of green and natural spaces where they live had improved:
- People in London were more likely to agree that the quality of green and natural spaces where they live had improved over the last five years (59%) compared to all other regions in England.
- People in the East were least likely to agree that green and natural spaces where they lived had improved (35%).
Chart 5-3 Whether the quality of green and natural spaces close to where people live had improved in the last 5 years by region between April 2025 to March 2026 (Year 6)
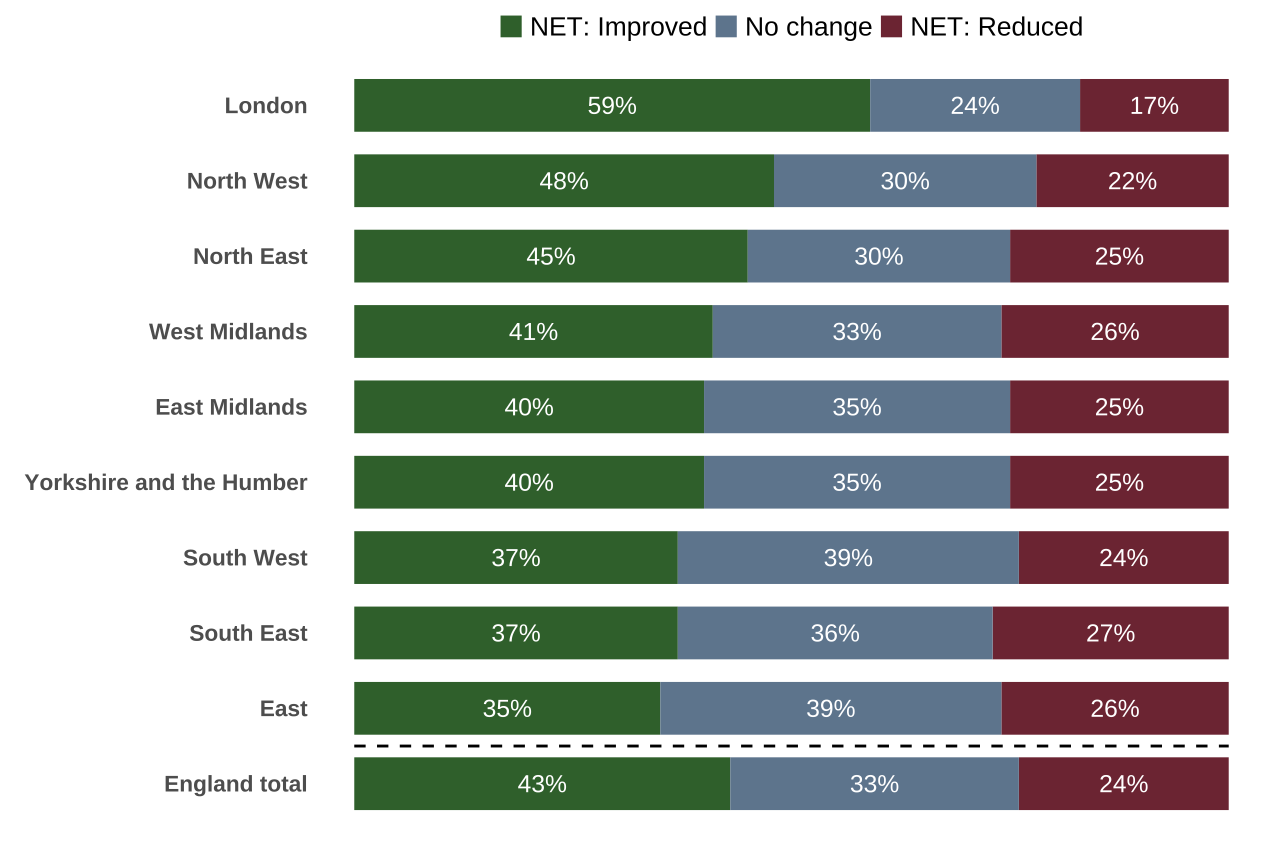
Chart notes
Source: Q3 / M1_Q3 Thinking of the green and natural spaces close to where you live, have they improved or reduced in the last 5 years, or have they not changed?
- Data collected between April 2025 and March 2026.
- The samples for this question were 4,044 (London), 1,305 (North East), 3,367 (North West), 2,434 (Yorkshire and the Humber), 2,696 (West Midlands), 2,272 (East Midlands), 2,335 (South West), 3,925 (South East), 2,656 (East), 25,034 (England total).
- ‘Don’t know’ / ‘Prefer not to say’ responses are not included in this chart.
- All percentages can be found under the ‘Local green spaces’ tab in the annual summary table.
6. Travel to green and natural spaces
Over two in three people used an active travel mode in their most recent visit to a green and natural space:
- Over two in three (68%) people used active travel in their most recent visit to a green and natural space (i.e. they went on foot, by bike, or by mobility aid).
- Conversely, just under a third (32%) used passive travel (i.e. they went by car, van, motorbike or by public transport).
More than two in three journeys were below three miles in travel distance:
- The length of journey to green and natural spaces varied, with over two in three journeys (68%) having been within two miles.
- Forty-four percent of journeys involved travelling less than one mile; 25% one to two miles; 22% three to ten miles and 10% more than ten miles.
Chart 6-1 Distance travelled to visit location between April 2025 to March 2026 (Year 6).
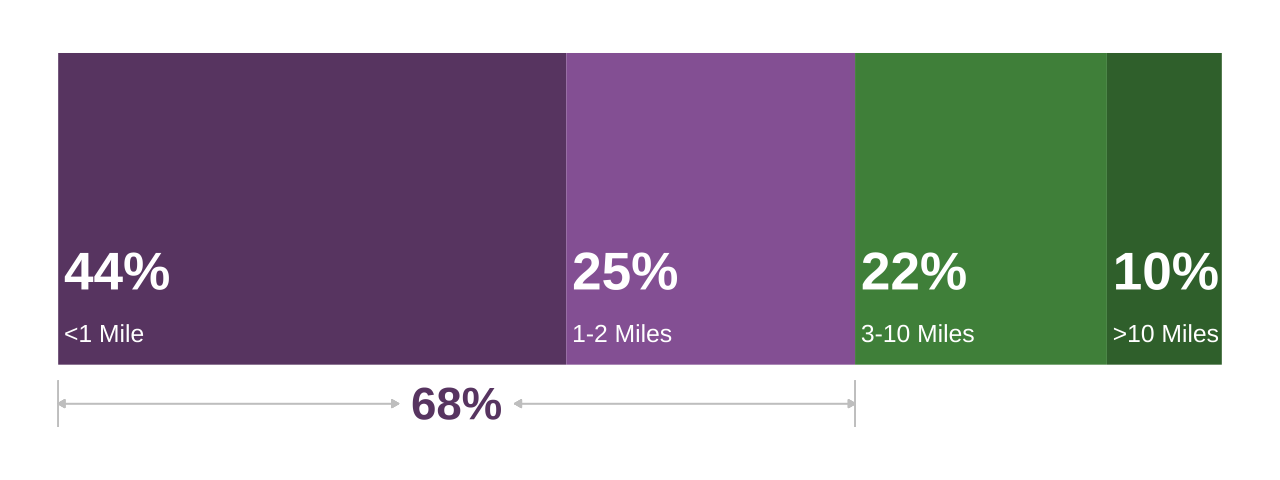
Chart notes
Source: M2A_Q6 Approximately how far in miles did you travel to reach this place?
- Data collected between April 2025 and March 2026.
- The sample for this question was 17,300 (Year 6).
- ‘Don’t know’ / ‘Prefer not to say’ responses are not included in this chart.
- While 44% and 25% do not add up to 68% (but 69%), this is due to rounding. 68% is the more accurate number when adding up the non-rounded values.
- Due to rounding, the percentages in the figure add up to 101%, rather than 100%.
- All percentages can be found under the ‘Travel to green spaces’ tab in the annual summary table.
The mode of transportation switched from mostly active travel to mostly passive travel between two- and three-miles travel distance:
- Forty-four percent of those who visited green and natural spaces in the last 14 days in Year 6 travelled less than one mile to a local green and natural space.
- Of those 44% with visits of less than one mile distance, nine in ten journeys (90%) were taken by active travel, as shown in Chart 6-2.
- Twenty-five percent travelled one to two miles.
- Of those 25% with visits of one to two miles distance, nearly seven in ten journeys (69%) were taken by active travel and 31% by passive travel.
- Twenty-two percent travelled three to ten miles.
- Of those 22% with visits of three to ten miles distance, 47% were taken by active travel and 53% by passive travel.
- Ten percent travelled more than ten miles.
- Of those 10% with visits more than ten miles, 78% were by passive travel.
Chart 6-2 Distance travelled by type of transport used between April 2025 to March 2026 (Year 6).
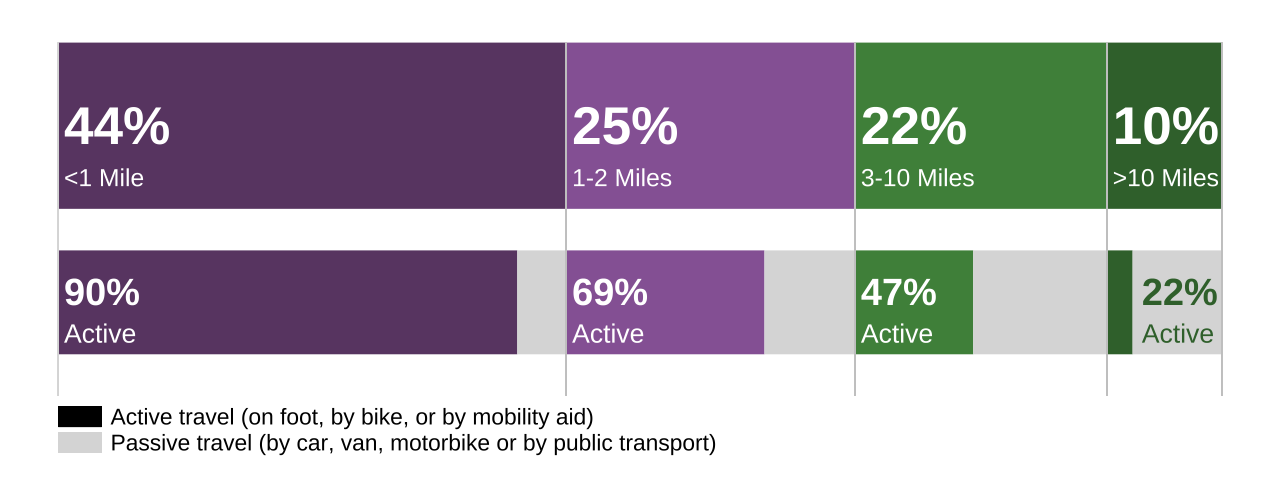
Chart notes
Source: M2A_SUB_Q1 What was the main form of transport you used to reach your main destination and M2A_Q6 Approximately how far in miles did you travel to reach this place?
- Data collected between April 2025 and March 2026.
- The sample for this question is 5,200: 2,053 (<1 mile), 1,402 (1-2 miles), 1,178 (3-10 miles), and 567 (>10 miles).
- Responses have been combined to create the ‘Active’ and ‘Passive’ categories of travel. Active travel is comprised of: ‘Bicycle/ mountain bike’, ‘On foot/ walking’ and ‘Mobility aid (such as wheelchair or mobility scooter)’. Passive travel is comprised of ‘Car/van/motorbike’ and ‘Public transport (e.g. train, bus or coach)’. More information on the questionnaire is available here.
- ‘Don’t know’ / ‘Prefer not to say’ responses are not included in this chart.
- Due to rounding, the percentages in the top part of the chart add up to 101%, rather than 100%.
- All percentages can be found under the ‘Travel to green spaces’ tab in the annual summary table.
Over half of the visits lasted an hour or less including travel time:
- Over half of the visits (55%) lasted an hour or less including travel time.
- More than one in five (21%) of all visits lasted up to 30 minutes in Year 6, 34% of visits lasted between 30 minutes and up to an hour, and 27% lasted between one hour and two hours. Only 18% of visits lasted more than two hours.
7. Reasons for visiting a green and natural space
Getting fresh air and physical health and exercise were the main reasons for people visiting a green and natural space:
- Most people (57%) visited a green and natural space to get fresh air in Year 6.
- Almost half (47%) visited for physical health and exercise in Year 6.
- Thirty nine percent of adults visited for mental health and wellbeing.
Chart 7-1 Main reasons for taking a visit between April 2020 to March 2026.
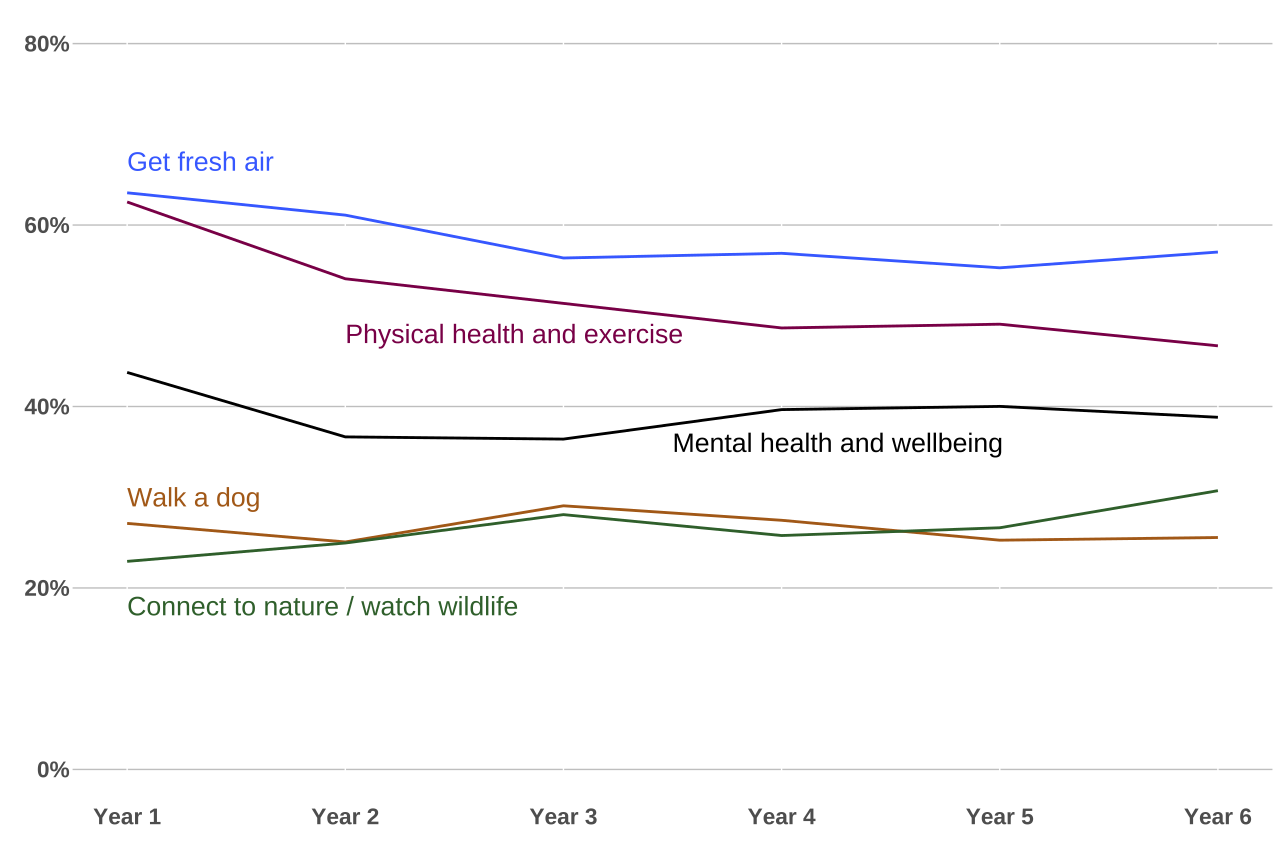
Chart notes
Source: M2A_SUB_Q5 What were the main three reasons for taking this visit. Answer options subset: For physical health and exercise, To get fresh air, For mental health and wellbeing, To walk a dog, To connect to nature / watch wildlife.
- Data collected between April 2020 and March 2026.
- The samples for this question were 4,212 (Year 1), 4,335 (Year 2), 4,450 (Year 3), 5,057 (Year 4), 4,859 (Year 5), 5,200 (Year 6).
- Only a subset of reasons has been presented. More information on the questionnaire is available here.
- ‘Don’t know’ / ‘Prefer not to say’ responses are not included in this chart.
- As this is a multi-select question the percentages will not add up to 100%.
- All percentages can be found under the ‘Reasons for visiting’ tab in the annual summary table.
Looking at the entire duration of data collection, Year 6 had a lower endorsement for fresh air (57%) compared to Years 2 and 1 (61% and 64%, respectively). For the answer option physical health Year 6 had a lower endorsement (47%) compared to Years 3 to1 (51% in Year 3, 54% in Year 2, and 63% in Year 1). And for the answer option mental health and wellbeing Year 6 (39%) only had a lower endorsement compared to Year 1 (44%).
The top three reasons for visiting (fresh air, physical health and exercise, and mental health and wellbeing) have stayed within the same rankings for the entire duration of data collection. However, the bottom two reasons out of the top five shown in the chart (walk a dog and connect to nature/watch wildlife) have exchanged 4th and 5th rankings over time. Year 6 is the first time that connecting with nature (31%) has a five-percentage point lead over walking a dog (26%).
8. Benefits of visiting green and natural spaces
Most respondents agreed that spending time outdoors is beneficial for their health:
- Eighty-nine percent of adults who had visited a green and natural space in the previous 14 days agreed that spending time outdoors was good for their physical health. This was a decrease compared to all previous years (Year 5 91%, Years 4 and 3 both 92%, Year 2 93%, and Year 1 94%).
- Eighty-nine percent of adults who had visited a green and natural space in the previous 14 days agreed that spending time outdoors was good for their mental health. This was similar to Years 5 and 4 (90% and 89%, respectively), though slightly lower than in Year 3 (90%), and Years 2 and 1 (92% for both).
Being in nature makes most people happy:
- In Year 6, 84% of adults agreed that being in nature makes them very happy. This was similar to Years 5 and 4 (85 and 84%, respectively) and Year 1 (82%), and an increase from Years 3 and 2 (both 81%).[footnote 3]
- Two thirds of adults agreed that they feel part of nature (67%). This was higher than in all previous years (62% in Year 5, 61% in Year 4, 59% in Years 3 and 2, and 58% in Year 1).[footnote 4]
Chart 8-1 Percentage who agree / disagree with the statement ‘Being in nature makes me very happy’ between April 2020 and March 2021 (Year 1), April 2021 and March 2022 (Year 2), April 2022 and March 2023 (Year 3), April 2023 and March 2024 (Year 4), April 2024 and March 2025 (Year 5), and April 2025 and March 2026 (Year 6).
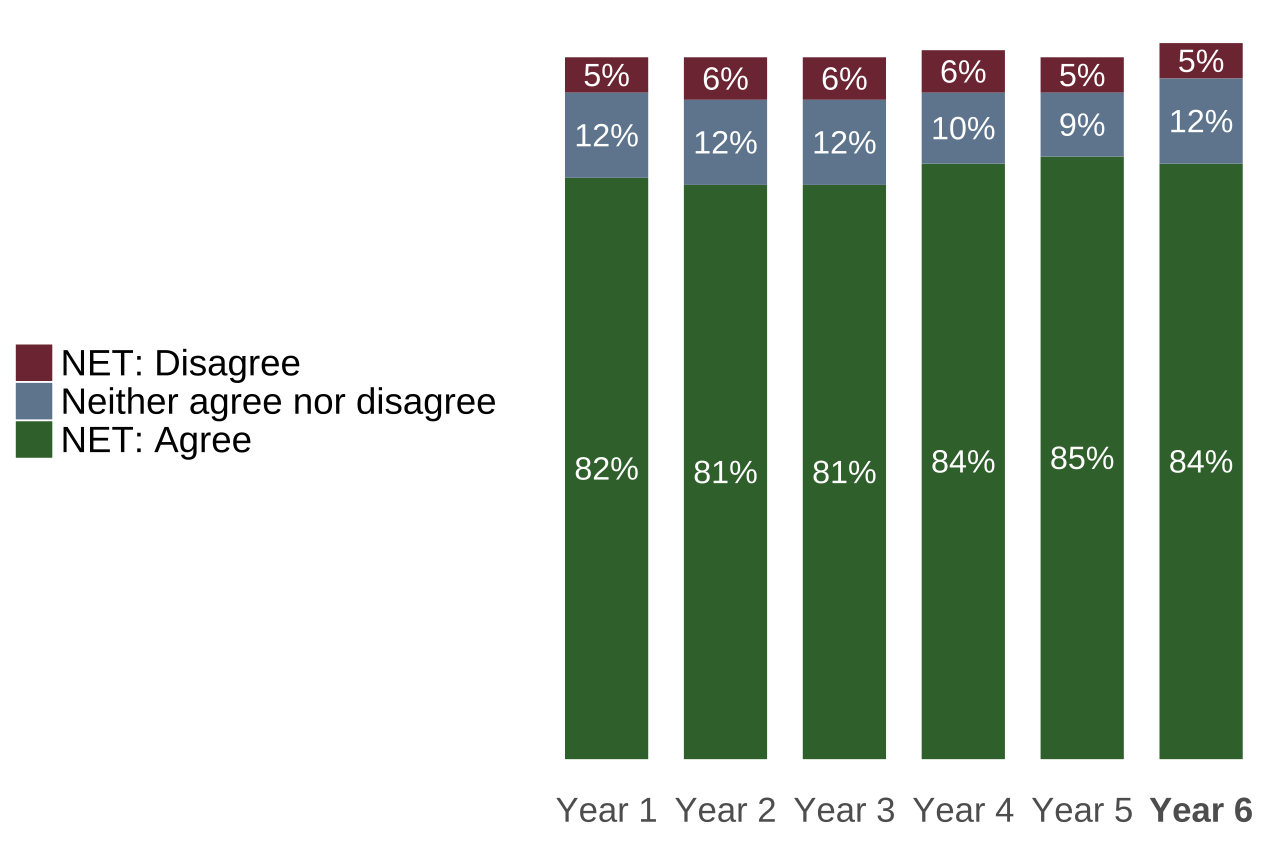
Chart notes
Source: M1_Q6_b How much do you agree with the following: Being in nature makes me very happy.
- Data collected between April 2020 and March 2026.
- Responses taken from NET Agree (‘Strongly agree’ and ‘Agree’), neither agree nor disagree, and NET disagree (‘Strongly disagree’ and ‘Disagree’) values.
- ‘Don’t know’ / ‘Prefer not to say’ responses are not included in this chart – bars do not sum to 100%.
- The samples for this question were 23,314 (Year 1), 24,987 (Year 2), 24,987 (Year 3), 4,954 (Year 4), 5,031 (Year 5) 5,002 (Year 6)[footnote 5].
- All percentages can be found under the ‘Benefits’ tab in the annual summary table.
Feeling happy in nature and feeling part of nature are both puzzle pieces of a bigger picture of feeling connected to nature. Nature connection describes how different people think, feel about, and experience nature. Another way to think about it is the relationship that people have with nature. Just like any relationship with a human or any other being, there are different aspects to the complex relationships that people form. Nature connection is related to certain aspects of the health and wellbeing of a person.
Fewer than half of adults feel highly connected to nature:
- In Year 6, when asked how connected they feel to nature, 46% of people described their connection as high, 31% of people described their connection as low, and 23% described their connection as moderate.
- While high nature connection remained about the same in Years 6, 5 and 4, there was a decrease in moderate nature connection (Year 6 23% compared to Years 5 and 4 at 25%) and an increase in low nature connection (Year 6 31% compared to Year 5 30% and Year 4 29%).
Chart 8-2 How connected people feel to nature in Year 6 (April 2025 – March 2026).
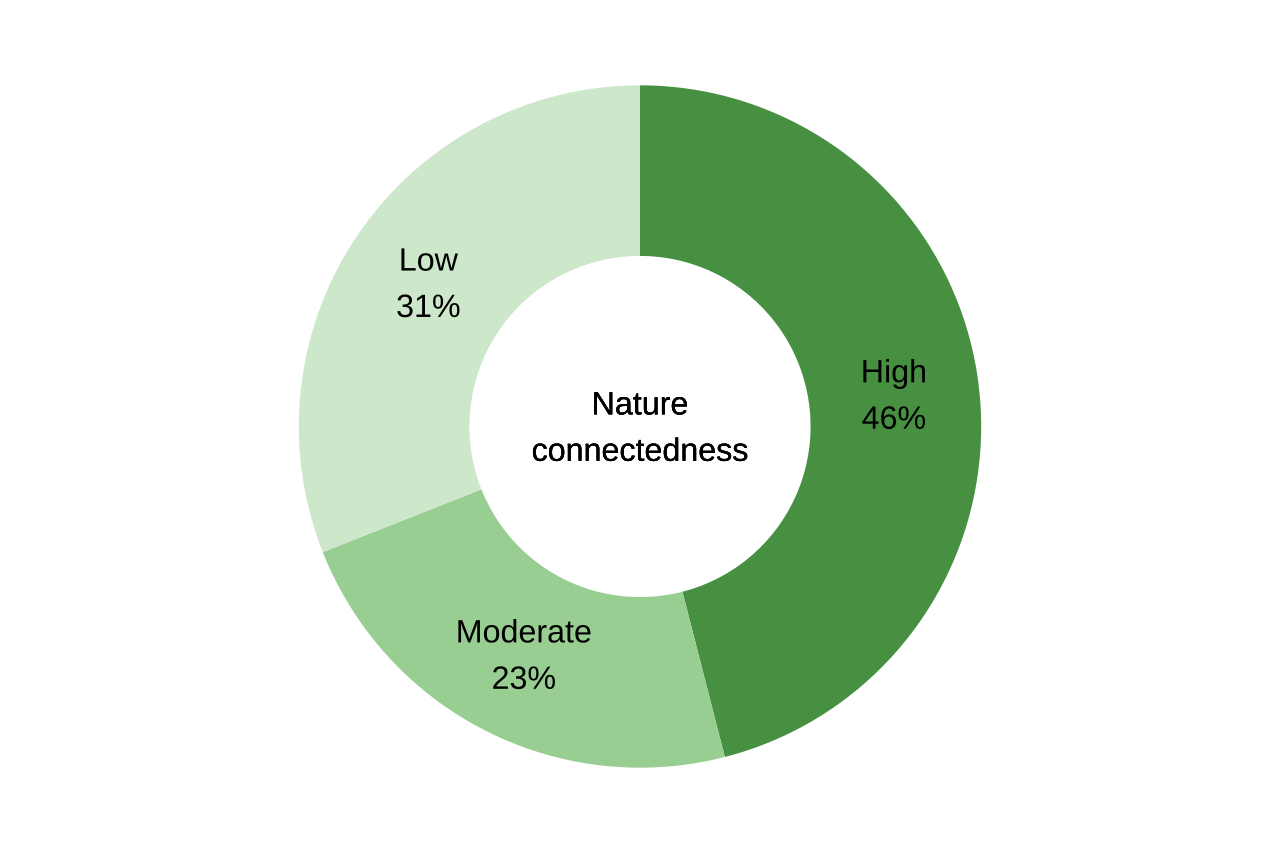
Chart notes
Source: M1_Connect How connected do you feel to nature? Please choose the picture that best describes your relationship to nature.
- Data collected between April 2025 and March 2026.
- Respondents are asked to select one pair of circles out of a choice of seven to describe their relationship with nature. One circle is labelled with ‘me’, the other with ‘nature’. The pairs of circles differ in the degree of overlap, going from two separate circles (A), gradually increasing in the overlap (B-F), until the two circles completely overlap to become one circle (G).
- Responses taken from NET Low (A, B, C), Moderate (D), and NET High (E – G).
- The sample for this question was 25,034.
- All percentages can be found under the ‘Benefits’ tab in the annual summary table.
People feel greater nature connection when local greenspaces are a short walk away:
- For people who can walk to their nearest greenspace within 5 minutes or less, there is a greater percentage of people with high nature connection (49%) compared to all other walking distances (6-15 minutes 46%, 16-30 minutes 44%, 31-45 minutes 40%, more than 45 minutes 43%, and people who never walk to their nearest greenspace 26%).
- Inversely, for people who can walk to their nearest greenspace within 5 minutes or less, there is a smaller percentage of people with low nature connection (27%) compared to all other walking distances (6-15 minutes 29%, 16-30 minutes 34%, 31-45 minutes 40%, more than 45 minutes 39%, and people who never walk to their nearest greenspace 59%).
Chart 8-3 Percentage of adults in England in each nature connection category by their walking distance to their nearest local green space between April 2025 to March 2026 (Year 6).
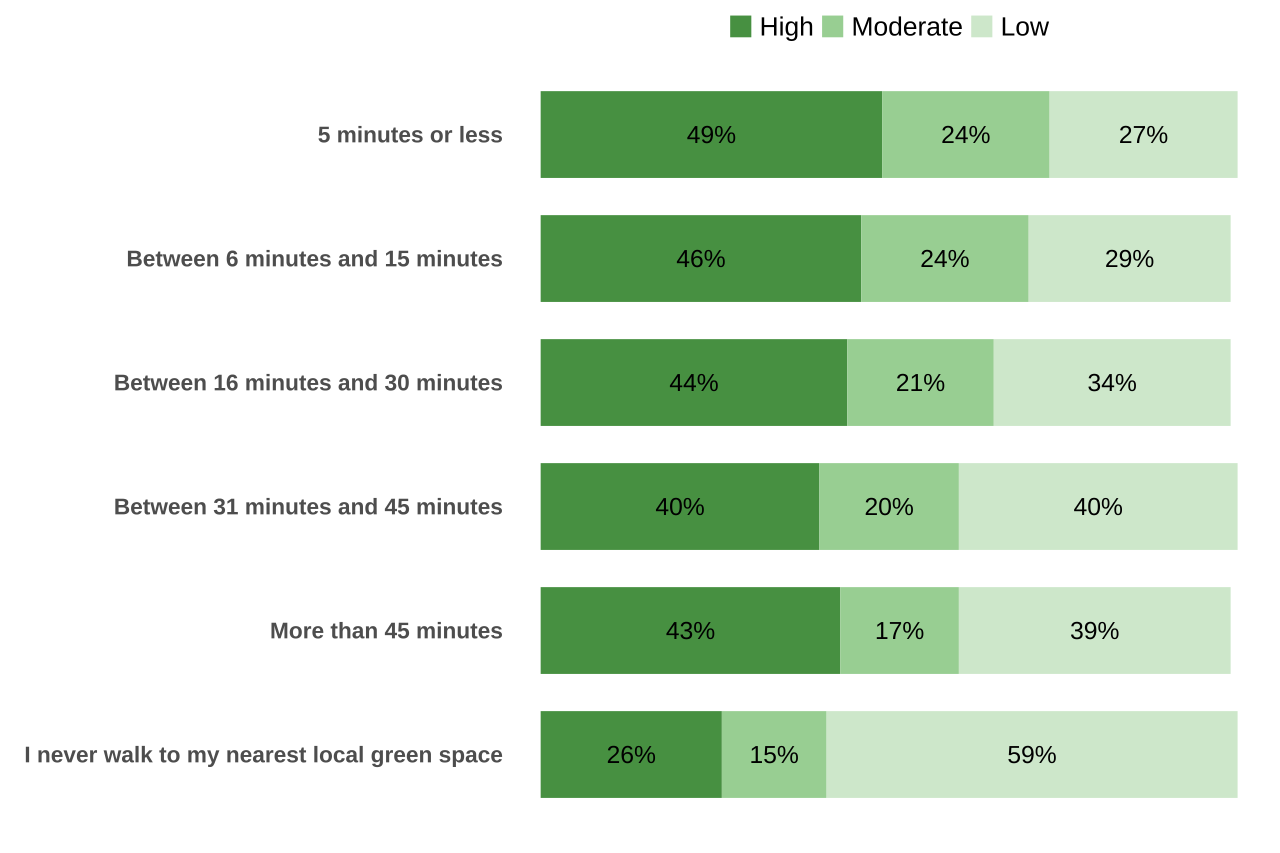
Chart notes
Source: M1_Walk_a How long does it take you to walk to your nearest local green and natural space? and M1_Connect How connected do you feel to nature? Please choose the picture that best describes your relationship to nature.
- Data collected between April 2025 and March 2026.
- The samples for this question were 7,401 (5 minutes or less), 10,011 (between 6 and 15 minutes), 4,641 (between 16 and 30 minutes), 1,513 (between 31 and 45 minutes), 698 (More than 45 minutes), 749 (I never walk to my nearest local green space).
- Don’t know’ / ‘Prefer not to say’ responses are not included in this chart – bars do not sum to 100%.
- All percentages can be found under the ‘Benefits’ tab in the annual summary table.
9. Not spending time visiting green and natural spaces
Bad health was the biggest barrier to visiting green spaces when focusing on visit frequency:
- Over one in ten adults who reported having bad health answered that they never visited a green space in the last year (12%).
- Six percent of adults aged over 65 years old answered that they never visited a green space in the last year.
- Six percent of adults who identify as any other ethnic group or background answered that they never visited a green space in the last year.
- Five percent of adults living in deprived areas answered that they never visited a green space in the last year.
All of the percentages above need to be considered with the overall small percentage (3%) of people in Year 6 who stated that they never visited a green space in the last year (see Chart 3-2). This percentage is also represented in the yellow bar in the England total at the bottom of Chart 9-1 below. When looking at a breakdown of the people who responded that they never visited a green space in the last year, only percentages that round to 5% or over are labelled in the yellow part representing ‘Never’ in Chart 9-1 below.
Chart 9-1 Visit frequency by six demographic variables (health, age, deprivation, ethnicity, gender, urban/rural) in Year 6 (April 2025 to March 2026).
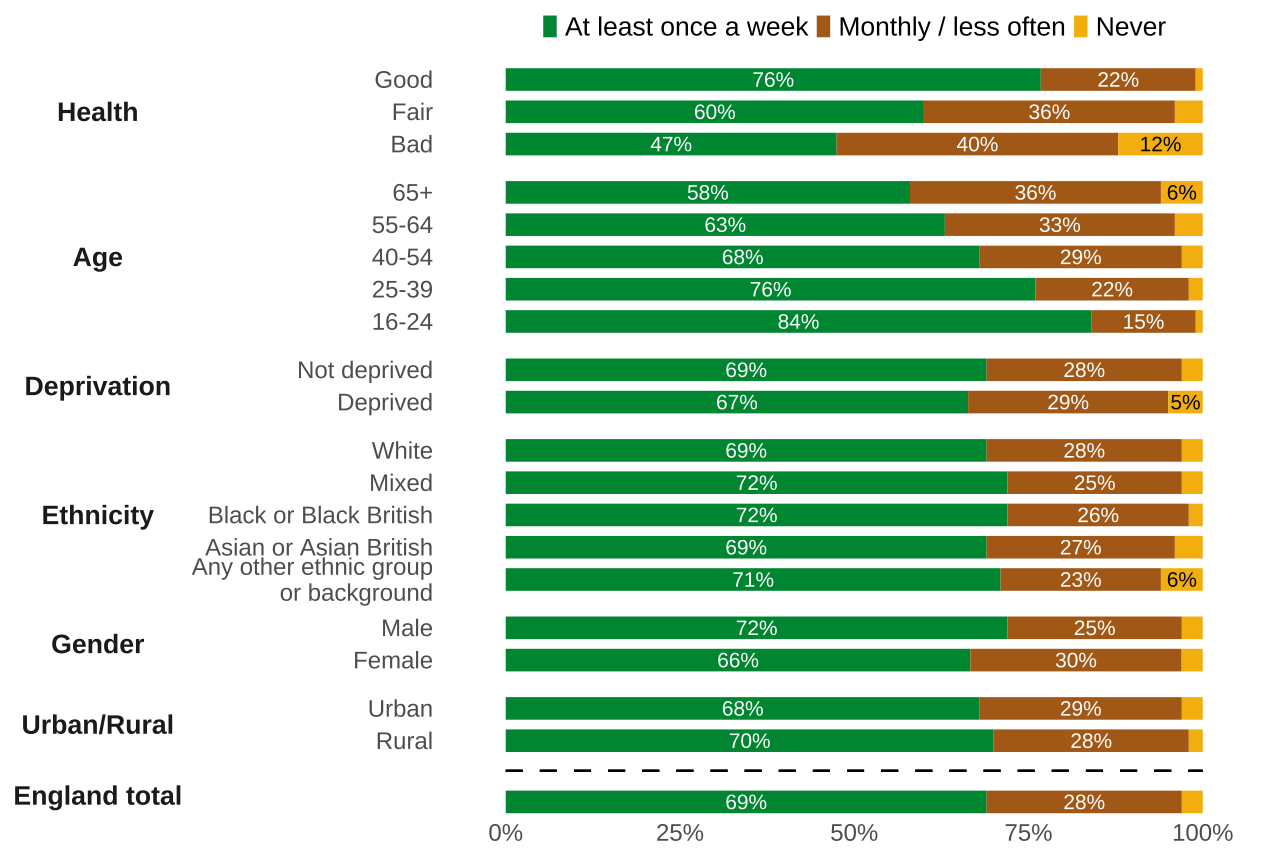
Chart notes
Source: M1_Q1 In the last 12 months, how often, on average have you spent free time outside in green and natural spaces?
- Data collected between April 2025 and March 2026.
- The samples for this question were 3,214 (16-24), 6,161 (25-39), 5,777 (40-54), 4,061 (55-64), 5,821 (65+); 21,105 (White), 500 (Mixed), 1,274 (Asian or Asian British), 1,959 (Black or Black British), 191 (Any other ethnic group or background); 12,028 (Male), 12,980 (Female); 16,793 (Good health), 6,629 (Fair health), 1,612 (Bad health); 4,376 (Deprived), 14,813 (Not Deprived); 2,605 (Rural), 16,584 (Urban).
- ‘Don’t know’ / ‘Prefer not to say’ responses are not included in this chart.
- Deprived in this report refers to the households in the bottom 20% of the IMD – Index of Multiple Deprivation (see glossary - deciles 1 and 2, out of ten total).
- Self-reported health (Q57) was aggregated to three categories: very good/good, fair, and bad/very bad.
- Only percentages that round to 5% or over are labelled in the chart. For any of the percentages not shown in the chart, please have a look at the annual summary table.
- All percentages can be found under the ‘Barriers’ tab in the annual summary table.
Over six in ten people without a visit in the last 14 days would have liked to spend more free time outside:
- Over six in ten adults (62%) who had not visited a green space in the last 14 days would have liked to spend more free time outside in Year 6. This was lower than in all previous years (65% in Years 5 and 4, 67% in Year 3, 69% in Year 2, and 71% in Year 1).
The most common reason cited for not spending free time outside was bad/ poor weather:
- The most common reasons cited for not spending free time in green and natural spaces in the previous 14 days in Year 6 were bad/poor weather (36%), poor physical health (27%), being too busy at home (23%), and being too busy with work/family commitments (19%).
- The ranking for the top four endorsed reasons has stayed the same since Year 3.
The ranking of reasons for not visiting differs depending on how frequently people spent free time in green and natural spaces (based on Year 6 to Year 3 data):
-
For people who say they never spend free time in green and natural spaces the top three rankings are:
Physical health (36%), bad weather (24%), not interested (20%)
-
For people who visit green and natural spaces monthly or less often:
Bad weather (44%), physical health (27%), busy at home (25%), and
-
For people that visit at least once a week:
Bad weather (37%), busy at home (23%), busy at work/family (21%).
Chart 9-2 Reasons for not spending time in green and natural spaces by adults who had not visited a green or natural space in the last 14 days by visit frequency with data from April 2022 to March 2026.
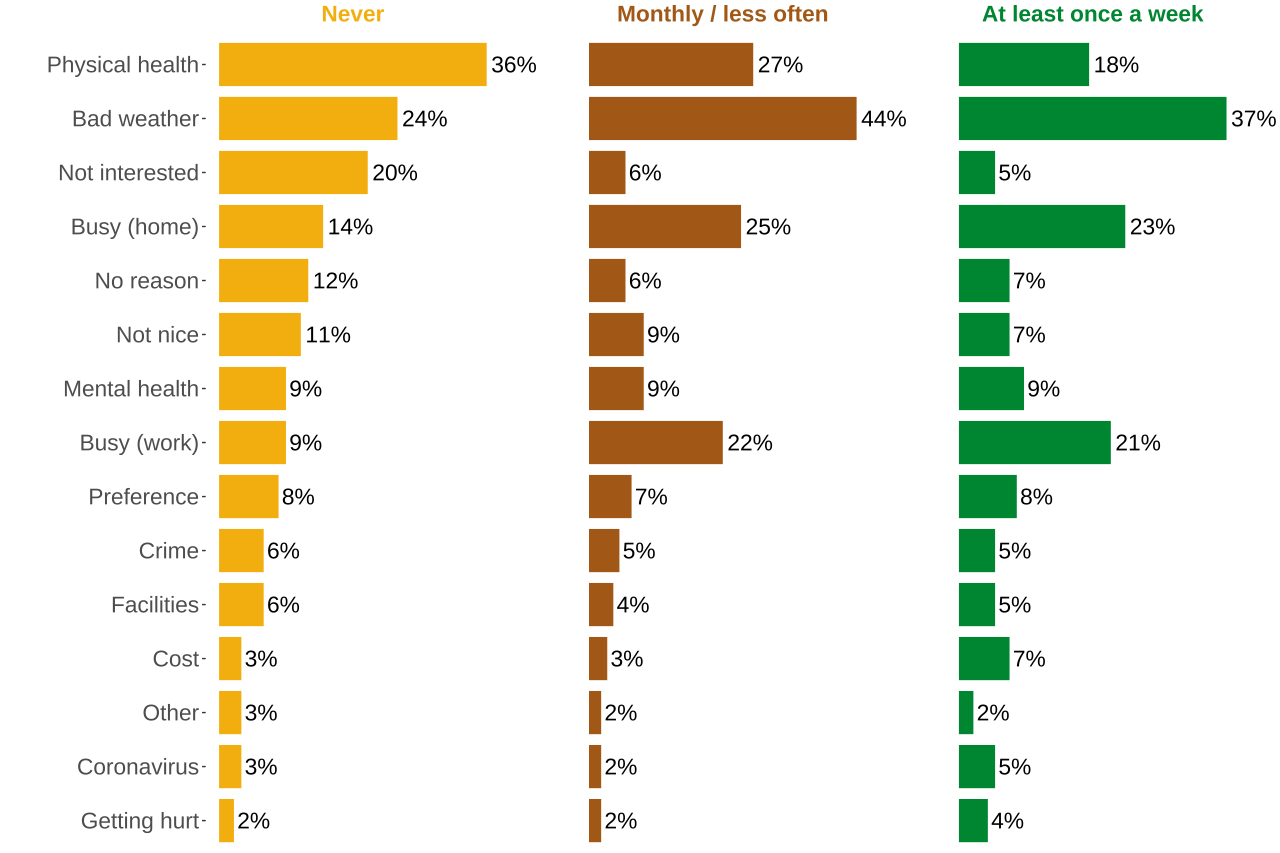
Chart Notes
Source: Q27A / M2B_Q2 What was the main reason or reasons for not spending free time outdoors in the last 14 days? And M1_Q1 In the last 12 months, how often, on average, have you spent free time outside in green and natural spaces?
- Data collected between April 2022 and March 2026.
- This is based on aggregate data from Year 3 - Year 6 (April 2022 – March 2026) due to small sample sizes for ‘Never’ visiting. The years most affected by Covid (Years 1 and 2) were excluded.
- The samples for this question were 2,706 (Never visiting), 13,887 (Visit less than once a week), and 8,093 (Visit at least once week).
- The reasons shown in the chart have been abbreviated, the full list can be found in the annual summary table (‘Barriers’ tab).
- ‘Don’t know’ / ‘Prefer not to say’ responses are not included in this chart.
- As this is a multi-select question the percentages will not add up to 100%.
- All percentages can be found under the ‘Barriers’ tab in the annual summary table.
9.1 Concerns and worries from people who did not visit in the last 14 days
Nearly two thirds of people who had not visited green and natural spaces in the last 14 days had concerns about visiting green spaces:
- In Year 6, just over a third of people (35%) who had not visited green and natural spaces reported having no general concerns or worries about visiting green and natural spaces. In turn, there were nearly two thirds of people (65%) that did have concerns about visiting green and natural spaces.
- For those people who did have concerns (65%), the five most common concerns in Year 6 among people who had not visited green and natural spaces in the previous 14 days were:
- Anti-social behaviour (25%),
- Visiting after dark (24%),
- A lack of facilities (such as toilets, benches, and baby changing) (23%),
- Fear of crime (including physical and/or verbal abuse, theft, damage to car etc) (18%), and
- Being on my own / isolated (16%).
The ranking of worries or concerns differs depending on the walking distance to the nearest local greenspace (based on Year 6 to Year 3 data):
- The percentage of people without concerns is highest for people who never walk to their nearest local greenspace (41%), second highest for people who can walk to their nearest local greenspace in less than 15min (36%), and the lowest for people who can walk to their nearest local greenspace in more than 15 minutes (27%).
-
For people who say they never walk to their nearest local greenspace the top three worries or concerns are:
Lack of facilities (28%), Anti-social behaviour (21%), being isolated (18%).
-
For people who can walk to their local greenspace in less than 15 minutes:
Dark (26%), Anti-social behaviour (25%), facilities (23%).
-
For people who can walk to their local greenspace in more than 15min:
Anti-social behaviour (26%), facilities (25%), dark (24%).
Chart 9-3 Concerns and worries of adults who had not visited a green or natural space in the last 14 days by walking distance to the nearest greenspace with data from April 2022 to March 2026.
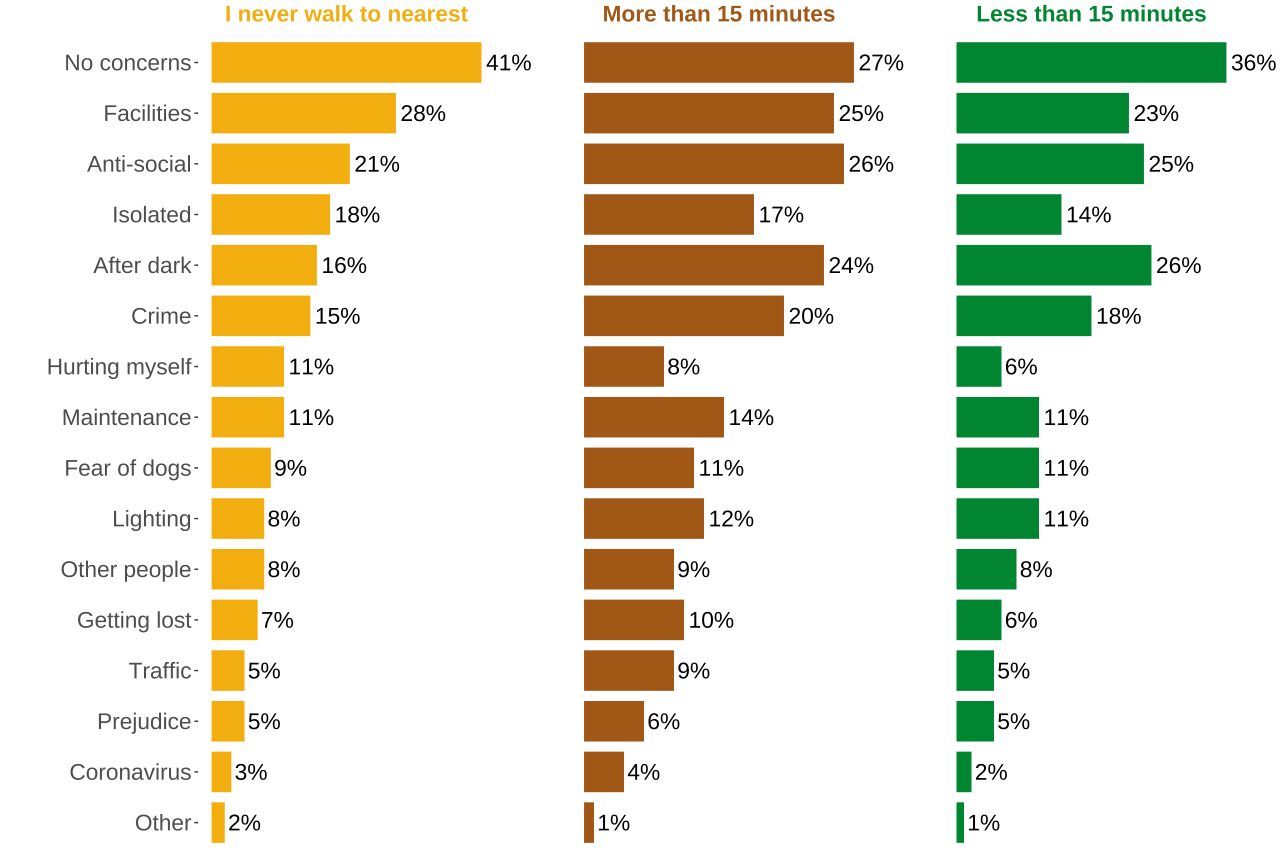
Chart notes
Source: Q29 / M2B_Q4A Thinking about visiting green and natural spaces, are you concerned or worried by any of the following? And M1_Walk_a How long does it take you to walk to your nearest local green and natural space? which was recoded to <15min, >15min, I never walk to my nearest local green space.
- Data collected between April 2022 and March 2026.
- This is based on aggregate data from Year 3 - Year 6 (April 2022 – March 2026) due to small sample sizes for ‘I never walk to my nearest greenspace’. The years most affected by Covid (Years 1 and 2) were excluded.
- The samples for this question were 1,855 (I never walk to my nearest local greenspace), 5,198 (More than 15 minutes), and 9,895 (Less than 15 minutes).
- The concerns shown in the chart have been abbreviated, the full list can be found in the annual summary table (‘Barriers’ tab).
- ‘Don’t know’ / ‘Prefer not to say’ responses are not included in this chart.
- As this is a multi-select question the percentages will not add up to 100%.
- All percentages can be found under the ‘Barriers’ tab in the annual summary table.
10. Environmental concerns and actions
Most people said that protecting the environment was important to them:
- In both Years 6 and 5, over eight in ten people (87%) said that protecting the environment was important to them. This was similar to Year 4 (88%) and Years 3, 2 and 1 (all 86%).
- Also, over eight in ten people (82%) said they were going to make changes to their lifestyle to protect the environment in Year 6, which was a slight decrease from 83% in Year 5.
Though there is a high level of agreement that protecting the environment is important to people, this can be put into a broader context by looking at how the environment/climate change ranks when considering a wide range of issues facing the UK.
The environment/climate change was the fifth most commonly selected issue facing the UK:
The Adults’ People and Nature Survey also asked respondents how important the environment is to people in relation to other issues. Survey respondents are asked to select up to three of the most important issues facing the UK.
- In Year 6, ‘The environment/climate change’ was the fifth most commonly selected issue facing the UK, chosen by 18% of people. There was a steady decrease from the highest endorsement peak of 29% in Year 2 to Year 6 (21% in Year 5, 24% in Year 4, 26% in Year 3).
- The ranking of ‘The environment/climate change’ in relation to other issues facing the UK has continued to drop from its highest at third in Year 2 and 1, to fourth in Year 3, to fifth in Years 6, 5 and 4.
- In percentage point change, the answer option ‘The environment/climate change’ has seen less change than the answer options ‘Health / NHS / Coronavirus’, ‘Rising prices / inflation / cost of living’, and ‘Immigration’.
Chart 10-1 What people think are the most important issues facing the UK between April 2020 to March 2026.
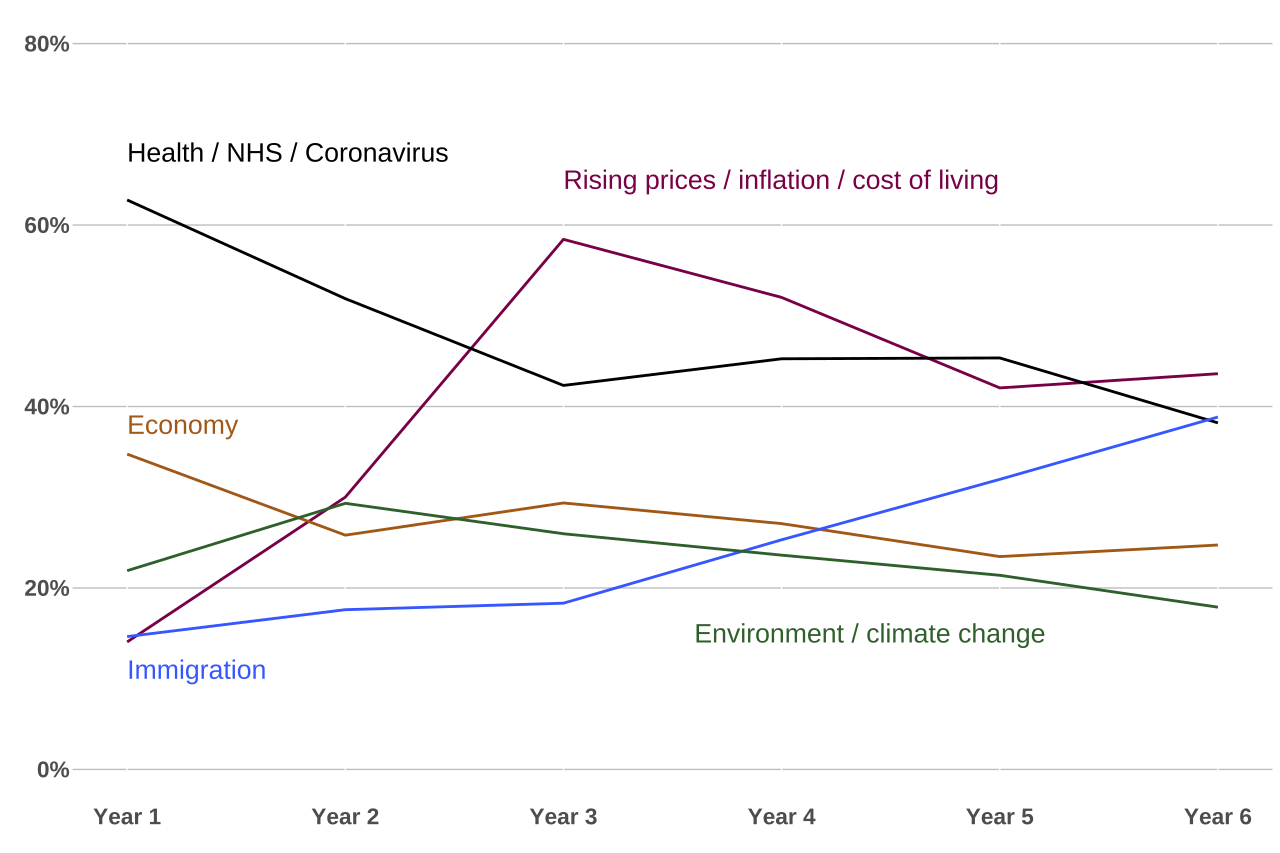
Chart notes
Source: M4_Q1 What do you think are the most important issues facing the United Kingdom at the moment? Answer options subset: The environment / climate change, Health / NHS / Coronavirus, Economy, Rising prices / inflation / cost of living, Immigration.
- Data collected between April 2020 and March 2026.
- The samples for this question were 4,930 (Year 1), 5,024 (Year 2), 5,028 (Year 3), 4,954 (Year 4), 5,031 (Year 5), 5,002 (Year 6).
- Only a subset of issues have been presented. More information on the questionnaire is available here.
- ‘Don’t know’ / ‘Prefer not to say’ responses are not included in this chart.
- As this is a multi-select question the percentages will not add up to 100%.
- All percentages can be found under the ‘Environmental Attitudes’ tab in the annual summary table.
Climate change was the environmental issue most people are concerned about:
- The most common environmental concern was climate change, identified by 44% of respondents in Year 6. This was the same percentage as year 5, and a decrease from 47% in Year 4.
- Pollution of rivers, lakes and ground water was the second most common environmental concern identified by respondents in Year 6 (mentioned by 39% of adults). This was a decrease from 45% in Year 5 and 40% in Year 4.
- The third most common concern in Year 6 was plastic pollution (37%). This was similar to Year 4 and 5 (37 and 38%, respectively).
Chart 10-2 Environmental issues people are most concerned about between April 2023 and March 2024 (Year 4), April 2024 and March 2025 (Year 5) and April 2025 and March 2026 (Year 6).
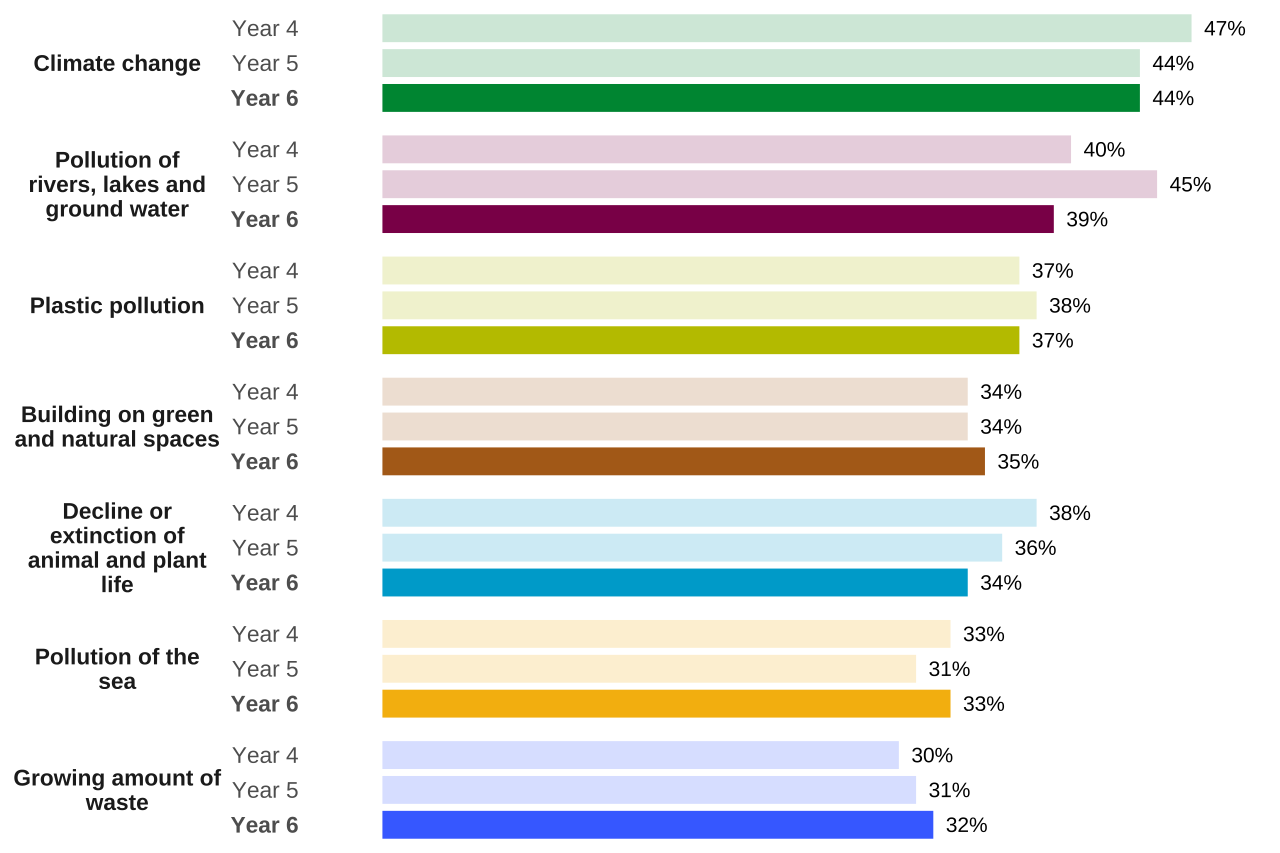
Chart notes
Source: M4_Q7 Below is a list of environmental issues. Please pick the four issues that you are most concerned about: Answer options subset: Climate change, Plastic pollution, Decline or extinction of animal and plant life, Pollution of rivers, lakes and ground water, Pollution of the sea, Building on green and natural spaces, Growing amount of waste.
- Data shown collected between April 2023 and March 2026.
- The samples for this question were 4,954 (Year 4), 5,031 (Year 5), and 5,002 (Year 6).
- Only a subset of issues has been presented in the chart. More information on the full set of answer options available in the questionnaire can be found here.
- ‘Don’t know’ / ‘Prefer not to say’ responses are not included in this chart.
- As this is a multi-select question the percentages will not add up to 100%.
- Chart ordered by magnitude of endorsement in Year 6 (April 2025 – March 2026).
- All percentages can be found under the ‘Environmental Attitudes’ tab in the annual summary table.
Recycling was the most common action taken by people to protect the environment:
- Almost eight in ten people reported that they had recycled items in Year 6 (79%). This remained the same for the Years 5 through to 3 (81% in Years 5, 4 and 3), but it was a decrease compared to Years 2 and 1 (83% in Year 2, and 85% in Year 1).
- Three quarters of adults reported they had brought their own bags when shopping (75% in Year 6). This was lower than in all previous years (Year 5 79%, Year 4 81%, Year 3 79%, Year 2 80% and Year 1 81%).
- Switching off lights and appliances was the third most commonly reported action at 69% in Year 6. This was a decrease compared to all previous years (73% in Year 5, 76% in Year 4, 75% in Year 3, 74% in Year 2 and 73% in Year 1).
Chart 10-3 Actions taken to protect the environment in the last month between April 2020 to March 2025.
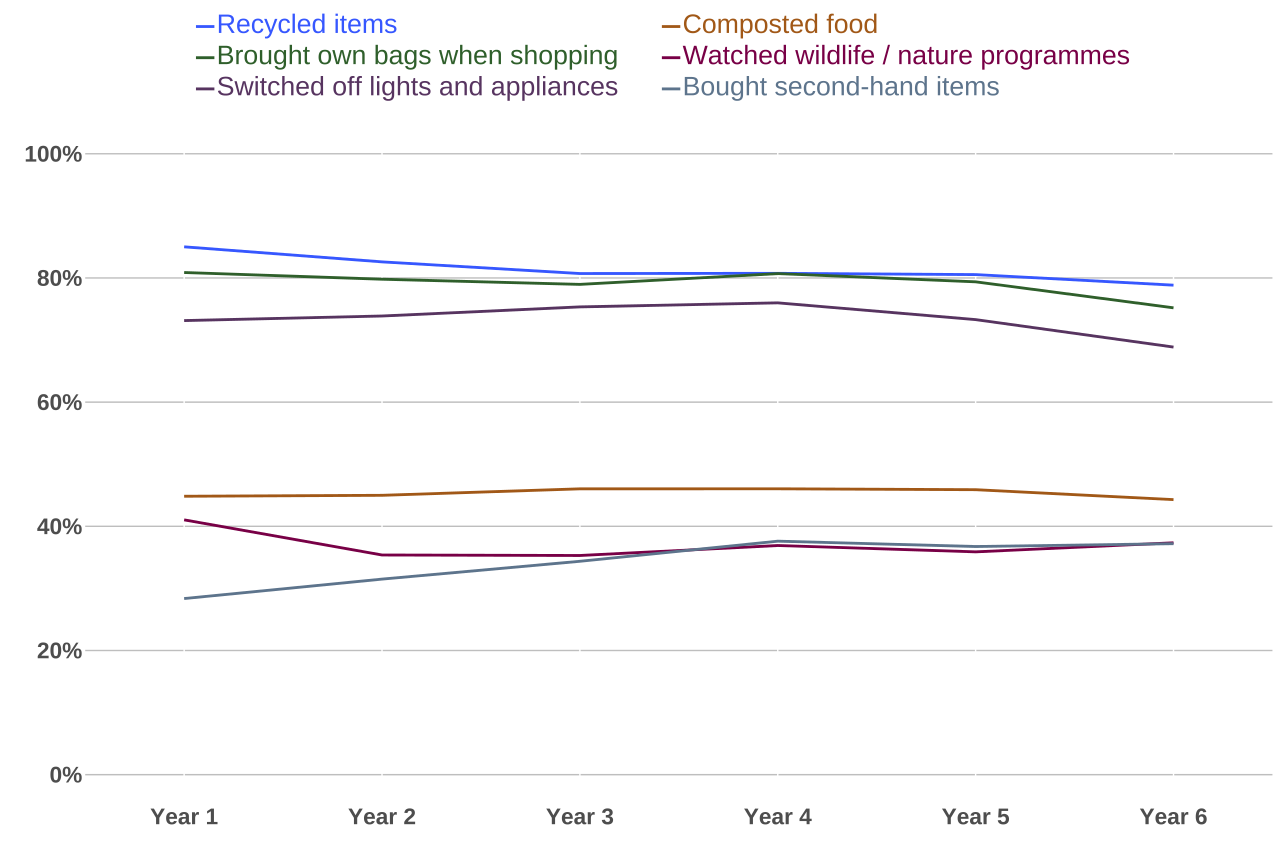
Chart notes
Source: M4_Q11 Thinking about the last month, which of the following have you done? Answer options subset: Recycled items, Brought your own bags when shopping, Switched off lights and appliances to save energy / to protect the environment, Composted food waste, or put food waste out for collection, Watched wildlife / nature programmes, Bought second-hand items.
- Data collected between April 2020 and March 2026.
- The samples for this question were 4,930 (Year 1), 5,024 (Year 2), 5,028 (Year 3), 4,954 (Year 4), 5,031 (Year 5), 5,002 (Year 6).
- Only a subset of actions have been presented. More information on the questionnaire is available here.
- ‘Don’t know’ / ‘Prefer not to say’ responses are not included in this chart.
- As this is a multi-select question the percentages will not add up to 100%.
- All percentages can be found under the ‘Environmental Attitudes’ tab in the annual summary table.
As Chart 10-3 shows, there is a grouping of two sets of behaviours (recycling items, bringing own bags when shopping, and switching off lights and appliances are grouped relatively closely, as are composting food waste, watching wildlife/ nature programmes, and buying second-hand items).
Recycling items saw a significant decline from 85% in Year 1 to 79% in Year 6. Most other actions for the environment saw less difference over the previous years. Buying second-hand items has significantly increased in Years 6, 5 and 4, (37%, 37% and 38%, respectively) compared to Years 3, 2 and 1 (34%, 31% and 28%, respectively).
11. Further information about using PANS data
Further information on the People and Nature Survey is available on Gov.uk. New data are published on a quarterly basis.
In addition to the published reports and data releases, Natural England has developed a data viewer that weights the data and provides breakdowns for many of the questions in the survey.
If you have a specific research question that cannot be explored on the data viewer, a copy of the dataset can be downloaded from UK Data Service. Natural England has published a technical report providing full methodological background to the research, including how the data were collected and how the questions, sample and weights were developed. If you wish to analyse the data yourself, please ensure you weight the data appropriately following the weighting guidance included in the technical report.
If you use the dataset for your own analysis or use figures or charts from the report or the data viewer, please use the following citation: Natural England, 2026, Adults’ People and Nature Survey Annual Report Year 6 from April 2020 – March 2026.
If you have any questions that are not answered by the published materials, please contact the People and Nature Survey project team: people_and_nature@naturalengland.org.uk.
Here are further details on what kinds of questions/topics are being asked in the modules that have not been focused upon in this report:
General experiences of green and natural spaces:
- General/local greenspace standards.
- More in-depth detail on Nature connection (measured via the Nature Connection Index (NCI) and the Inclusion in Nature Scale (INS)).
Visits taken to green and natural spaces in last 14 days:
- Main visit in past 14 days: destination/s, start place, activities, benefits of visit, transport, who with, physical exertion, money spent, quality of place/s visited.
Children (asking parent/guardian):
- Frequency of time spent outside in past 12 months.
- Places visited.
- Visit partners.
- Benefits of time outdoors.
- Reasons for not spending more time outdoors.
- Time spent in private garden.
Environmental attitudes:
- Importance of protecting the environment.
- Reasons to look after the environment.
- Concern about damaging natural environment.
- Perceived variety of animal / plant life.
- Concern about loss of variety.
- Environmental social action.
- Environmental lifestyle choices.
- Eating meat.
- Driving.
- Aeroplane use.
- Energy use.
- Water waste.
- The number of things bought.
- Responsibility for environmental damage.
Gardens:
- Frequency of time spent in gardens.
- Importance of gardens.
- Reasons for spending time in garden.
- Benefits of time in garden.
- Description of garden.
- Wildlife friendly gardening behaviours.
12. Glossary
Deprived refers to the 20% most deprived households in England. It is based on the bottom 20% of the IMD (Index of Multiple Deprivation) deciles.
Green and natural spaces are defined in this survey as green and blue spaces in towns and cities (e.g. parks, canals); the countryside (e.g. farmland, woodland, hills and rivers); the coast (e.g. beaches, cliffs) and activities in the open sea; visits of any duration (including short trips to the park, dog walking etc.). They do not include: gardens; outside spaces visited as part of someone’s employment; spaces outside the UK. Additional questions are asked about private gardens.
IMD stands for the Index of Multiple Deprivation. It is a measure which allows the ranking of each postcode from least deprived to most deprived based on multiple dimensions of neighbourhood deprivation. Seven main types of deprivation are considered in the IMD 2025 – income, employment, education, health, crime, access to housing and services, and living environment – and these are combined to form the overall measure of multiple deprivation. For more details and an FAQ outlining the facets included in the England-specific IMD click here.
Travel, active and passive. In order to sensibly group transport options, the choice was made to group human-powered ways of transport together as active travel (walking, including using a mobility aid such as a wheelchair or a mobility scooter, or cycling), and group machine-powered transport together as passive travel (car, van, motorbike, and public transport such as train, bus, coach). This is not a clear-cut grouping as electric bikes or wheelchairs with a motor may still be reported within the active travel category.
Visits to green and natural spaces are defined in this survey as visits to green spaces in towns and cities (e.g. parks, canals); the countryside (e.g. farmland, woodland, hills and rivers); the coast (e.g. beaches, cliffs) and activities in the open sea. This includes: visits of any duration (including short trips to the park, dog walking etc.). They do not include: time in gardens; outside spaces visited as part of someone’s job; or time spent outside the UK. Additional questions are asked about private gardens.
Years. When referring to years and numbers in text, these are based on the financial years with the first year of data collection starting in April 2020. These are the exact months and years that are referenced:
| Year 1 | April 2020 - March 2021 |
| Year 2 | April 2021 - March 2022 |
| Year 3 | April 2022 - March 2023 |
| Year 4 | April 2023 - March 2024 |
| Year 5 | April 2024 - March 2025 |
| Year 6 | April 2025 - March 2026 |
Z-test is a statistical test that compares two population means with each other and produces a probability of their difference being due to chance.
13. Related Links
People and Nature questionnaire: Includes the link to the People and Nature Survey questions.
People and Nature Survey information: Further information on the People and Nature Surveys for England.
The Countryside Code: Statutory guidance on respecting, protecting and enjoying the outdoors.
The G indicators: Data from the Adults’ People and Nature Survey contribute to the outcome indicator framework for the 25 Year Environment Plan, now the Environmental Improvement Plan - specifically the G indicators ‘Natural Beauty and Engagement’ (specifically, G3 ‘Enhancement of green and blue infrastructure’; G4 ‘Engagement with the natural environment’; G5 ‘People engaged in social action for the environment’; G6 ‘Environmental attitudes and behaviours’; and G7 ‘Health and wellbeing benefits’).
-
From April 2023 (start of Year 4) a question was introduced to all adults that selected “Don’t know” when asked about number of visits in the last 14 days. This new question asked, “Have you had one or more visits to green and natural spaces in the last 14 days?”. This is in line with recommendations from the Office for Statistics Regulation to increase the proportion of adults reporting whether they had any visits in the last 14 days. See here. ↩
-
Due to a change to question wording from March 2021 the comparison to the Year 1 percentage is not straightforward and has been omitted. ↩
-
From April 2023 (Year 4) onwards this question moved from Module 1 to the environmental Module 4 and the change observed may be due to this methodological change. ↩
-
From April 2023 (Year 4) onwards this question moved from Module 1 to the environmental Module 4 and the change observed may be due to this methodological change. ↩
-
From April 2023 (Year 4) onward this question was moved from Module 1 (asked of the whole sample) into Module 4 (asked of around 20% of the sample). ↩