The People and Nature Survey for England: Year 2 Annual Report - Data and publications (April 2021 - March 2022) (Official Statistics) main findings
Updated 18 May 2023
Applies to England

© Crown copyright 2023
This publication is licensed under the terms of the Open Government Licence v3.0 except where otherwise stated. To view this licence, visit nationalarchives.gov.uk/doc/open-government-licence/version/3 or write to the Information Policy Team, The National Archives, Kew, London TW9 4DU, or email: psi@nationalarchives.gov.uk.
Where we have identified any third party copyright information you will need to obtain permission from the copyright holders concerned.
This publication is available at https://www.gov.uk/government/statistics/the-people-and-nature-survey-for-england-year-2-annual-report-data-and-publications-april-2021-march-2022-official-statistics-main-findings/the-people-and-nature-survey-for-england-year-2-annual-report-data-and-publications-april-2021-march-2022-official-statistics-main-findings
1. What is the People and Nature Survey?
The People and Nature Survey for England is one of the main sources of data and statistics on how people experience and think about the environment. It began collecting data in April 2020 and has been collecting data since. So far, data is published that was collected between April 2020 and March 2022. Data is collected via an online panel of adults aged 16 years and older, in line with Government Statistical Service guidance on data collection during the COVID-19 pandemic.
The survey builds on the Monitor of Engagement with the Natural Environment (MENE) survey which ran from 2009 to 2019. Data from the People and Nature Survey for England enables users to:
- Understand how people use, enjoy, and are motivated to protect the natural environment.
- Monitor changes in use of the natural environment over time, at a range of different spatial scales and for key groups within the population.
- Understand how being in the natural environment can influence wellbeing.
- Understand environmental attitudes and the actions people take at home, in the garden and in the wider community to protect the environment.
This data contributes to Natural England’s delivery of statutory duties, informs Defra policy and natural capital accounting, and contributes to the outcome indicator framework for the 25 Year Environment Plan.
The Official Statistics in this publication are based on continuous online data collection between the 2nd of April 2020 and the 31st of March 2021 (Year 1) and the 1st of April 2021 and the 31st of March 2022 (Year 2). There were 24,994 surveys conducted in Year 1 and 24,987 in Year 2.
Chart 1-1 Structure of the People and Nature Survey questionnaire. People and Nature is an online panel survey, sampling around 2,000 adults monthly in England on a continuous basis.
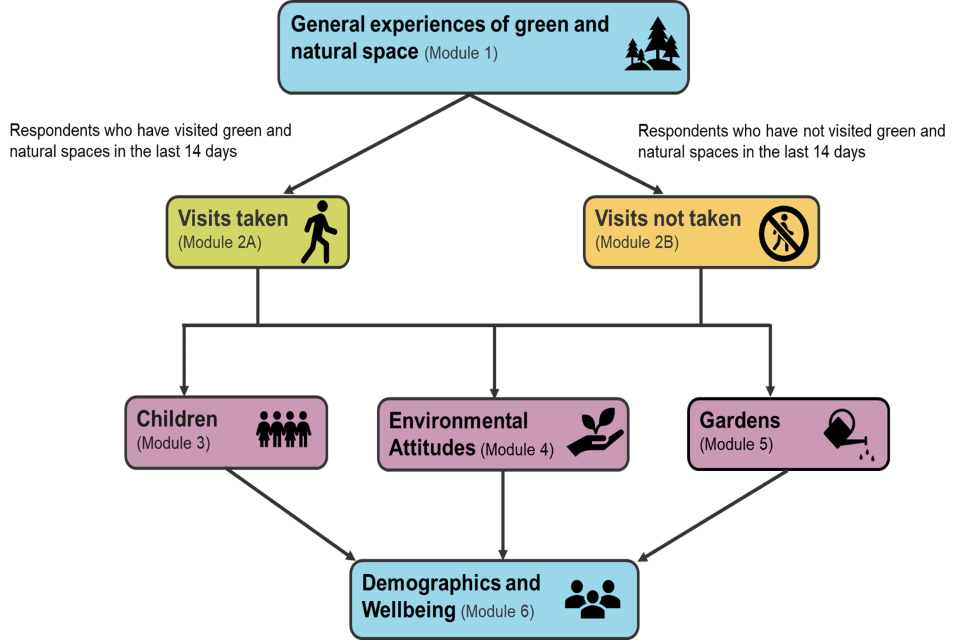
General experiences of green and natural space
Chart notes
(1) Data collected between April 2020 and March 2022 (inclusive).
(2) Module 1 and module 6 are asked to 100% of respondents.
(3) Module 2A is only asked to respondents who report they have visited a green and natural space in the last 14 days. These respondents are asked more specific questions relating to their visit, including the location, duration, activities, and benefits of their visit. This is estimated to be asked to around 60% of respondents.
(4) Module 2B is only asked to respondents who report they have not visited a green and natural space in the last 14 days. These respondents are asked about their reasons for not visiting and their access via transport. This is estimated to be asked to 40% of respondents.
(5) Module 3 is estimated to be asked to around 50% of respondents. These respondents are asked about their barriers to visiting and their reasons for not spending more time outside.
(6) Module 4 is asked to around 10% of respondents and includes questions relating to environmental attitudes and behaviours.
(7) Module 5 is estimated to be asked to 30% of respondents and includes questions on gardens and gardening behaviours.
A modular questionnaire has been designed to maximise the number of questions asked in the survey while maintaining a survey length that is not overly burdensome for respondents. Chart 1-1 provides a summary of the questionnaire modules. Only Module 1 and Module 6 are asked of all respondents. Other modules are asked of different subsets of respondents. Each chart presented in this report includes notes about the sample size where applicable. A more detailed run-down of the full questionnaire and sample sizes for each module can be found in questionnaire details for the adult survey.
2. Visits to green and natural spaces
Between April 2020 and March 2022, more than six in ten people (63%) surveyed had visited green and natural spaces in the previous 14 days:
- 63% of adults had visited a green and natural space in the previous 14 days between April 2021 – March 2022 (Year 2). This was similar (62%) between April 2020 – March 2021 (Year 1).
- 25% of adults had not visited a green and natural space in the previous 14 days between April 2021 – March 2022 (Year 2). This was slightly lower than between April 2020 – March 2022 (Year 1) (29%).
Chart 2-1 Proportion of adults in England (weighted percentage) visiting a green and natural space in the last 14 days. Between April 2020 and March 2022.
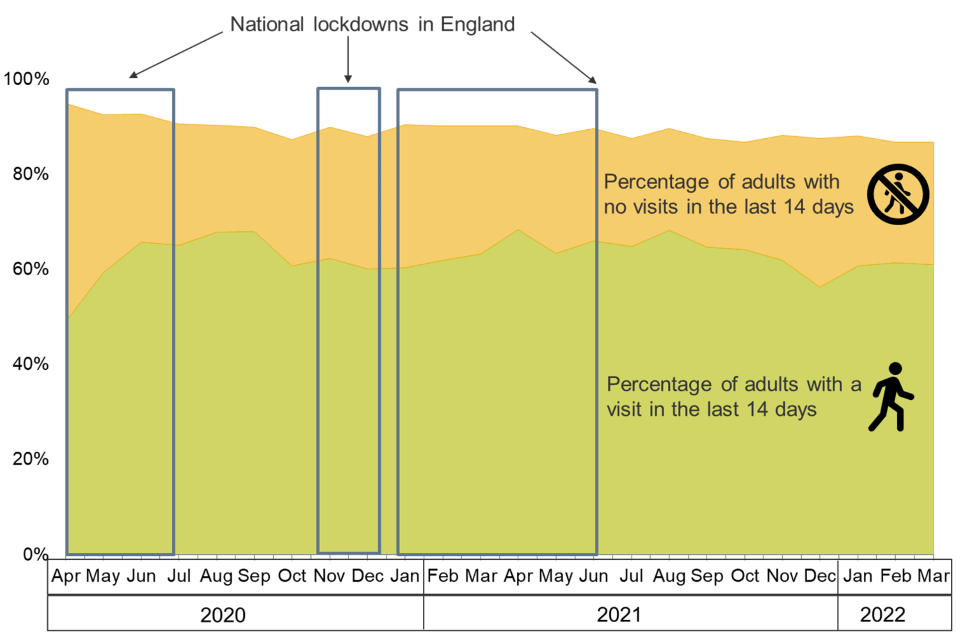
Trends in percentages of adults making visits during national lockdowns in England March 2020 to April 2022
Chart notes
Source:
Q6 / No_Of_Visits: How many times, if at all, did you make this type of visit to green and natural spaces in the last 14 days?
(1) Data collected between April 2020 and March 2022.
(2) The samples for this question were 1868 (April 2020), 1898 (May 2020), 1872 (June 2020), 1889 (July 2020), 1856 (August 2020), 1866 (September 2020), 1854 (October 2020), 1869 (November 2020), 1863 (December 2020), 1860 (January 2021), 1868 (February 2021), 1900 (March 2021), 1873 (April 2021), 1882 (May 2021), 1879 (June 2021), 1833 (July 2021), 1854 (August 2021), 1891 (September 2021), 1866 (October 2021), 1915 (November 2021), 1866 (December 2021), 1873 (January 2022), 1866 (February 2022), 1860 (March 2022).
(3) ‘Don’t know’ responses are not included in this chart.
As Chart 2-1 shows, in May and June 2020, the percentage of people who did take a visit increased, and accordingly, the percentage of people who did not take a visit fell. After the first national lockdown in the Spring of 2020, the proportion of people who have visited or not visited a green and natural space in the last 14 days remained relatively stable with small spikes or dips. The highest percentage of people visiting was recorded between June 2020 and September 2020 (68%) and between April 2021 and October 2021 (66%) and the lowest in April 2020 (49%) and December 2021 (56%).
3. Concerns about coronavirus and not spending time outdoors
Concerns about contracting or spreading coronavirus were no longer the most common factors reported that stopped people spending time outdoors between April 2021 and March 2022 (Year 2)
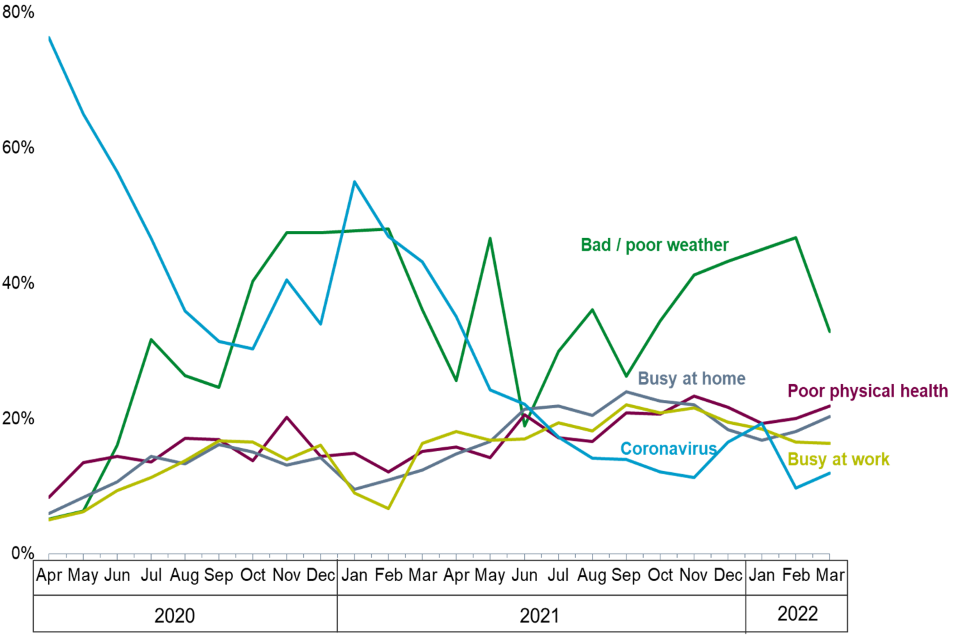
Among those that had not spent free time in green and natural spaces in the previous 14 days between April 2021 and March 2022 (Year 2), the most common reasons cited for this were bad/poor weather (36%), being too busy at home (20%), being too busy with work/family commitments (19%) and poor physical health (19%). As can be seen in Chart 3-1, bad/poor weather shows seasonal variation, and concern about contracting or spreading coronavirus, has changed over time in line with the perceived prevalence of the virus. The selection of other reasons shows smaller variation over the two years.
Chart 3-1 Reasons for not spending time in green and natural spaces by adults who had not visited a green or natural space in the last 14 days. Results from April 2020 to March 2022.
Trends in reasons for not making visits April 2020 to March 2022
Chart notes
Source:
Q27A / M2B_Q2: What was the main reason or reasons for not spending free time outdoors in the last 14 days? Bad / poor weather, Poor physical health, Busy at home, Busy at work, Coronavirus
(1) Data collected between April 2020 and March 2022.
(2) The samples for this question were: 958 (April 2020), 754 (May 2020), 647 (June 2020), 605 (July 2020), 569 (August 2020), 567 (September 2020), 676 (October 2020), 687 (November 2020), 729 (December 2020), 715 (January 2021), 696 (February 2021), 694 (March 2021), 597 (April 2021), 667 (May 2021), 650 (June 2021), 638 (July 2021), 593 (August 2021), 621 (September 2021), 659 (October 2021), 705 (November 2021), 783 (December 2021), 718 (January 2022), 714 (February 2022), 699 (March 2022).
(3) Only a subset of reasons have been presented – for more information on the questionnaire please visit The People and Nature Survey For England - PANS001 (naturalengland.org.uk).
(4) ‘Don’t know’ responses are not included in this chart.
The proportion of adults who said they did not spend time in green and natural spaces because of bad / poor weather was highest between November 2020 and February 2021 (48%) and lowest in April and May 2020 (6%).
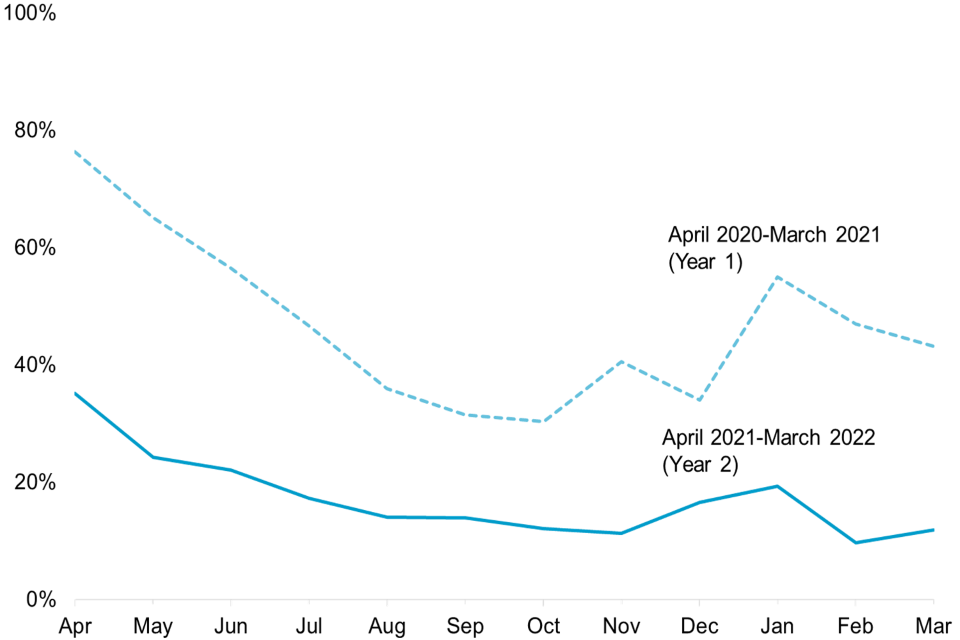
Chart 3-2 focuses on the reason ‘concern about contracting or spreading coronavirus’ and the monthly difference between April 2020 – March 2021 (Year 1) and April 2021 – March 2022 (Year 2). Among those that had not spent free time in green and natural spaces in the previous 14 days in Year 2, 17% of people did not spend free time outdoors to stop coronavirus spreading /due to government restrictions. This was a decrease from almost half (48%) of those without any visits in the previous 14 days reporting it as a barrier in Year 1.
Chart 3-2 Percentage of adults who did not spend time in green and natural spaces to stop coronavirus spreading/ government restrictions. Data between April 2020 and March 2021 (Year 1) and between April 2021 and March 2022 (Year 2).
Trends in percentages of adults making visits April 2020 to March 2022
Chart notes
Source:
Q27A / M2B_Q2: What was the main reason or reasons for not spending free time outdoors in the last 14 days? Stop coronavirus spreading/ government restrictions
(1) Data collected between April 2020 and March 2022.
(2) The samples for this question were: 958 (April 2020), 754 (May 2020), 647 (June 2020), 605 (July 2020), 569 (August 2020), 567 (September 2020), 676 (October 2020), 687 (November 2020), 729 (December 2020), 715 (January 2021), 696 (February 2021), 694 (March 2021), 597 (April 2021), 667 (May 2021), 650 (June 2021), 638 (July 2021), 593 (August 2021), 621 (September 2021), 659 (October 2021), 705 (November 2021), 783 (December 2021), 718 (January 2022), 714 (February 2022), 699 (March 2022).
(3) Only a subset of reasons have been presented – for more information on the questionnaire please visit The People and Nature Survey For England - PANS001 (naturalengland.org.uk).
(4) ‘Don’t know’ responses are not included in this chart.
The proportion of adults who reported that that they stayed at home to stop coronavirus spreading/Government restrictions as the main reason they did not spend time in green and natural spaces was highest in April 2020 (76%) and lowest in February 2022 (10%).
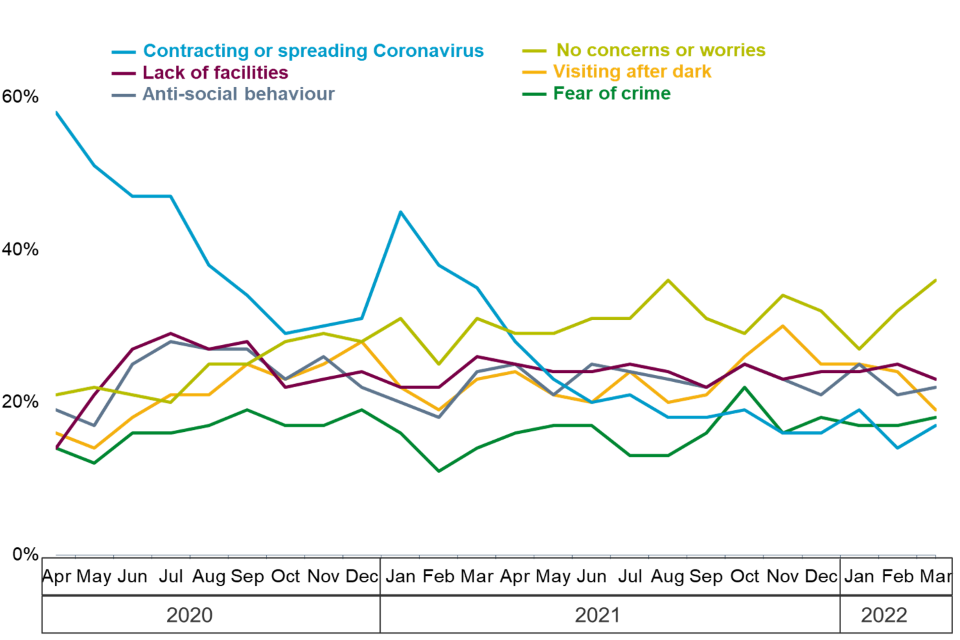
When asked about general concerns about visiting green and natural spaces (rather than specific reasons for not visiting), the decrease in contracting or spreading coronavirus is also noticeable (Chart 3-3).
Chart 3-3 Concerns or worries about visiting green and natural spaces for people that had not visited green and natural spaces in the previous 14 days. Data from April 2020 to March 2022.
Trends in reasons for not making visits April 2020 to March 2022
Chart notes
Source:
Q29 / M2B_Q4A Thinking about visiting green and natural spaces, are you concerned or worried by any of the following? Fear of crime, visiting after dark, Anti-social behaviour, Lack of facilities, Contracting or spreading coronavirus, No worries, or concerns
(1) Data collected between April 2020 and March 2022.
(2) The samples for this question were: 958 (April 2020), 754 (May 2020), 647 (June 2020), 605 (July 2020), 569 (August 2020), 567 (September 2020), 676 (October 2020), 687 (November 2020), 729 (December 2020), 715 (January 2021), 696 (February 2021), 694 (March 2021), 597 (April 2021), 667 (May 2021), 650 (June 2021), 638 (July 2021), 593 (August 2021), 621 (September 2021), 659 (October 2021), 705 (November 2021), 783 (December 2021), 718 (January 2022), 714 (February 2022), 699 (March 2022).
(3) Only a subset of reasons have been presented – for more information on the questionnaire please visit The People and Nature Survey For England - PANS001 (naturalengland.org.uk).
(4) ‘Don’t know’ responses are not included in this chart.
The proportion of adults with concerns or worries about contracting or spreading coronavirus when visiting green and natural spaces fell between January 2021 and March 2022. The proportion of adults with no concerns or worries about visiting green and natural spaces was highest in August 2021 and March 2022 (36%) and lowest in July 2020 (20%).
Contracting or spreading coronavirus as a general concern when visiting green and natural spaces was selected by 19% of people who had not visited green and natural spaces in the last 14 days between April 2021 and March 2022 (Year 2). This was a decrease from 41% between April 2020 and March 2021 (Year 1).
Between April 2021 and March 2022 (Year 2), around a third (31%) of people who had not visited green and natural spaces reported having no general concerns or worries. This was an increase from 25% between April 2020 and March 2021 (Year 1).
For those people who did have concerns, the most common concern among people who had not visited green and natural spaces in the previous 14 days were a lack of facilities such as toilets, benches, and baby changing (24%). Visiting after dark (23%) and anti-social behaviour (23%) were the next most common concerns.
4. Importance of nature for people’s wellbeing
Since coronavirus restrictions have been lifted, people have continued to find nature/wildlife and visiting green and natural spaces to be important to their wellbeing:
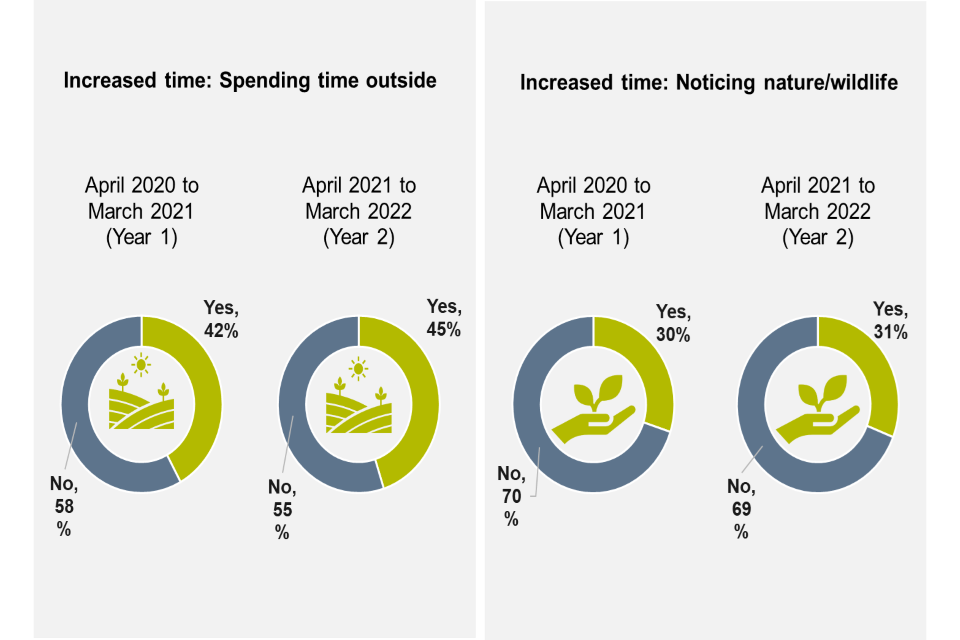
- Four in ten adults reported that they had increased their time spent outside (42% between April 2020 and March 2021 and 45% between April 2021 and March 2022). Three in ten agreed that they had increased the amount of time they spent noticing nature and wildlife since the start of the pandemic (30% between April 2020 and March 2021 and 31% between April 2021 and March 2022).
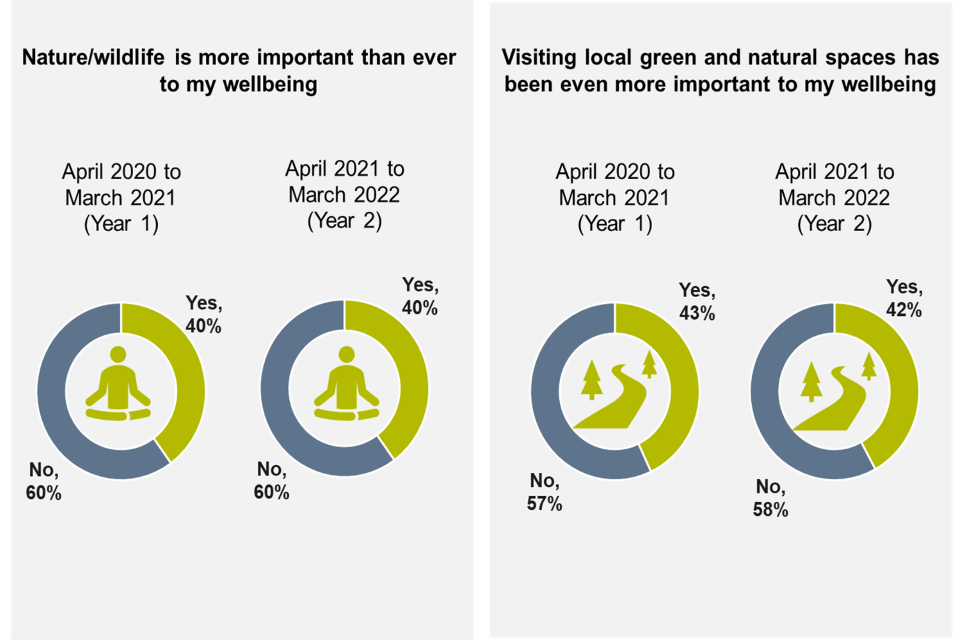
- Four in ten adults reported that nature/wildlife (40% between April 2020 and March 2021 and 40% between April 2021 and March 2022 and ) and visiting green and natural spaces (42% between April 2020 and March 2021 and 43% between April 2021 and March 2022) had been more important to their well-being during the pandemic.
Chart 4-1 Whether people have increased time spent outside and time spent noticing nature/wildlife between April 2020 and March 2021 (Year 1) and April 2021 and March 2022 (Year 2). The proportion of adults who have increased their time outside and noticing nature/wildlife has remained consistent across Year 1 and Year 2.
Trends in percentages of adults spending increased time: outside; and noticing nature/wildlife April 2020 to March 2022
Chart notes
Please note there was a change in question wording in year 2 to reflect changes in government coronavirus guidance.
Source:
QCV2a (Year 1) Since the coronavirus restrictions began, have you increased the amount of time spent on any of the following? Spending time outside, Noticing nature / wildlife
QCV2a (Year 2) Since the coronavirus restrictions have been lifted, have you increased the amount of time spent on any of the following? Spending time outside, Noticing nature / wildlife
(1) Data collected between May 2020 and March 2022.
(2) The samples for this question were 22,911 (May 2020 – March 2021), 24,987 (April 2021 – March 2022).
(3) ‘Don’t know’ responses are not included in this chart.
Chart 4-2 Whether nature/wildlife and visiting green spaces have become more important to people’s wellbeing between April 2020 and March 2021 (Year 1) and (April 2021 and March 2022 (Year 2). The same proportion of adults reported that nature/wildlife and visiting local green and natural spaces had become more important to their wellbeing in Year 1 and Year 2.
Trends in percentages of adults feeling that nature/wildlife and visiting local green and natural spaces is extremely important to their wellbeing April 2020 to March 2022
Chart notes
Please note there was a change in question wording in year 2 to reflect changes in government coronavirus guidance.
Source:
CV_Q1 (Year 1) Thinking about life since coronavirus restrictions began, have you noticed or done any of the following?
CV_Q1 (Year 2) Thinking about life now, have you noticed or done any of the following?
(1) Data collected between May 2020 and March 2022.
(2) The samples for this question were 22,911 (May 2020 – March 2021), 24,987 (April 2021 – March 2022).
(3) ‘Don’t know’ responses are not included in this chart.
Charts 4-1 and 4-2 show only slight changes, and in the case of importance to wellbeing, no changes, to the percentages of people who said yes to increasing time and importance to wellbeing questions when comparing April 2020-March 2021 (Year 1) to April 2021 – March 2022 (Year 2).
5. Most people spend time in gardens and urban/local green spaces
Gardens and urban/local green spaces were particularly important for spending time outdoors:
- Between April 2021 and March 2022 (Year 2), 76% of people with access to a garden said they spent time in it at least once a week. This was a slight decrease compared to 79% between April 2020 and March 2021 (Year 1). One in three (32%) with access to a garden said they did this for their mental health and well-being between April 2021 and March 2022 (Year 2), similar to Year 1 (34% between April 2020 and March 2021).
- Across Year 1 and Year 2 of the survey, 8% of people reported that they did not have access to a garden.
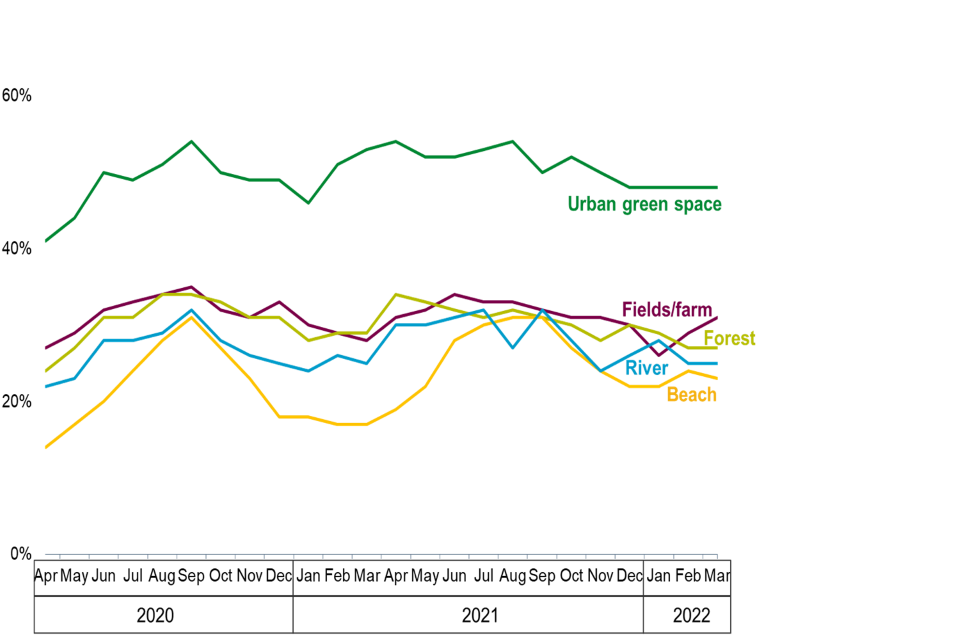
- Visit destinations outside of gardens are shown in Chart 5-1.
Chart 5-1 The types of green and natural spaces people have spent time in the last month. April 2020 to March 2022.
Types of places visited April 2020 to March 2022
Chart notes
Source:
M1_Q2 Which of the following type(s) of green and natural spaces have you visited during the last month? [Select all that apply] Urban green space (such as a park, field, or playground), Fields / farms / countryside, Woodland or forest, River, lake or canal, Beach / other coastline / sea
(1) Data collected between April 2020 and March 2022.
(2) The samples for this question were 2017 (April 2020), 2015 (May 2020), 2001 (June 2020), 2024 (July 2020), 2009 (August 2020), 2021 (September 2020), 2021 (October 2020), 2022 (November 2020), 1994 (December 2020), 1972 (January 2021), 1957 (February 2021), 1964 (March 2021), 1970 (April 2021), 1971 (May 2021), 1955 (June 2021), 1938 (July 2021), 1990 (August 2021), 1991 (September 2021), 1994 (October 2021), 1980 (November 2021), 1959 (December 2021), 2000 (January 2022), 1991 (February 2022), 1971 (March 2022).
(3) Only a subset of reasons have been presented – for more information on the questionnaire please visit The People and Nature Survey For England - PANS001 (naturalengland.org.uk).
(4) ‘Don’t know’ responses are not included in this chart.
Between April 2021 and March 2022 (Year 2), urban green spaces (such as a park, field, or playground) were the most commonly visited green and natural spaces (by 51% of respondents). This was a small increase from a total of 49% between April 2020 and March 2021 (Year 1). Chart 5-1 shows that urban green spaces are the most reported destination type over the two years of data collection. It also shows there are seasonal spikes observed in beach/coastal visits during summer and early autumn.
6. Perceived quality of local green spaces
More people thought the quality of local green and natural spaces had improved rather than reduced:
- Four in ten thought that the quality of green and natural spaces close to where they live had improved in the last 5 years (40% between April 2020 and March 2021 and 41% between April 2021 and March 2022), whereas 20% thought they had reduced in quality (same for both years).
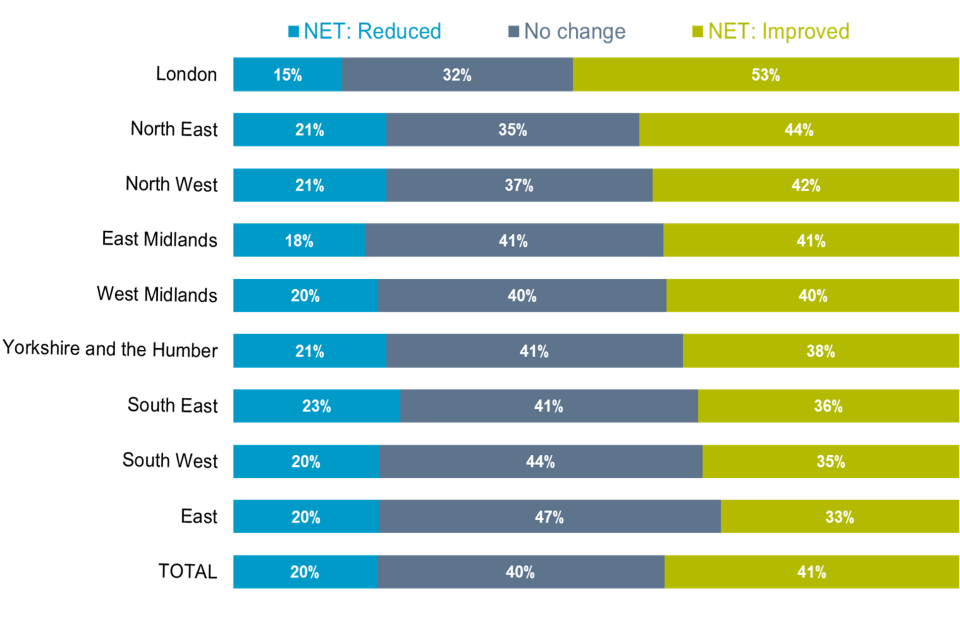
- In Chart 6-1, it can be seen that there are regional differences in reporting improvements or reductions to local green and natural spaces between April 2021 and March 2022 (Year 2).
Chart 6-1 Whether the quality of green and natural spaces close to where they live had improved in the last 5 years by region. April 2021 to March 2022 (Year 2).
Trends in percentages of visits made by region
Chart notes
Source:
Q3 / M1_Q3 Thinking of the green and natural spaces close to where you live, have they improved or reduced in the last 5 years, or have they not changed?
(1) Data collected between April 2021 and March 2022.
(2) The samples for this question were 3837 (London), 1260 (North East), 3131 (North West), 2394 (East Midlands), 2740 (West Midlands), 2340 (Yorkshire and the Humber), 3947 (South East), 2317 (South West).
(3) ‘Don’t know’ responses are not included in this chart.
</sub>
People in London were more likely to agree that the quality of green and natural spaces where they live had improved over the last 5 years (52%). People in the East of England were least likely to agree that green and natural spaces where they lived had improved (33%).
7. Physical and mental health benefits
The majority of respondents agreed that spending time outdoors is beneficial for their physical and mental health:
- 94% of adults who had visited a green and natural space in the previous 14 days agreed that spending time outdoors was good for their physical health and 92% agreed it was also good for their mental health. The same percentage agreed with both these statements between April 2021 and March 2022 (Year 1) and April 2020 and March 2021 (Year 2).
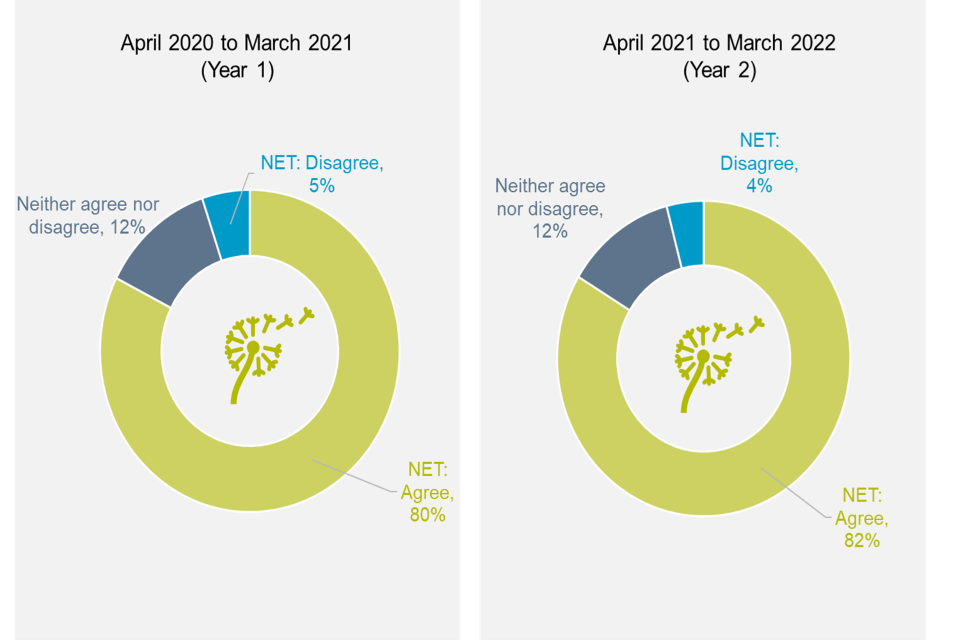
- Chart 7-1 shows that 82% of adults agreed that being in nature made them very happy between April 2021 and March 2022 (Year 2). As can be seen in chart 7-1, there is little change in how people answered ‘being in nature makes me very happy’ over the time of the two survey years.
- A similar proportion agreed they find being in being nature really amazing (82% in both Year 1 and Year 2).
- Between April 2021 and March 2022 (Year 2), six in ten (59%) adults agreed that they felt part of nature (this was 58% in the previous year between April 2020 and March 2021).
Chart 7-1 Percentage who agree / disagree with the statement ‘Being in nature makes me very happy’ between April 2020 and March 2021 (Year 1) and April 2021 and March 2022 (Year 2).
Percentage of people agreeing that visits to green and natural spaces are important April 2020 to March 2022
Chart notes
Source:
M1_Q6 How much do you agree with the following: Being in nature makes me very happy
(1) Data collected between April 2020 and March 2022.
(2) Responses taken from NET reduced and NET improved values.
(3) ‘Don’t know’ responses are not included in this chart.
(4) The samples for this question were 23,314 (April 2020 – March 2021), 24,987 (April 2021 – March 2022).
8. Protecting the environment
Recycling was the most common action taken by people to protect the environment:
- Adults undertook a range of household, gardening, and broader lifestyle behaviours that are positive for the environment. Between April 2021 and March 2022 (Year 2) 85% said they were going to make changes to their lifestyle to protect the environment.
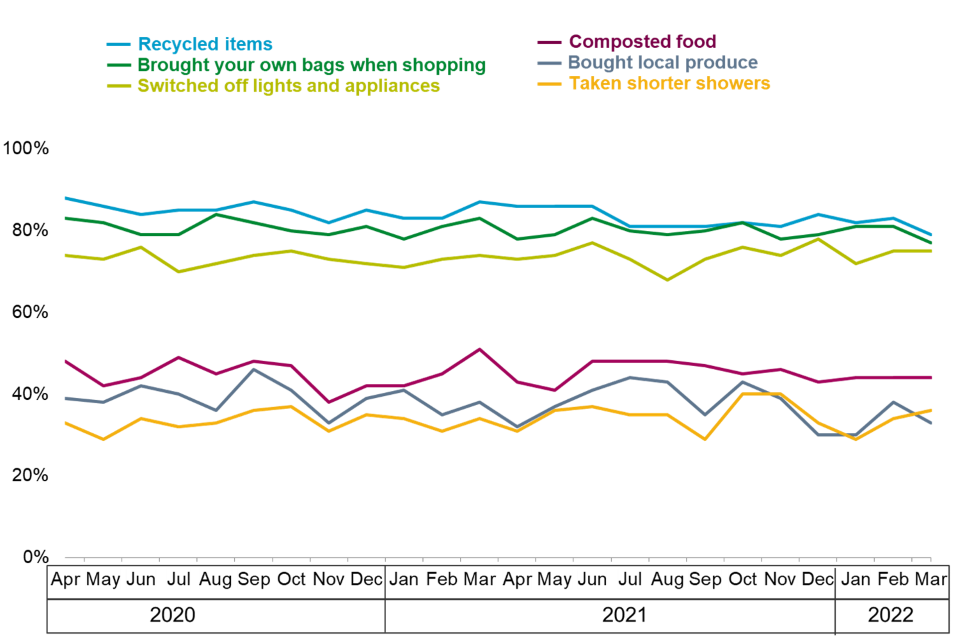
- Respondents were asked what they had done to protect the environment over the last month. Chart 8-1 shows monthly responses between April 2020 and March 2022.
- Over eight in ten (85% in Year 1, 83% in Year 2) reported that they had recycled items whilst a similar proportion reported they had brought their own bags when shopping (81% in Year 1, 80% in Year 2). Switching off lights and appliances (73% in Year 1, 74% in Year 2) was the next most commonly reported action followed by composting food waste (45% in Years 1 and 2).
Chart 8-1 Actions taken to protect the environment in the last month. April 2020 to March 2022.
Trends in things undertaken to: reduce waste, lower the costs of energy consumption and increase sustainability April 2020 to March 2022
Chart notes
Source:
M4_Q11 Thinking about the last month, which of the following have you done?
(1) Data collected between April 2020 and March 2022.
(2) The samples for this question were 403 (April 2020), 364 (May 2020), 414 (June 2020), 387 (July 2020), 420 (August 2020), 425 (September 2020), 421 (October 2020), 411 (November 2020), 435 (December 2020), 421 (January 2021), 432 (February 2021), 397 (March 2021), 408 (April 2021), 411 (May 2021), 403 (June 2021), 455 (July 2021), 423 (August 2021), 397 (September 2021), 436 (October 2021), 378 (November), 429 (December 2021), 404 (January 2022), 443 (February 2022), 437 (March 2022).
(3) Only a subset of reasons have been presented – for more information on the questionnaire please visit The People and Nature Survey For England - PANS001 (naturalengland.org.uk).
(4) ‘Don’t know’ responses are not included in this chart.
As chart 8-1 shows, there is a stratification of two groups of behaviours (recycling items, bringing own bags when shopping, and switching off lights and appliances are grouped relatively closely, as are composting food waste, buying local produce and taking shorter showers) which stayed mostly the same over time of data collection. The actual responses to the specific behaviours within these two groups changes a little over time.
Most people said that protecting the environment was important to them:
- Over eight in ten people (86%) said that protecting the environment was important to them in Year 1 and in Year 2.
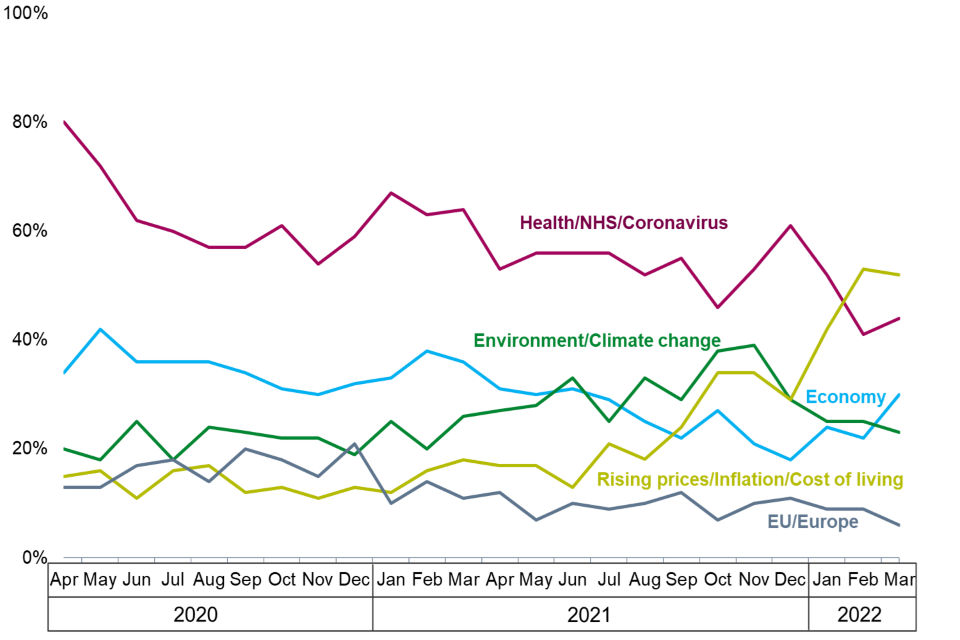
- The answer to the question above can be put into greater context when considering another question that asked people to select up to three issues facing the UK: Between April 2021 and March 2022 (Year 2), ‘The environment/climate change’ was the third most commonly selected issue facing the UK (chosen by 29% of people), after ‘Health/ the NHS/ Coronavirus’ (52%) and ‘the rising cost of living’ (30%).
Chart 8-2 What people think are the most important issues facing the UK. Data from April 2020 to March 2022.
Trends in things that are concerning people April 2020 to March 2022
Chart notes
Source:
M4_Q11 Thinking about the last month, which of the following have you done?
(1) Data collected between April 2020 and March 2022.
(2) The samples for this question were 403 (April 2020), 364 (May 2020), 414 (June 2020), 387 (July 2020), 420 (August 2020), 425 (September 2020), 421 (October 2020), 411 (November 2020), 435 (December 2020), 421 (January 2021), 432 (February 2021), 397 (March 2021), 408 (April 2021), 411 (May 2021), 403 (June 2021), 455 (July 2021), 423 (August 2021), 397 (September 2021), 436 (October 2021), 378 (November), 429 (December 2021), 404 (January 2022), 443 (February 2022), 437 (March 2022).
(3) Only a subset of reasons have been presented – for more information on the questionnaire please visit The People and Nature Survey For England - PANS001 (naturalengland.org.uk).
(4) ‘Don’t know’ responses are not included in this chart.
As can be seen in Chart 8-2, when selecting the three most important issues facing the UK, the environment moved from third most selected issue for most of April 2020 to March 2021 (Year 1), to second most selected issue for most of summer, autumn, and winter 2021 (middle of Year 2). In March 2022, the environment was the fourth most commonly selected issue, overtaken by the economy (3rd), health/NHS/coronavirus (2nd), and rising prices/inflation/cost of living (1st).
9. Further information about using PANS data
Further information on the People and Nature Survey is available on Gov.uk. New data is published on a quarterly basis.
In addition to the published reports and data releases, Natural England has developed a data viewer that already weights the data and provides breakdowns for many of the questions in the survey.
If you have a specific research question that cannot be explored on the data viewer, a copy of the dataset can be downloaded from Gov.uk. If you wish to analyse the data yourself, make sure to weight the data appropriately following the People and Nature Survey weighting guide. Natural England has published a technical report providing full methodological background to the research, including how the data was collected and how the questions, sample and weights were developed.
If you utilise the dataset for your own analysis or use figures or charts from the report or the data viewer, please use the following citation: Natural England, 2022, People and Nature Survey Dataset from April 2020 – March 2022.
If you have any questions that aren’t answered by the published materials, please contact the People and Nature Survey project team.
Here are further details on what kinds of questions/topics are being asked in the modules that have not been focused upon in this report:
General experiences of green and natural spaces:
- Frequency of time spent outside in past 12 months
- Places visited
- General/local greenspace standards
- Nature connection
Visits taken to green and natural spaces in last 14 days:
- Total number of visits
- Main visit in past 14 days: destination/s, start place, distance, duration, activities, benefits of visit, transport, who with, physical exertion, money spent, reason for visit, quality of place/s visited
- Reasons for not visiting/barriers
Children (asking parent/guardian):
- Frequency of time spent outside in past 12 months
- Places visited
- Visit partners
- Benefits of time outdoors
- Reasons for not spending more time outdoors
- Time spent in private garden
Environmental attitudes:
- Importance of protecting the environment
- Reasons to look after the environment
- Concern about damaging natural environment
- Perceived variety of animal / plant life
- Concern about loss of variety
- Environmental issues that are of concern
- Environmental social action
- Environmental lifestyle choices
- Eating meat
- Driving
- Aeroplane use
- Energy use
- Water waste
- The number of things bought
- Responsibility for environmental damage
Gardens:
- Frequency of time spent in gardens
- Importance of gardens
- Reasons for spending time in garden
- Benefits of time in garden
- Description of garden
- Wildlife friendly gardening behaviours