The People and Nature Survey for England: Data and publications from Adults survey year 1 (April 2020 - March 2021) (Official Statistics) main findings
Updated 5 April 2023
Applies to England

© Crown copyright 2023
This publication is licensed under the terms of the Open Government Licence v3.0 except where otherwise stated. To view this licence, visit nationalarchives.gov.uk/doc/open-government-licence/version/3 or write to the Information Policy Team, The National Archives, Kew, London TW9 4DU, or email: psi@nationalarchives.gov.uk.
Where we have identified any third party copyright information you will need to obtain permission from the copyright holders concerned.
This publication is available at https://www.gov.uk/government/statistics/the-people-and-nature-survey-for-england-data-and-publications-from-adults-survey-year-1-april-2020-march-2021-official-statistics/the-people-and-nature-survey-for-england-data-and-publications-from-adults-survey-year-1-april-2020-march-2021-official-statistics-main-finding
1. Main findings
The People and Nature Survey (PANS) collected responses from a representative sample of 24,994 adults across England between April 2nd 2020 and March 31st 2021, providing key information on how people experience and think about the environment. Findings from this data include:
More than six in ten people had visited green and natural spaces in the last 14 days:
- 62% of adults visited a green and natural space in the last 14 days.
- The average number of visits to green and natural space in the last 14 days was 4.
- 29% of adults had not visited green and natural spaces in the last 14 days.
Pandemic restrictions affected people’s time spent outdoors:
- Across the year, staying at home to stop coronavirus spreading and due to Government restrictions was the most commonly reported reason for not spending free time outdoors in the last 14 days (by 48% of people), over and above several other common reasons for not getting outdoors (e.g. bad/poor weather and poor health/illness at 31% and 14% respectively).
- 41% of people who had not visited green and natural spaces in the last 14 days cited ‘contracting or spreading coronavirus’ as one of their concerns. This option was more often chosen than any other concern/worry (e.g. lack of facilities and antisocial behaviour) across the year.
Many people found solace in nature during the pandemic:
- Just over 4 in 10 (42%) people agreed that they had increased their time spent outside, and nearly a third (30%) agreed that they had increased the amount of time they spent noticing nature and wildlife since the start of coronavirus restrictions.
- People reported that both nature/wildlife (40%) and visiting green and natural spaces (43%) had been more important to their well-being during the pandemic.
Gardens and urban/local green spaces were important for spending time outdoors:
- Of those with access to a garden or allotment space (8% had no access), 79% of people said they spent time in it at least once a week and 34% said they did this for their health and well-being.
- Over the course of the year, urban green spaces (such as a park, field, or playground) were the most commonly visited green and natural spaces in the last month (by 49% of respondents).
More people thought the quality of local green and natural spaces had improved rather than reduced:
- 4 in 10 (40%) of people thought that the quality of green and natural spaces close to where they live had improved in the last 5 years, whereas 2 in 10 (20%) thought they had reduced in quality.
- Adults from households with higher income (>£50k) were more likely to say that quality of green and natural spaces had improved over the last 5 years (45%) than those with a lower income (e.g. 31% of those with a household income <£15k.
Almost everyone agreed that spending time outdoors is beneficial for their physical and mental health:
- 94% of adults felt that spending time outdoors was good for their physical health, and 92% thought it was also good for their mental health.
- 82% of adults reported that being in nature made them very happy, indicating high levels of nature connection among respondents.
Most people said that protecting the environment was important to them:
- ‘The environment/climate change’ was given by respondents as the third most important issue facing the UK (chosen by 22% of people), after ‘the coronavirus pandemic’ (63%) and ‘the economy’ (35%).
- Over 8 in ten people (86%) said that protecting the environment was important to them.
- Less than a third of people said they often or always did any one of the listed social actions for the environment (e.g. 28% voting for political parties with strong environmental policies and 24% signing petitions or participating in campaigns or demonstrations about environmental issues).
- Adults undertook a range of household, gardening, and broader lifestyle behaviours that are positive for the environment and 83% said they were going to make changes to their lifestyle to protect the environment.
- Six in ten (60%) of adults said they eat meat more than twice a week (6% never eating meat), nearly 3 in 10 (27%) adults said they drive to work or a place of study in a car, motorbike or van (45% never do this), and more than 1 in 10 (11%) of adults took a flight at least once every 2 to 3 months (71% doing this once a year or less and of these 21% never flying).
Access, engagement, and connection to nature are not equal across groups:
- Having a lower household income, fewer qualifications, living in a more deprived area and being in bad health (and in some instances being unemployed) were all associated with greater risk of low engagement with and access to nature and the outdoors. This included fewer visits to green and natural spaces in the last 14 days, seeing coronavirus as a barrier to getting outdoors, reduced access to garden space or an allotment, and lower likelihood of reporting that ‘being in nature makes me happy’.
- Differences in the way groups access, engage with, and connect to nature were also found based on age, gender, region, ethnicity, illness and whether children were in the household or not.
2. Other pages in this release
The People and Nature Survey for England, led by Natural England, is one of the main sources of data and statistics on how people experience and think about the environment. It began collecting data via an online panel (adults aged 16 years and older) in April 2020, and runs continuously, in line with Government Statistical Service guidance on data collection during the COVID-19 pandemic.
The Official Statistics in this publication are based on a survey of 24,994 adult respondents conducted online continuously between April 2nd 2020 and March 31st 2021 (inclusive). Throughout this bulletin, “the year” refers to this period.
Alongside this publication, a spreadsheet containing relevant data tables for Year 1 of the survey has been published and monthly data from Year 1 of the survey can also be viewed. Data tables have been generated using the specific People and Nature Survey weight. See Methods and Limitations for more details.
Further information about the People and Nature Survey for England (including information on methods, strengths and limitations, and Official Statistics status) is available. To receive updates on the survey, including data releases and publications, sign-up via the People and Nature User Hub.
Results from this survey for April 2020 - March 2021 were collected during social contact restrictions and legal restrictions on meeting others outdoors in England. This page summarises the latest advice on accessing green spaces safely.
3. Official Statistics
Releases from the People and Nature Survey that use the specific weighting method (as opposed to the interim weighting method) are designated as Official Statistics. For justifications behind this designation, please see our brief statement. Natural England have developed the methodologies used in the production of these statistics whilst ensuring adherence to the Code of Practice for Statistics.
4. Group differences in engagement with nature
For each of the questions asked in this survey, responses given were compared between different groups to highlight any variation across the population in the way people engage with nature based on: age, gender, ethnicity, region, income, educational attainment, number of children in the household, working status, health, long-term illness and the relative level of deprivation in the area they live (see section 11 Methodological note). Tables 2, and 4 to 7 summarise these findings for 6 key questions.
Table 1- Demographic variables used to look at differences in the way people engage with nature between April 2020 and March 2021
| Breakdown | Groupings |
|---|---|
| Age (in years) | 16-24 25-29 40-54 55-64 65+ |
| Gender [footnote 1] | Male Female |
| Ethnicity [footnote 2] | White (including White minorities) Mixed or Multiple ethnicities Asian/Asian British Black/Black British Any other ethnic background |
| Region | North East (NE) North West (NW) Yorkshire and the Humber (Y&H) East Midlands (EM) West Midlands (WM) East (E) London South East (SE) South West (SW) |
| Income (total annual household income before tax) | <£15,000 £15,000 to £29,999 £30,000 to £49,999 £50,000 to £79,999 ≥£80,000 |
| Education (highest level of qualification) | A university degree or above Any other qualifications No qualifications |
| Children in household (how many children aged under 16 currently live in the household) | No children in the household 1 child ≥ 2 children |
| Working status | In employment Self-employed Unemployed Not working (retired, looking after house/children/other caring responsibilities, long-term sick or disabled) Student |
| Health | Very good/good Fair Bad/very bad |
| Long-term illness [footnote 3] | No illness Any illness Illness- impacts a lot Illness- impacts a little Illness- no impact |
| Area deprivation [footnote 4] | 30% most deprived (‘most deprived’) 70% least deprived (‘least deprived’) |
5. Time spent in green and natural spaces
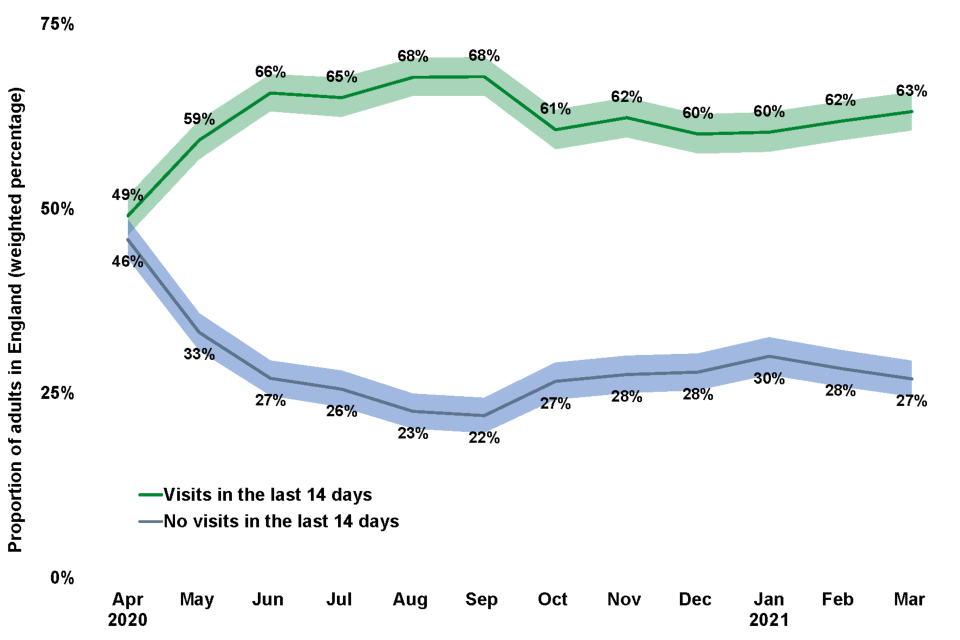
From April 2020 to March 2021, just over six in ten adults (62%) had visited a green and natural space at least once in the last 14 days. On average people had visited green and natural spaces 4 times in the past 14 days (not including 10% who answered ‘don’t know/prefer not to say’). Across the year, 29% of people reported no visits at all to green and natural spaces in the last 14 days.
There was variation between months, with the proportion of adults that had taken a visit in the last 14 days highest between June and September 2020, and lowest in April (49%) 2020 (Figure 1).
Figure 1: Proportion of adults in England (weighted percentage) visiting a green and natural space in the last 14 days. The highest proportion was recorded between June and September 2020 (68%) and lowest in April 2020 (49%).
Proportion of adults in England visits and no visits in the last 14 days
Figure notes
Source:
Q6 / No_Of_Visits: How many times, if at all, did you make this type of visit to green and natural spaces in the last 14 days?
(1) Data collected between April 2nd 2020 and March 31st 2021 (inclusive).
(2) The samples for this question were 1,868 (April), 1,898 (May), 1,872 (June), 1,889 (July), 1,856 (August), 1,866 (September), 1,854 (October), 1,869 (November), 1,863 (December), 1,860 (January), 1,868 (February) and 1,900 (March) respondents.
(3) See Glossary for 95% confidence interval of the mean.
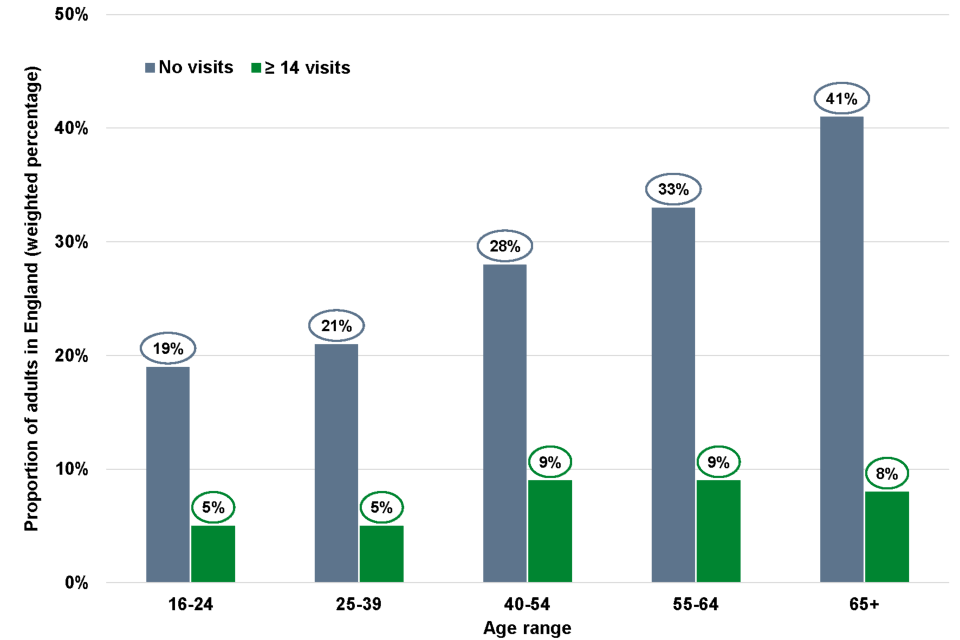
People aged 40+ were more likely than people under the age of 40 to have visited green and natural spaces every or almost every day in last 14 days. However, a higher proportion of people aged 40+ than people under the age of 40 had also made no visits at all in the last 14 days (Figure 2).
Figure 2: Proportion of adults in England (weighted percentage) grouped by age range who had visited a green and natural space at least 14 times in the last 14 days versus those who had not taken a visit in the last 14 days. As age increases, so does the proportion of those reporting no visits to a green and natural space in the last 14 days. However, people aged 40+ were more likely than those under 40 to have visited green and natural spaces at least 14 times in the last 14 days.
Proportion of adults in England no visits and more than 14 visits by age range
Figure notes
Source:
Q6 / No_Of_Visits: How many times, if at all, did you make this type of visit to green and natural spaces in the last 14 days?
Q62 (S_Q2): What was your age last birthday?
Q62 (S_Q2_bands): In that case, which of these age groups do you fall into.
(1) Data collected between April 2nd 2020 and March 31st 2021 (inclusive).
(2) The samples for this question were 2,906 (16-24), 5,567 (25-39), 5,575 (40-54), 3,354 (55-64) and 5,061 (65+) respondents.
Table 2: Adults ‘who had not visited green and natural spaces at all in the last 14 days’ by demographic group (statistically significant differences within groups marked with ‘X’), from April 2020 to March 2021. Those who had not visited green and natural spaces at all in the last 14 days were more likely to be aged 40+, women, live outside of London and the SE, have a lower household income, have no qualifications, have no children in the household, be unemployed or not working, in bad health, with no long-term illness at all or a long-term illness that has greater impact, or live in the most deprived areas.
| Variable | Sig. | Finding |
|---|---|---|
| Age | X | More likely as age increases (e.g. 16-24 at 19% compared to 65+ at 41%) |
| Gender | X | More likely for women (32%) than men (25%) |
| Ethnicity | ||
| Region | X | Less likely in London (25%) than all other regions except the NE (27%), and less likely in the SE (27%) than the NW (32%), Y&H (30%), WM (30%) and E (31%) |
| Income | X | More likely as income decreases (e.g. 18% of those with a household income >£80k compared to 42% of those with a household income <£15k) |
| Education | X | More likely for those with no qualification (55%) than university degree (20%) and other qualification (31%) |
| Children in household | X | More likely for those with no children in their household (32%) than one child (22%) and ≥2 children (19%) |
| Working status | X | More likely for those not in work (42%/33% for those not working/unemployed) compared to those employed (22%/24% for those in employment/self-employed) |
| Health | X | More likely for those in very bad/bad health (55%) compared to those in fair (38%) or very good/good (22%) health |
| Long-term illness | X | More likely for those with no illness (36%) than those with any illness (24%). For those with an illness, more likely as the impact of illness increases (e.g. 26% of those who say it has ‘no impact’ compared to 41% of those who say it ‘impacts a lot’) |
| Area deprivation | X | More likely for those in the most deprived (32%) compared to least deprived areas (28%) |
6. Experiences of nature and the pandemic
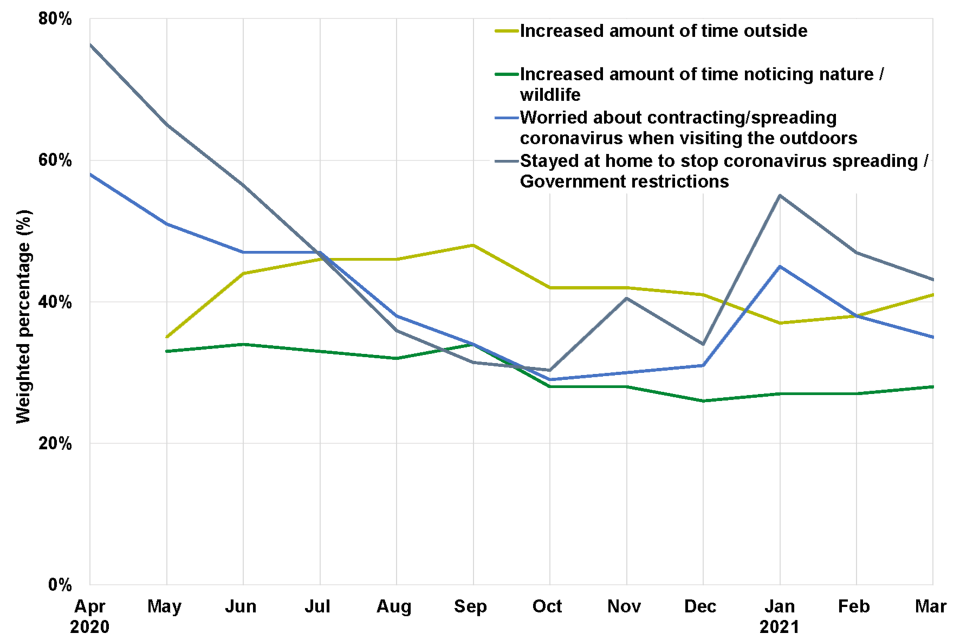
Survey respondents were asked to reflect on their experiences since the coronavirus restrictions began. Overall, around 4 in ten (42%) adults said that they had increased the time they spent outside since coronavirus restrictions began. However, this varied depending on the month, with fewer people saying they had increased the time they spent outside since coronavirus restrictions began when asked in May 2020 (35%), and January (37%) and February 2021 (38%).
Overall, nearly a third of adults (30%) also said that they had increased the amount of time they spent noticing nature and wildlife since coronavirus restrictions began. Again, this showed variation depending on the month they were asked. People were more likely to say they had increased the amount of time they spent noticing nature and wildlife since coronavirus restrictions between May and September 2020 (ranging from 32% to 34%), than between October and March 2021 (ranging from 27% to 28%) (Figure 3).
Four in ten (40%) of people agreed that nature and wildlife was more important than ever to their well-being and a similar amount (43%) felt that visiting local green and natural spaces had been more important to their well-being since the coronavirus restrictions began.
Figure 3: Proportion of adults in England (weighted percentage) and their experience of nature during the pandemic, by month.
Reasons for visits and reasons for not visiting
Figure notes
Source:
CV_Q2A Since the coronavirus restrictions began, have you increased the amount of time spent on any of the following?
Spending time outside
Noticing nature / wildlife
M2B_Q4A Thinking about visiting green and natural spaces, are you concerned or worried by
Contracting or spreading coronavirus
M2B_Q2 What was the main reason for not spending free time outdoors in the last 14 days?
Stayed at home to stop coronavirus spreading / Government restrictions
(1) Data collected between April 2nd 2020 and March 31st 2021 (inclusive).
(2) The samples for this question were:
CV_Q2A
0 (April), 2,083 (May), 2,083 (June), 2,087 (July), 2,079 (August), 2,082 (September), 2,082 (October), 2,083 (November), 2,083 (December), 2,080 (January), 2,072 (February) and 2,097 (March) respondents.
M2B_Q4A and M2B_Q2
958 (April), 754 (May), 647 (June), 605 (July), 569 (August), 567 (September), 676 (October), 687 (November), 729 (December), 715 (January), 696 (February) and 694 (March) respondents.
(3) Only a subset of reasons have been presented - see the other results for all reasons.
Although some people reported more time outside and greater engagement with nature since the start of the pandemic, widespread concern about accessing the outdoors due to the pandemic was also evident. Overall, 41% of adults who had not visited green and natural spaces in the last 14 days cited ‘contracting or spreading coronavirus’ as one of their concerns. This option was more often chosen than any other concern/worry (e.g. lack of facilities and antisocial behaviour) across the year.
Staying at home to stop coronavirus spreading and government restrictions were together cited as a main reason for not spending free time outdoors by 48% of adults who had not visited a green or natural space in the last 14 days (Table 3). These adults were most likely to report staying at home to stop coronavirus spreading and government restrictions as a reason for not getting outdoors in April 2020 (76%). This percentage steadily decreased over the course of 2020, reaching its lowest in October (30%) and December 2020 (34%) but showing a slight increase in November (40%), and maintaining higher levels between January (55%) and March 2021 (43%).
Table 3: Main reasons reported for not spending free time outdoors in the last 14 days by adults who had not visited a green or natural space in the last 14 days, from April 2020 to March 2021. The three top reasons for not spending time outdoors were ‘Staying at home to stop coronavirus spreading/government restrictions’, ‘Bad/poor weather’, and ‘Poor physical health (or illness)’.
| Barrier | Weighted percentage |
|---|---|
| Stayed at home to stop coronavirus spreading / Government restrictions | 48% |
| Bad / poor weather | 31% |
| Poor physical health (or illness) | 14% |
| Too busy at home | 12% |
| Too busy at work / with family commitments | 11% |
| Nowhere near me is nice enough to spend my free time in | 9% |
| Poor mental health or well being | 8% |
| Not interested | 7% |
| No particular reason | 6% |
| Prefer to do other leisure activities | 5% |
| Fear / worry about crime or anti-social behaviour | 5% |
| Lack of facilities and access points for those with disabilities | 4% |
| Fear / worry about getting hurt or injured | 3% |
| Cost / too expensive | 3% |
Table 4: Adults who reported ‘staying at home to stop coronavirus spreading/government restrictions’ as a reason for not spending free time outdoors by demographic group (statistically significant differences within groups marked with ‘X’), from April 2020 to March 2021. Those who thought coronavirus had been stopped them spending time outside were more likely to be older, women, White, live in the SW, have lower household income, have no or non-degree level qualifications, have no children in their household, not working, in bad health, or without a long-term illness.
| Variable | Sig. | Finding |
|---|---|---|
| Age | X | More likely as age increases (e.g. 16-24 at 19% compared to 65+ at 41%) |
| Gender | X | More likely for women (42%) than men (36%) |
| Ethnicity | X | More likely for White (40%) than ethnic minority groups (36%) |
| Region | X | More likely in the SW (44%) than Y&H (36%), WM (38%) and London (36%) |
| Income | X | More likely as household income decreases (e.g. 30% of those with a household income >£80k compared to 43% of those with a household income <£15k) |
| Education | X | Less likely for those with a university degree (36%), than no qualification (42%) and other qualification (41%) |
| Children in household | X | More likely for those with no children in their household (41%), than one child (37%) and ≥2 children (34%) |
| Working status | X | Less likely for those in employment (32%) and more likely for those not working (51%) than all other groups. |
| Health | X | Less likely for those in very good/good health (37%), compared to fair (43%) or very bad/bad health (47%) |
| Long-term illness | X | More likely for those with no illness (44%) than those with any illness (36%) |
| Area deprivation |
7. Local green and natural spaces
7.1 Gardens
Overall, 76% of people said they had access to a private garden, 9% had access to a shared garden, 10% a private outdoor space that was not a garden, and 3% an allotment at a council or community run site (some with more than one of these).
Just under one in ten (8%) people said they did not have access to any form of garden or other listed outdoor spaces. Those adults without a garden were also more likely to have made no visits to green or natural space (33%) in the last 14 days than those with a private garden (29%).
Of those with access to a garden or one of the other listed outdoor spaces, 79% reported spending time in it at least once a week and of these, 28% used it every day. Overall, 9% said they never used it.
The most common reasons chosen for spending time in the garden were for fresh air (65%), to do gardening and maintenance (42%), for mental health and well-being (34%), to take a break (27%) and to connect to nature and watch wildlife (22%).
Table 5: Adults ‘without access to a garden or other listed outdoor space’ by demographic group (statistically significant differences within groups marked with ‘X’), from April 2020 to March 2021. Those without access to a garden or allotment were more likely to be younger, from an ethnic minority group, live in London, have lower household income, have no qualifications, have no children in their household, be unemployed or a student, have fair/bad/very bad health, or live in the most deprived areas.
| Variable | Sig. | Finding |
|---|---|---|
| Age | X | More likely for younger age groups (e.g. 5% at age 65+ compared to 11% at age 16-24) |
| Gender | ||
| Ethnicity | X | More likely for ethnic minority groups (10%) than White (7%) |
| Region | X | More likely in London (12%) than any other region (all other regions ≤ 8%) |
| Income | X | More likely as household income decreases (e.g. 16% of those with a household income <£15k and 4% of those with a household income >£80k) |
| Education | X | More likely for no qualification (11%) than other qualification (7%) |
| Children in household | X | More likely for those with no children in their household (9%), than one child (6%) and ≥2 children (4%) |
| Working status | X | More likely for those who are unemployed (17%) or students (12%) than all other groups |
| Health | X | Less likely for those in very good/good health (6%), compared to fair (9%) or very bad/bad health (12%) |
| Long-term illness | ||
| Area deprivation | X | More likely for those in the most deprived (12%) than the least deprived areas (6%) |
7.2 Visits to local green and natural spaces
Urban green spaces (such as a park, field, or playground) had been visited by almost half (49%) of respondents, making them the most commonly visited green and natural space in the last month (see Q2-M1_Q2 in the questionnaire for full list of green and natural spaces visited).
For 94% of adults’ most recent visits to green and natural spaces, respondents said their journey to this place started from home (rather than work, holiday accommodation or other locations) and that if they travelled to get there, 70% said they got there by foot/walking rather than using transport.
Table 6: Adults who had ‘visited an urban green space in the past month’ by demographic group (statistically significant differences within groups marked with ‘X’), from April 2020 to March 2021. Those who had visited urban green space in the past month were more likely to be younger, men, from mixed/multiple or Asian/Asian British ethnic background, live in London, have higher household income, have a degree or other qualification, have children in their household, be a student or in employment, have fair/good/very good health, or live in the most deprived areas.
| Variable | Sig. | Finding |
|---|---|---|
| Age | X | More likely for younger age groups (e.g. 40% at age 65+ compared to 53% at age 16-24) |
| Gender | X | More likely for men (50%) than women (48%) |
| Ethnicity | X | More likely for Mixed or multiple ethnic backgrounds (57%) and Asian or Asian British (52%) than White (49%) |
| Region | X | More likely in London (62%) and less likely in SW (40%) than most other regions |
| Income | X | More likely as household income increases (e.g. 43% of those with household income <£15k compared to 55% of those with household income >£80k) |
| Education | X | Less likely for no qualification (33%) than university degree (54%) or other qualification (48%) |
| Children in household | X | Less likely for those with no children in their household (47%), than one child (53%) and ≥2 children (54%) |
| Working status | X | Less likely for those who are not working (41%), and more likely for those who are students (59%) or in employment (52%) |
| Health | X | Less likely for those in very bad/bad (36%), compared to fair (45%) or very good/good health (52%) |
| Long-term illness | ||
| Area deprivation | X | More likely for those in the most deprived (52%) than the least deprived areas (49%) |
7.3 Quality of local green and natural spaces
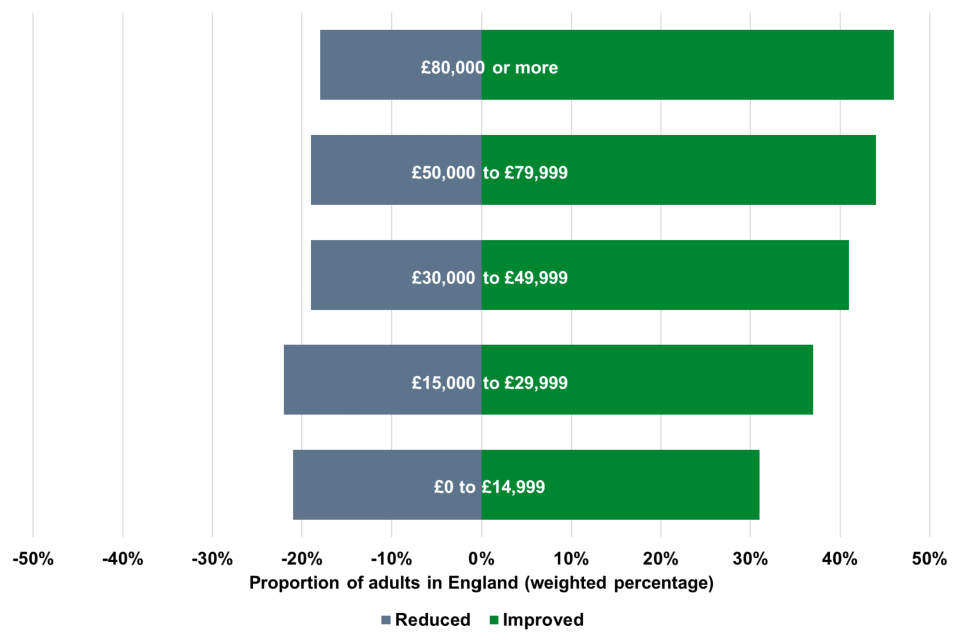
Reflecting on the quality of green and natural spaces close to where they live, 40% of people thought it had improved a little or a lot, whereas 20% thought it had reduced in quality in the last 5 years. This varied depending on income, whereby higher income groups were more likely to say the quality of green and natural spaces close to them had improved in the last 5 years (Figure 4).
Figure 4: Perceived reduction/improvement in the quality of local green spaces in the last five years split by household income. From April 2020 to March 2021, higher income groups were more likely to say the quality of their green and natural spaces close to them had improved in the last 5 years.
Proportion of adults in England reduced visits or improved visits by salary range
Figure notes
Source:
M1_Q3 Thinking of the green and natural spaces close to where you live, have they improved or reduced in the last 5 years, or have they not changed?
Q69 (Income): Which of the following best describes your total annual household income before tax?
(1) Data collected between April 2nd 2020 and March 31st 2021 (inclusive).
(2) The samples for this question were 4,040 (£0 to £14,999), 8,041 (£15,000 to £29,999), 7,137 (£30,000 to £49,999), 3,687 (£50,000 to £79,999), 1,950 (£80,000 or more) respondents.
(3) Responses taken from NET reduced and NET improved values. Reductions in the quality of local green spaces have been expressed as negative values.
(4) Only a subset of reasons have been presented - see the see other results for all reasons.
Looking at specific indicators of quality, around two thirds of people thought that their local green and natural spaces were accessible (within easy walking distance for most people; 65%), that they were good places for mental health and well-being (71%), places to see nature (70%), a high enough standard that people want to spend time there (69%), places that encourage physical health and exercise (69%), good places for children to play (67%), and good places to meet other people (63%).
8. Nature connection and well-being
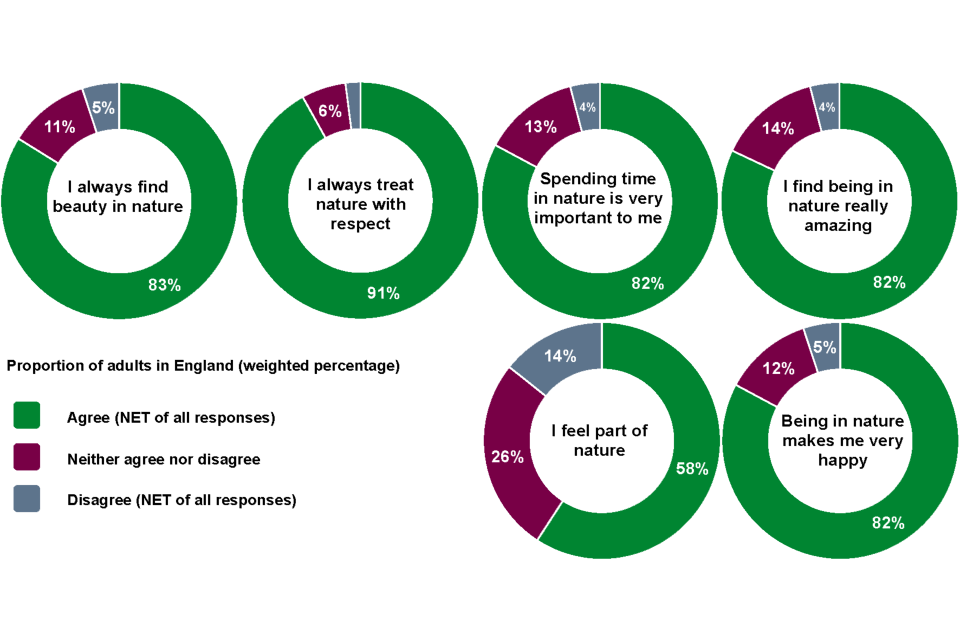
The majority (94%) of adults who had visited green and natural spaces in the last 14 days felt that spending time outdoors was good for their physical health, and 92% thought it was also good for their mental health. Several questions are used as part of the ‘Nature Connection Index’ to indicate whether people experience a connection to nature (Figure 5). As one example, on average 82% of people over the year agreed that being in nature made them very happy. This peaked in April (87%) and May 2020 (85%) and did not go lower than 79% (in December 2020) in agreement throughout the course of the year.
Figure 5: Percentage of people agreeing/disagreeing with Nature Connection Index questions. From April 2020 to March 2021, 91% agreed they always treat nature with respect, 83% agreed they always find beauty in nature, 82% of people agreed that being in nature made them very happy, 82% agreed spending time in nature is very important to them, 82% agreed they find being in nature really amazing and 58% agreed they feel part of nature.
Proportion of adults in England attitudes to nature
Figure notes
Source:
M1_Q6 How much do you agree or disagree with the following:
I feel part of nature.
Being in nature makes me very happy.
I find being in nature really amazing.
M4_Q8 How much do you agree or disagree with the following:
I always find beauty in nature.
I always treat nature with respect.
Spending time in nature is very important to me.
(1) Data collected between April 2nd 2020 and March 31st 2021 (inclusive).
(2) Responses taken from NET reduced and NET improved values.
(3) The samples for this question were 23,314 (M1_Q1) and 4,527 (M4_Q8).
(4) Only a subset of reasons have been presented - see other results for all reasons. Percentages will not add up to 100%.
Table 7: Adults ‘agreeing that being in nature makes them very happy’ by demographic group (statistically significant differences within groups marked with ‘X’), from April 2020 to March 2021. People were more likely to agree that being in nature makes them very happy if they were age 25+, women, not Black or Black British, live in the SE, have higher household income, have a degree or other qualification, are not unemployed or a student, are in good/very good health, have an illness that does not impact them, or are living in a less deprived area.
| Variable | Sig. | Finding |
|---|---|---|
| Age | X | Lower for those aged 16-24 (75%) than all other age groups (all other age groups show ≥81% agreement). |
| Gender | X | More likely for women (85%) than men (80%) |
| Ethnicity | X | Less likely for Black or Black British (72%) than other ethnicities (e.g. most likely for White people at 84%) |
| Region | X | More likely in the SE (84%) than the NW and London (both 81%) |
| Income | X | Less likely as household income decreases (e.g. 83% of those with a household income >£80k compared to 78% of those with a household income <£15k) |
| Education | X | Less likely for those with no qualification (75%) than other qualification (82%) and university degree (84%) |
| Children in household | ||
| Working status | X | Less likely for those who are unemployed (75%) or students (77%) than all other groups |
| Health | X | More likely for those in good/very good health (85%), than fair (79%) or very bad/bad (77%) health |
| Long-term illness | X | For those with an illness, less likely for those who say it ‘impacts a lot’ (78%) than those who say it has ‘no impact’ (84%) |
| Area deprivation | X | Less likely for those in the most deprived (81%) compared to least deprived areas (86%) |
9. Environmental attitudes and actions
9.1 Attitudes
Across the year, health, the NHS and coronavirus were cited by respondents as one of the most important issues facing the UK at the moment (63%), followed by the economy (35%), and then the environment and climate change (22%). Some variation was seen depending on the month people were asked, with health and coronavirus more commonly chosen between April (80%) and May 2020 (72%), the economy more commonly chosen in May 2020 (42%) and fewer people people choosing the environment and climate change around May and July 2020 (both at 18%).
When asked how important protecting the environment was to them personally, adults responded similarly irrespective of the time of year, with an average of more than 8 in ten people (86%) saying that protecting the environment was important or very important to them personally over the course of the year.
9.2 Social action
People reported taking social action to look after the environment in several ways. A third of people (33%) reported often or always picking up litter when they see it. Around a quarter of people said they often or always vote for political parties with strong environmental policies (28%), sign petitions or participate in campaigns or demonstrations about environmental issues (24%) and/or try to persuade others to do more for the environment (23%).
Adults reported other social action for the environment, including donating money to environmental organisations (16%), contacting an MP or council member about an environmental issue (12%), posting online content relating to the environment (12%) and/or volunteering for an environmental cause (10%). All these actions, apart from voting for political parties with strong environmental policies, were more commonly reported by those under the age of 40.
9.3 Lifestyle behaviours
Table 8 shows adults’ reporting on their lifestyle choices and behaviours that could demonstrate care for the environment. However, it should be noted that motivations for these environmentally friendly behaviours was not asked.
Table 8: Individual lifestyle choices and behaviours that were completed by individuals in the last month, from April 2020 to March 2021. The most reported behaviours were recycling items (85%), followed by bringing your own bags when shopping (81%), and switching off lights and appliances to save energy/to protect the environment (73%).
| Action | Weighted percentage |
|---|---|
| Recycled items | 85% |
| Brought your own bags when shopping | 81% |
| Switched off lights and appliances to save energy/ to protect the environment | 73% |
| Composted food waste, or put food waste out for collection | 45% |
| Watched wildlife / nature programmes | 41% |
| Bought produce that is grown locally or in season | 39% |
| Taken shorter showers to save water or energy | 33% |
| Bought second-hand items | 28% |
| Bought products with an environmental label | 22% |
| None of the above | 2% |
The most common actions taken at home to improve water and energy efficiency include, 49% of people saying they have a water meter, 41% using water efficient appliances (e.g. dual flush toilets, water efficient washing machines or water efficient shower heads), and 38% using a smart meter or smart home device. A further 18% said their energy was supplied by a renewable source (e.g. solar panels, green tariff) and 19% said they had chosen none of these actions. In the garden, 35% of adults also said they encourage wildlife into their garden or other outdoor space (e.g. feeding birds).
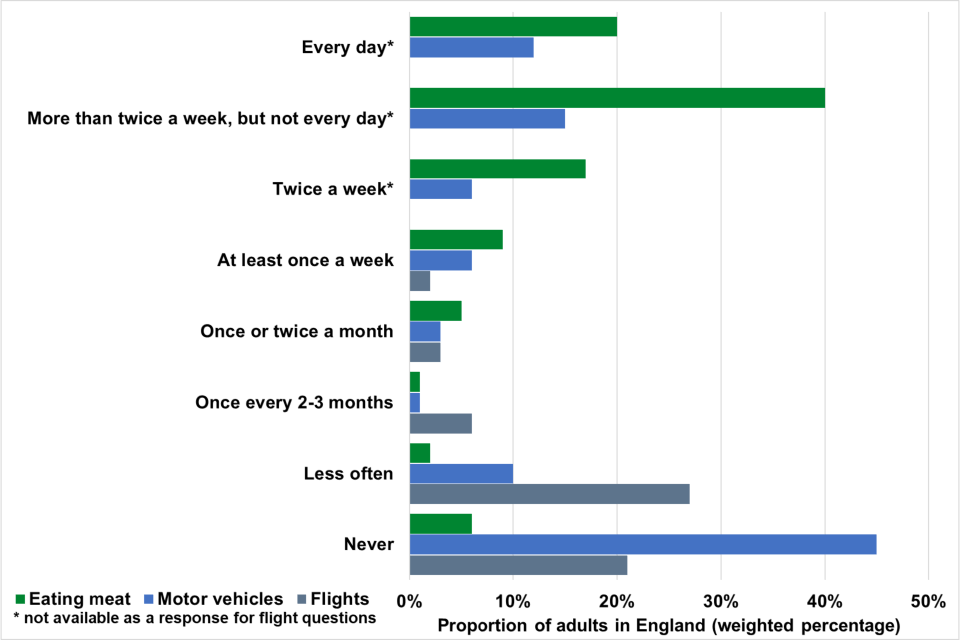
Six in ten (60%) adults said they eat meat more than twice a week, and of these 20% eat it every day. Less than 1 in ten (6%) said they never eat meat. Nearly 3 in 10 (27%) adults said they drive to work or a place of study in a car, motorbike, or van more than twice a week, but nearly half (45%) said they never drive to work or a place of study in a car, motorbike, or van. More than 1 in 10 (11%) adults took a flight at least once every 2 to 3 months, but the majority (71%) said they took one once a year or less, including 21% who never fly (Figure 6).
Figure 6: Proportion of adults in England (weighted percentage) showing lifestyle choices and behaviours.
Proportion of adults in England how often eating meat, making journeys by motor vehicles and taking flights
Figure notes
Source:
M4_Q13A How often do you do the following? Eat meat; Drive to work or place of study in a car/ motorbike or van.
M4_Q13B How often do you take flights on an aeroplane?
(1) Data collected between April 2nd 2020 and March 31st 2021 (inclusive).
(2) The samples for this question were 4,930 (M4_Q13A) and 4,930 (M4_Q13B).
(3) Not all responses are shown. “Every day”, “More than twice a week, but not every day” and “Twice a week” were not available as a response to question M4_Q13B.
9.4 Making changes
83% of adults said they were going to make changes to their lifestyle to protect the environment. Of the 16% who said they would not, 51% said they already do as much as they can, 33% said they like their lifestyle and don’t want to change, and 22% said it is too difficult or they don’t know how.
10. Other results
The spreadsheets accompanying this report include data and summaries on a greater number of areas and on the areas already presented in more detail. The full list of areas covered includes:
General experiences of green and natural spaces:
- Frequency of time spent outside in past 12 months
- Places visited
- Quality of local space
- General/local greenspace standards
- Nature connection
Visits taken to green and natural spaces in last 14 days:
- Total number of visits
- Main visit in past 14 days: destination/s, start place, distance, duration, activities, benefits of visit, transport, who with, physical exertion, money spent, reason for visit, quality of place/s visited
- Reasons for not visiting/barriers
Children (asking parent/guardian):
- Frequency of time spent outside in past 12 months
- Places visited
- Visit partners
- Benefits of time outdoors
- Reasons for not spending more time outdoors
- Time spent in private garden
Environmental attitudes:
- Importance of protecting the environment
- Reasons to look after the environment
- Concern about damaging natural environment
- Perceived variety of animal / plant life
- Concern about loss of variety
- Environmental issues that are of concern
- Environmental social action
- Environmental lifestyle choices
- Eating meat
- Driving
- Aeroplane use
- Energy use
- Water waste
- The amount of things bought
- Responsibility for environmental damage
Gardens:
- Frequency of time spent in gardens
- Importance of gardens
- Reasons for spending time in garden
- Benefits of time in garden
- Description of garden
- Wildlife friendly gardening behaviours
11. Methodological note
Results from all surveys are attempts to estimate “true values” in a wider population. Therefore all survey statistics come with an associated margin of error within which the “true” population measure is expected to lie. All differences between groups in this report have been tested for statistical significance; that is, the difference between two compared values are significant even after we have accounted for the margins of error.
Differences between groups were tested using Chi-square tests. Unless otherwise specified, all commentary in the report focuses exclusively on differences that are statistically significant at a 95 per cent confidence level. This means that if the survey was conducted 100 times, a finding of the same nature would be found in at least 95 cases.
Bespoke weights for the People and Nature Survey for England have been applied to this statistical release. These bespoke weights have been generated using regression modelling and include a large number of significant demographic variables (Urban / Rural, Region, Age by Gender, Working Status by Gender, Long lasting health condition, Number cars/vans, Education, Ethnicity, Dog ownership, Presence of children under 16).
Applying weights to data, while tending to make the quoted figures more representative of the population of interest, has the effect of reducing the effective sample size of the data. As such, the effective base size, which is used in any statistical testing, is smaller than the unweighted base size and this has the effect of increasing the confidence intervals around the survey estimates. This effect has been taken into account when determining whether or not differences between survey estimates described throughout the report are statistically significant. Therefore, while the base sizes reported throughout this report are the actual base sizes, the statistical analysis is based on the effective base.
Further information about the survey’s methodology can be found here.
12. Strengths and Limitations
Information about the survey’s strengths and limitations can be found here.
13. Glossary
Visits to green and natural spaces are defined in this survey as visits to green spaces in towns and cities (e.g. parks, canals); the countryside (e.g. farmland, woodland, hills and rivers); the coast (e.g. beaches, cliffs) and activities in the open sea; This includes: visits of any duration (including short trips to the park, dog walking etc.). They do not include time in gardens; outside spaces visited as part of someone’s job; or time spent outside the UK. Additional questions are asked about private gardens.
95% confidence interval is a range of values around a calculated statistic (e.g. the mean) that you are 95% certain contains the true value of that statistic. For example, where there is a mean value of 49 with a 95% confidence interval of 2, we would be 95% certain that the true mean of the population was in the range of 47-51 (i.e. 49 -2 and 49 + 2). Please note that the People and Nature Survey uses quota sampling and confidence intervals here were calculated as if the data were generated from a random probability sample.
14. Contact
Natural England welcomes feedback on these monthly indicators, questions, and suggestions for analysis for future releases. Please contact the team by email: people_and_nature@naturalengland.org.uk
If you would like to receive further information on the survey, including data releases, publications and survey changes, then visit our User Hub and sign-up to the mailing list at the bottom of the page (best viewed in Google Chrome). After signing up, if you do not receive a confirmation email please check your ‘Junk’ or ‘Spam’ folder. The Senior Responsible Officer for this publication is Dr Katherine Burgess Katherine.Burgess@naturalengland.org.uk
15. Pre-release access
This publication did not undergo review outside of the People and Nature Survey for England data production and quality assurance team.
16. Related links
Coronavirus - guidance on accessing green spaces safely: Latest government guidance on using green spaces and protecting yourself and others.
Natural England operational update: Coronavirus information on how Natural England is facing the challenges posed by Coronavirus.
People and Nature questionnaire: Includes link to People and Nature Survey questions.
People and Nature Survey information: Further information on the People and Nature Survey for England.
Coronavirus (COVID-19): safer public places - urban centres and green spaces: Guidance for the owners and operators of urban centres and green spaces to help social distancing.
The Countryside Code Statutory guidance on respecting, protecting and enjoying the outdoors.
-
People and Nature Survey respondents can also answer ‘In another way (specify)’. However, sample sizes were not large enough for those that answered ‘In another way (specify)’ to be able to conduct robust analysis. ↩
-
For some questions with small sample sizes, all ethnic minority groups are reported as one group. Please see section Strengths and Limitations for more information. ↩
-
Long-term illness and its impact on day-to-day functioning were measured using the Government Statistical Service standard measure for disability. The full measure was missing from months April to August 2020. Due to this missing data, we are unable to look at disability as defined by this measure, but instead make comparisons separately between ‘no illness’ and ‘any illness’, and the impact of illness on ability to carry out day-to-day activities (‘yes, a lot’, ‘yes, a little’, or ‘not at all’). ↩
-
Participant home full postcodes were mapped on to area-level deprivation statistics for those living in each lower-layer super output area. England’s official measure of relative deprivation—the Index of Multiple Deprivation (IMD)—was used which ranks all neighbourhoods in England according to the level of deprivation. For the purposes of analyses, participants have then been categorised as either living within the ‘30% most’ or ‘70% least’ deprived areas of England. ↩