Main findings: teacher development inspections and outcomes as at 31 August 2026
Published 11 November 2026
Applies to England

© Crown copyright 2026
This publication is licensed under the terms of the Open Government Licence v3.0 except where otherwise stated. To view this licence, visit nationalarchives.gov.uk/doc/open-government-licence/version/3 or write to the Information Policy Team, The National Archives, Kew, London TW9 4DU, or email: psi@nationalarchives.gov.uk.
Where we have identified any third party copyright information you will need to obtain permission from the copyright holders concerned.
This publication is available at https://www.gov.uk/government/statistics/teacher-development-inspections-and-outcomes-as-at-31-august-2026/main-findings-teacher-development-inspections-and-outcomes-as-at-31-august-2026
Framework changes
This is the first official statistics release covering the renewed ITE framework, which came into effect in January 2026. These statistics are published as official statistics in development. Please see the methodology document for further details.
Your feedback will help us improve future publications. Please share your views by using this survey feedback form.
Reports and data produced under the previous frameworks remain available on the Ofsted statistics website for reference.
This is the main findings report for teacher development inspections and outcomes as at 31 August 2026 release. The following are also available:
-
underlying data, tables and charts
-
methodology
-
pre-release access list
Summary
This release includes:
-
the number of ITE providers and the number of phases being delivered in England on 31 August 2026
-
the number of ITE providers and phases inspected in 2026
-
the number of early career framework (ECF) and national professional qualification (NPQ) lead providers in England on 31 August 2026
The 2025/26 dataset includes inspections that took place from January 2026 to 31 August 2026, with report cards published by 5 October 2026.
The 31 August 2026 dataset includes all teacher development providers eligible for inspection.
During 2026, we inspected 111 phases of ITE, being delivered by 65 providers.
In 2026, 98% of grades given during ITE full inspections were ‘expected standard’ or above.
There have been no ECF or NPQ inspections this year.
Number of ITE providers and phases
As at 31 August 2026, there were 282 providers delivering ITE across the early years, primary, secondary, and further education (FE) and skills phases. Of these, 164 were accredited providers, made up of 103 school-centred initial teacher training (SCITT) providers and 61 higher education institutions (HEIs). Since 2024, the number of accredited providers has decreased by 20%, following the Department for Education (DfE)’s market review.
Since 2024, as part of Ofsted’s work with the DfE to improve the quality of ITE for FE and skills inspections, we increased the number of ITE for FE and skills providers eligible for inspection more than tenfold, from 7 to 118.
Table 1: Number of ITE providers and phases as at 31 August 2026
| Provider type | Total number of providers | Early years | Primary | Secondary | FE and skills |
|---|---|---|---|---|---|
| SCITT | 103 | 6 | 91 | 88 | N/A |
| HEI | 65 | 10 | 56 | 58 | 20 |
| GFEC | 80 | N/A | N/A | N/A | 80 |
| ILP | 25 | N/A | N/A | N/A | 25 |
| SFEC | 6 | N/A | N/A | N/A | 6 |
| LAP | 3 | N/A | N/A | N/A | 3 |
| Total number of phases | – | 16 | 147 | 146 | 134 |
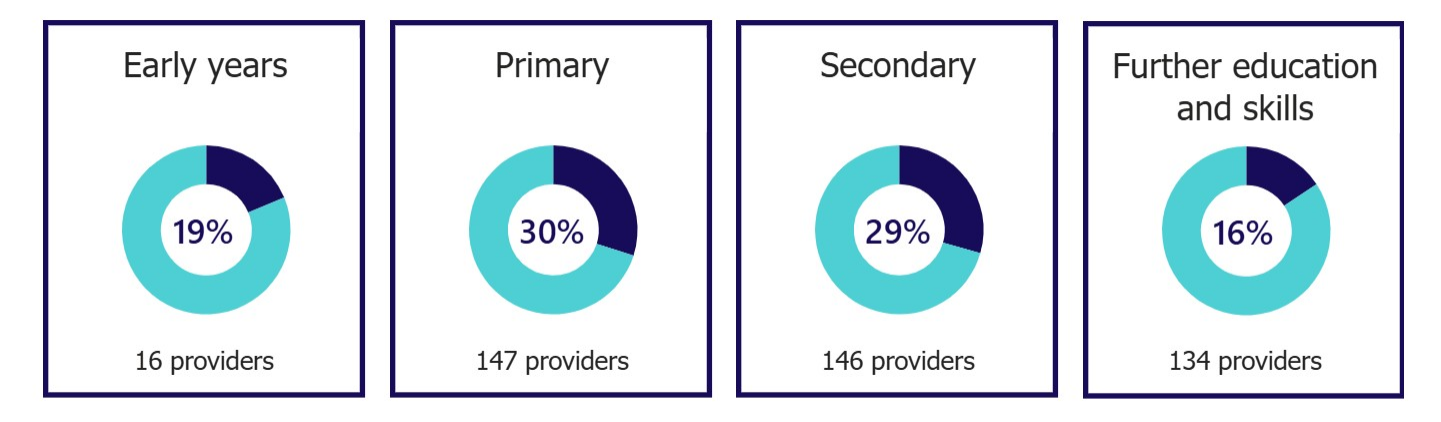
By the end of the first year under the renewed ITE framework, we had inspected around a quarter of the providers and phases.
Figure 1: Number of providers and proportion of those inspected under the renewed ITE framework by phase, 2026
View data in an accessible table format.
In-year ITE inspection volumes and outcomes
In 2026, we inspected 65 providers, covering 111 phases of ITE. Of the providers inspected, 33 were SCITTs (covering 60 phases) and 14 were HEIs (covering 33 phases). We also inspected 18 ITE for FE and skills providers, of which 14 were GFECs, 3 were ILPs and 1 was an SFEC.
Table 2: The number of providers and phases inspected by provider type, 2026
| Provider type | Number of providers inspected | Number of phases inspected | Number of early years | Number of primary | Number of secondary | Number of further education and skills |
|---|---|---|---|---|---|---|
| All providers | 65 | 111 | 3 | 44 | 43 | 21 |
| SCITT | 33 | 60 | 1 | 30 | 29 | N/A |
| HEI | 14 | 33 | 2 | 14 | 14 | 3 |
| GFEC | 14 | 14 | N/A | N/A | N/A | 14 |
| ILP | 3 | 3 | N/A | N/A | N/A | 3 |
| SFEC | 1 | 1 | N/A | N/A | N/A | 1 |
| LAP | 0 | – | N/A | N/A | N/A | – |
Figure 2: ITE outcomes from full inspections by evaluation area, 2026
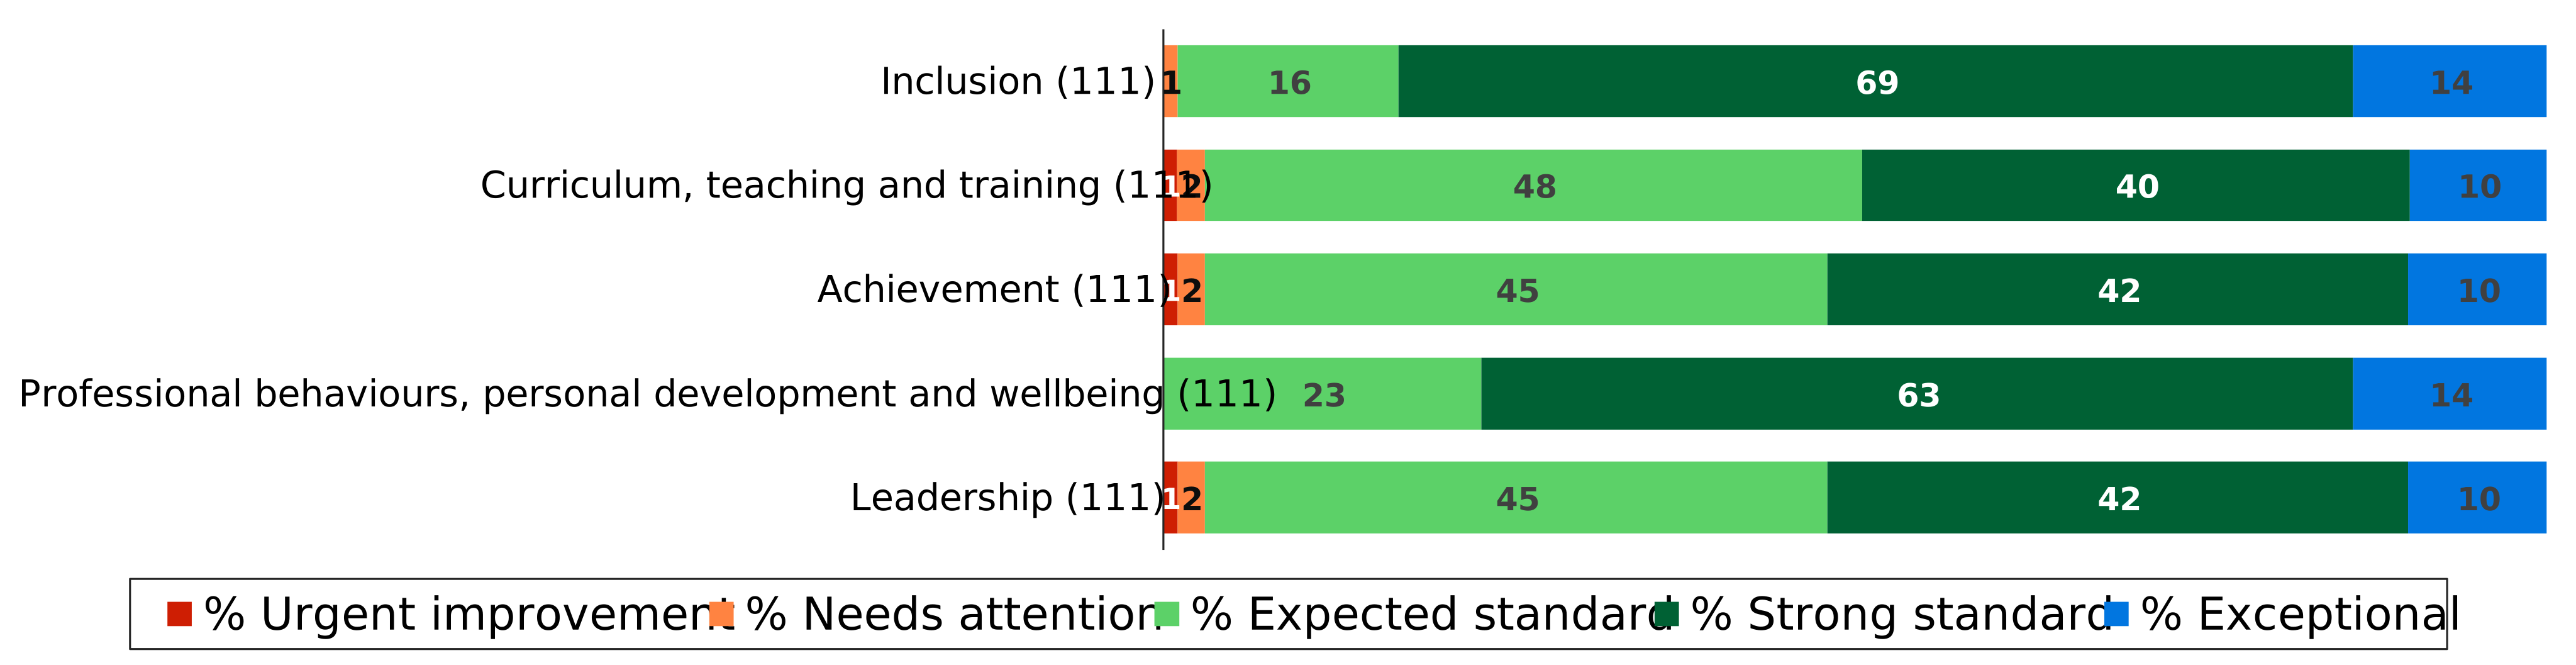
1. Number of grades in brackets.
2. Percentages are rounded and may not add to 100.
View data in an accessible table format.
Early years
Of the 3 early years phase inspections we carried out this year, all were graded ‘expected standard’ or ‘strong standard’ across each of the 5 evaluation areas. All of the providers were found to be meeting the ‘compliance, including safeguarding’ standards.
Primary and secondary
Only accredited SCITTs and HEIs can deliver primary and secondary phase ITE, which leads to qualified teacher status for their successful trainees. This year, we inspected 44 primary phases of ITE, and 43 secondary phases.
Of the 47 providers inspected for primary and secondary phases, 40 delivered both, 4 delivered primary only, and 3 delivered secondary only. Where a provider delivered both, 96% of the grades given were the same for both phases.
Two providers were given at least one ‘needs attention’ grade, 40 providers were given at least one ‘strong standard’ grade, and 11 providers were given at least one ‘exceptional’ grade. No providers were given ‘standards not met’ for ‘compliance, including safeguarding’.
The highest inspection outcomes were given for ‘inclusion’ and ‘professional behaviours, personal development and wellbeing’. For inclusion, the proportion of ‘strong standard’ or ‘exceptional’ grades was 89% for the primary and 88% for the secondary phase. For ‘professional behaviours, personal development and wellbeing’, the proportion was 86% for the primary phase, and 81% for the secondary phase. No providers were given a ‘needs attention’ grade for either of these evaluation areas.
Figures 3a (primary) and 3b (secondary): ITE grades for primary and secondary phases from full inspections by evaluation area, 2026
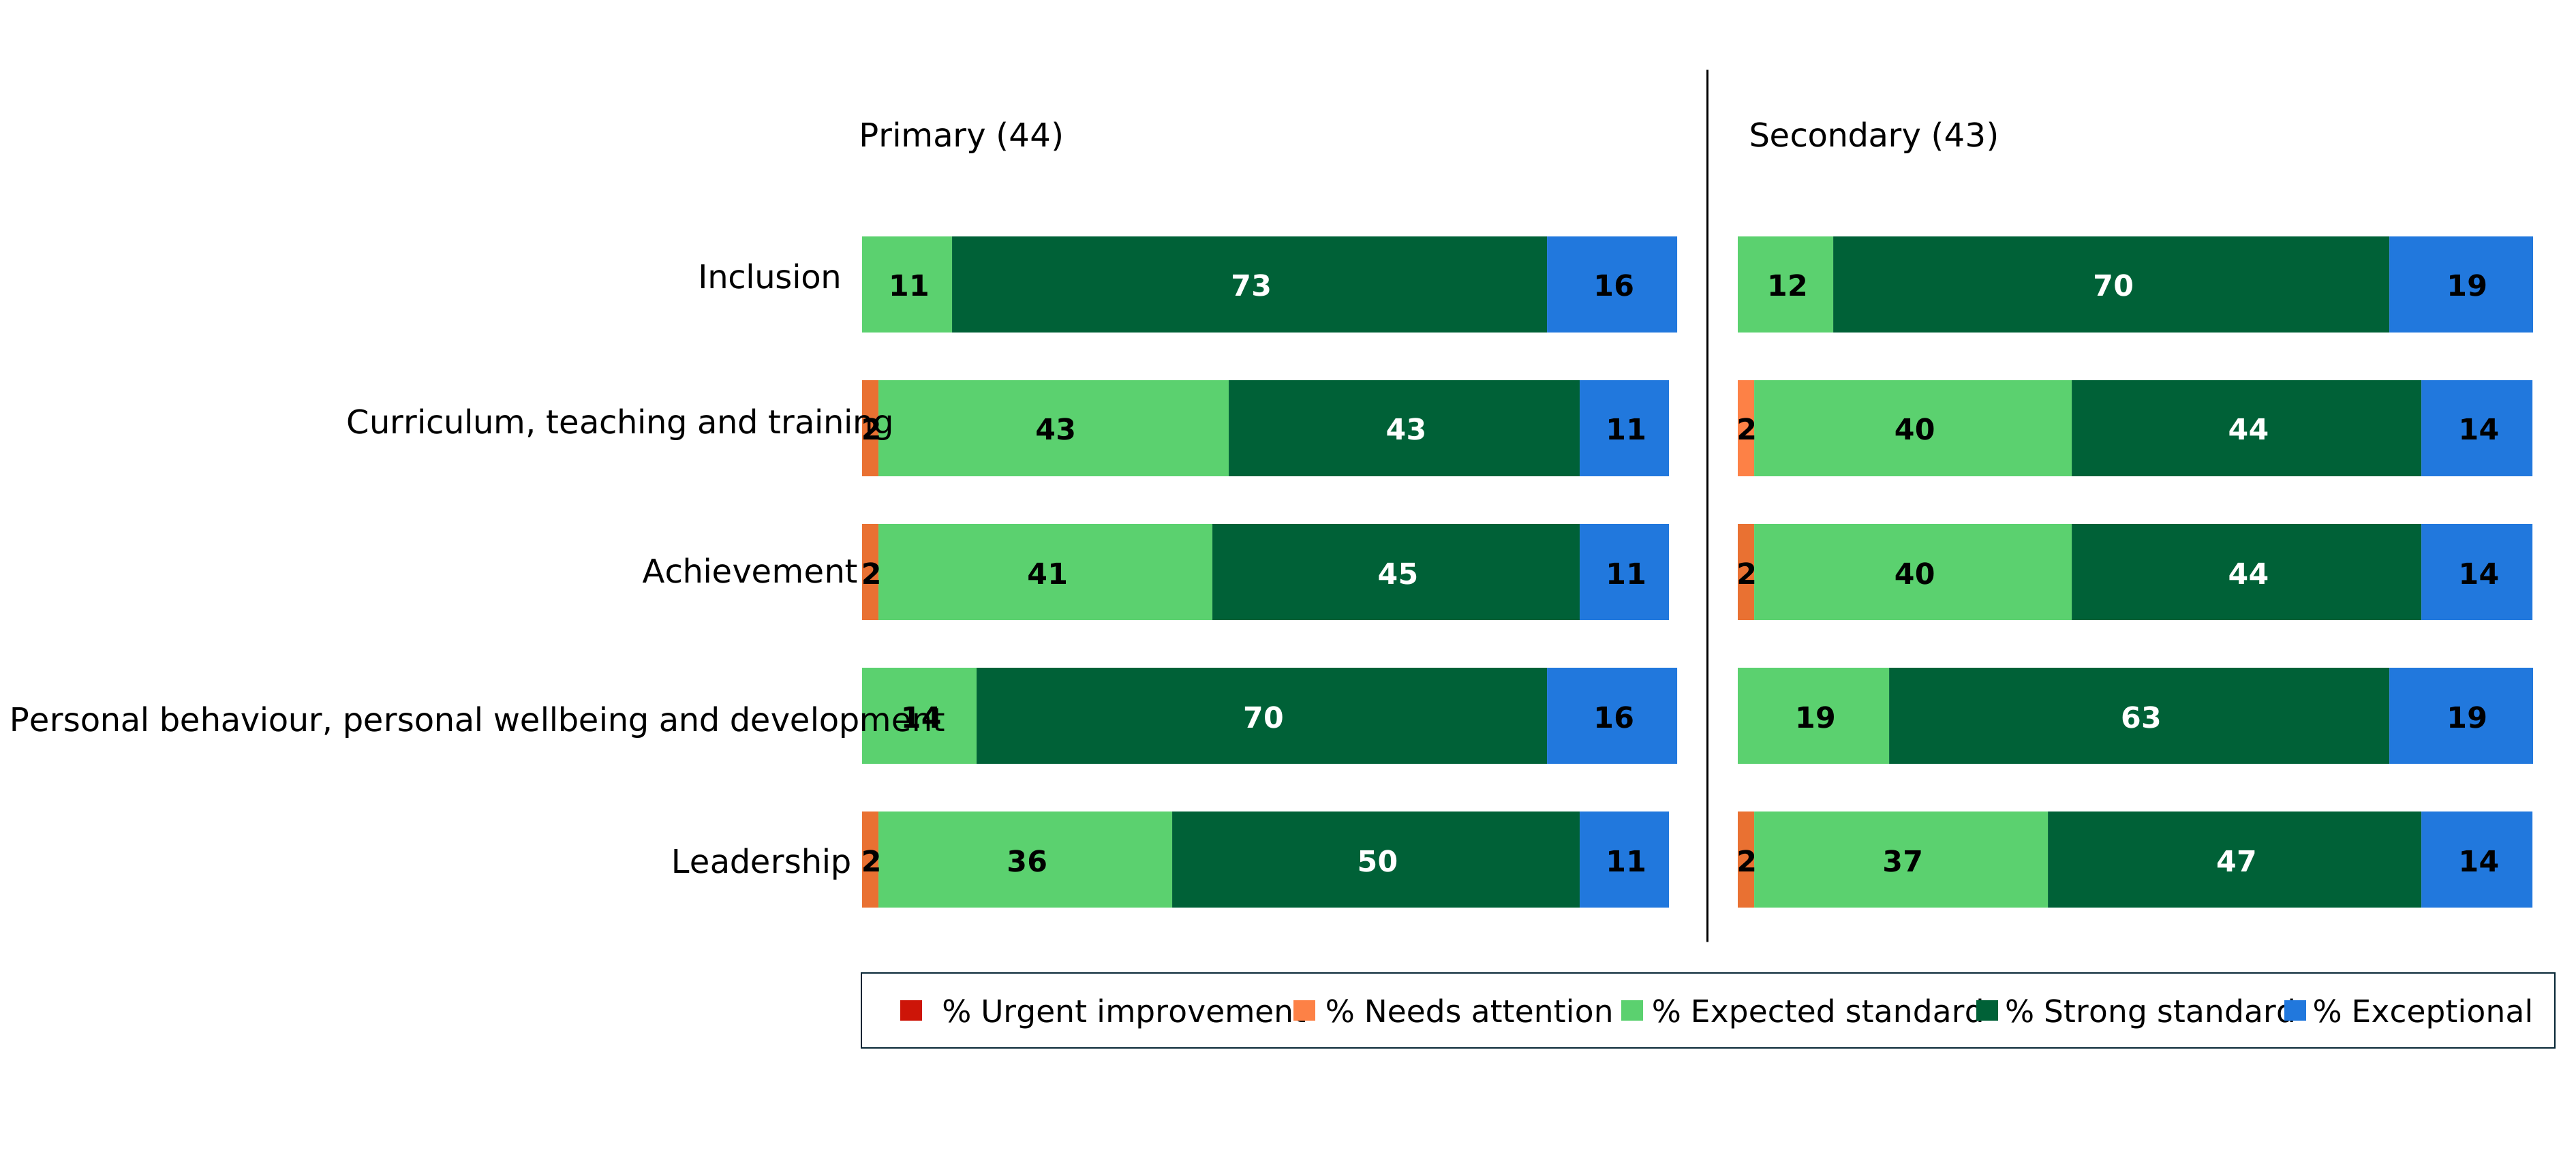
1. Number of grades in brackets.
2. Percentages are rounded and may not add to 100.
View data in an accessible table format.
Further education and skills
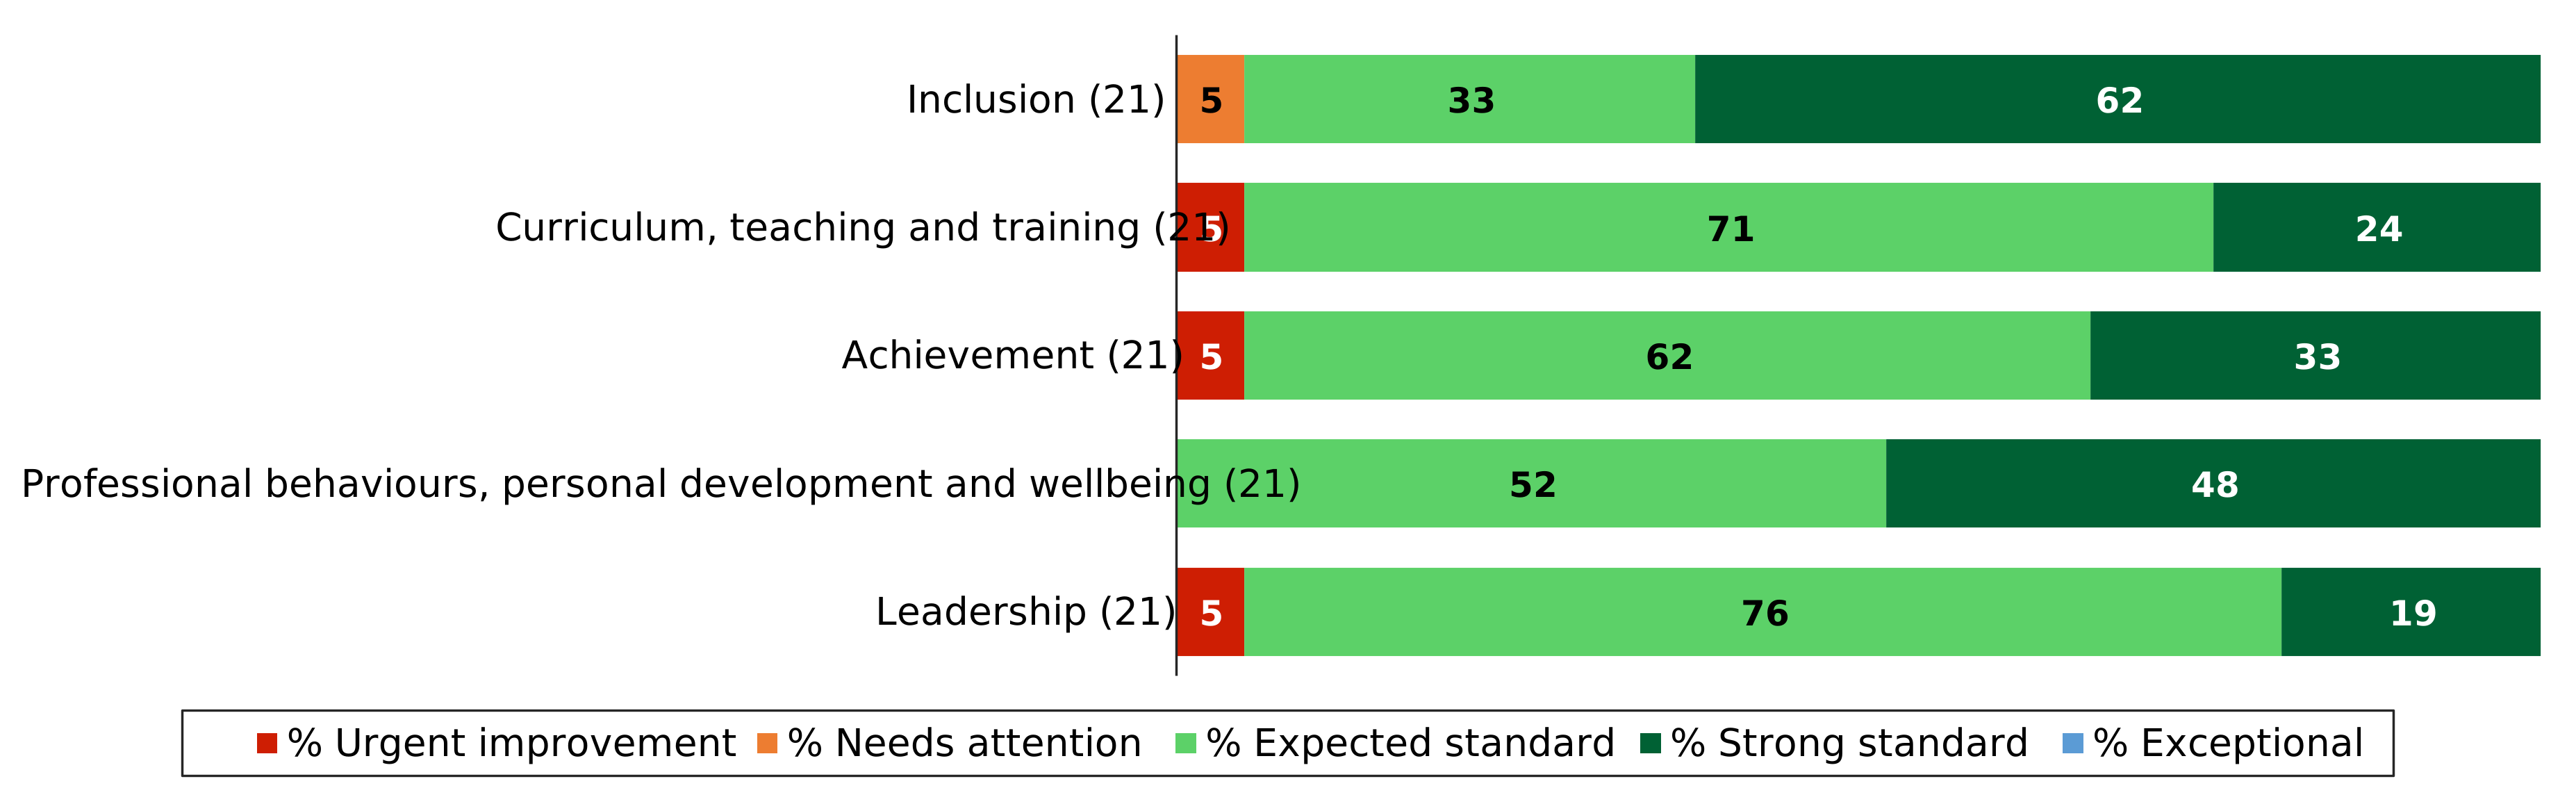
Figure 4: ITE outcomes for FE and skills phase from full inspections by evaluation area, 2026
1. Number of grades in brackets.
2. Percentages are rounded and may not add to 100.
View data in an accessible table format.
Of the 21 FE and skills phase inspections we carried out this year, all but one resulted in an ‘expected standard’ or ‘strong standard’ grade across each of the 5 evaluation areas. The exception was ‘professional behaviours, personal development and wellbeing’, where all phases were graded at least ‘expected standard’. Similarly, all but one of the providers were found to be meeting the ‘compliance, including safeguarding, standards’.
We saw the highest outcomes for the ‘inclusion’ and ‘professional behaviours, personal development and wellbeing’ evaluation areas, where 62% and 48% of providers received ‘strong standard’ respectively.
Early career framework and national professional qualification providers and inspections
NPQ inspections, which had been scheduled for 2025/26, were paused at the DfE’s request while it reviews the qualifications. The pause has enabled us to begin renewing the ECF/NPQ inspection framework. As a result, no NPQ inspections took place this year.
We have not inspected any ECF providers this academic year, as we inspected all 6 under the previous framework in the 2024/25 academic year. At that time, all 6 were graded ‘outstanding’ for overall effectiveness.
Further information
ITE phases
ITE providers can offer training for up to 4 different age ranges. These are called age phases, or phases. They cover:
-
early years
-
primary
-
secondary
-
FE and skills
Contact for comments or feedback
If you have any comments or feedback on this publication, contact Steven Rose on 03000 131567 or steven.rose@ofsted.gov.uk.
Acknowledgements
Thanks to the following for their contribution to this statistical release: Emily Green, Niamh Callaghan, Geraint Williams, Zehra Torun and Ben Lovett.
Annex: data tables for figures
Data for Figure 1: Proportion of providers inspected under the renewed ITE framework by phase, 2026
| Phase type | Number of providers | Percentage inspected |
|---|---|---|
| Early years | 16 | 19 |
| Primary | 147 | 30 |
| Secondary | 146 | 29 |
| Further education | 134 | 16 |
See Figure 1.
Data for Figure 2: Initial teacher education outcomes from full inspections by evaluation area, 2026
| Evaluation area | Total number | Percentage urgent improvement | Percentage needs attention | Percentage expected standard | Percentage strong standard | Percentage exceptional |
|---|---|---|---|---|---|---|
| Inclusion | 111 | 0 | 1 | 16 | 69 | 14 |
| Curriculum, teaching and training | 111 | 1 | 2 | 48 | 40 | 10 |
| Achievement | 111 | 1 | 2 | 45 | 42 | 10 |
| Professional behaviours, personal development and wellbeing | 111 | 0 | 0 | 23 | 63 | 14 |
| Leadership | 111 | 1 | 2 | 45 | 42 | 10 |
See Figure 2.
Data for Figure 3a: Initial teacher education grades for primary phase from full inspections by evaluation area, 2026
| Evaluation area | Total number | Percentage urgent improvement | Percentage needs attention | Percentage expected standard | Percentage strong standard | Percentage exceptional |
|---|---|---|---|---|---|---|
| Inclusion | 44 | 0 | 0 | 11 | 73 | 16 |
| Curriculum, teaching and training | 44 | 0 | 2 | 43 | 43 | 11 |
| Achievement | 44 | 0 | 2 | 41 | 45 | 11 |
| Professional behaviours, personal development and wellbeing | 44 | 0 | 0 | 14 | 70 | 16 |
| Leadership | 44 | 0 | 2 | 36 | 50 | 11 |
Data for Figure 3b: Initial teacher education grades for secondary phase from full inspections by evaluation area, 2026
| Evaluation area | Total number | Percentage urgent improvement | Percentage needs attention | Percentage expected standard | Percentage strong standard | Percentage exceptional |
|---|---|---|---|---|---|---|
| Inclusion | 43 | 0 | 0 | 12 | 70 | 19 |
| Curriculum, teaching and training | 43 | 0 | 2 | 40 | 44 | 14 |
| Achievement | 43 | 0 | 2 | 40 | 44 | 14 |
| Professional behaviours, personal development and wellbeing | 43 | 0 | 0 | 19 | 63 | 19 |
| Leadership | 43 | 0 | 2 | 37 | 47 | 14 |
See Figures 3a and 3b.
Data for Figure 4: Initial teacher education outcomes for further education and skills phase from full inspections by evaluation area, 2026
| Evaluation area | Total number | Percentage urgent improvement | Percentage needs attention | Percentage expected standard | Percentage strong standard | Percentage exceptional |
|---|---|---|---|---|---|---|
| Inclusion | 21 | 0 | 5 | 33 | 62 | 0 |
| Curriculum, teaching and training | 21 | 5 | 0 | 71 | 24 | 0 |
| Achievement | 21 | 5 | 0 | 62 | 33 | 0 |
| Professional behaviours, personal development and wellbeing | 21 | 0 | 0 | 52 | 48 | 0 |
| Leadership | 21 | 5 | 0 | 76 | 19 | 0 |
See Figure 4.