Social Networking - Taking Part Survey 2019/20
Published 16 September 2020
Applies to England

© Crown copyright 2020
This publication is licensed under the terms of the Open Government Licence v3.0 except where otherwise stated. To view this licence, visit nationalarchives.gov.uk/doc/open-government-licence/version/3 or write to the Information Policy Team, The National Archives, Kew, London TW9 4DU, or email: psi@nationalarchives.gov.uk.
Where we have identified any third party copyright information you will need to obtain permission from the copyright holders concerned.
This publication is available at https://www.gov.uk/government/statistics/taking-part-201920-social-networking/social-networking-taking-part-survey-201920
The Taking Part survey is a continuous face to face household survey of adults aged 16 and over and children aged 5 to 15 years old in England. This chapter summarise results from adults (16+) and their use of social networking from the 2019/20 survey, which ran from April 2019 to March 2020.
Differences between groups are only reported on in this publication where they are statistically significant i.e. where we can be confident that the differences seen in our sampled respondents reflect the population [footnote 1].
1. Social Networking
In 2019/20, 87% of respondents had used social networking websites or applications in the past 12 months, an increase from 84% in 2018/19.
Of these, just over half accessed these websites or apps several times a day (51%) and over a quarter (29%) at least once a day.
Fig 6.1 Reported frequency of using social networking websites or apps, 2019/20
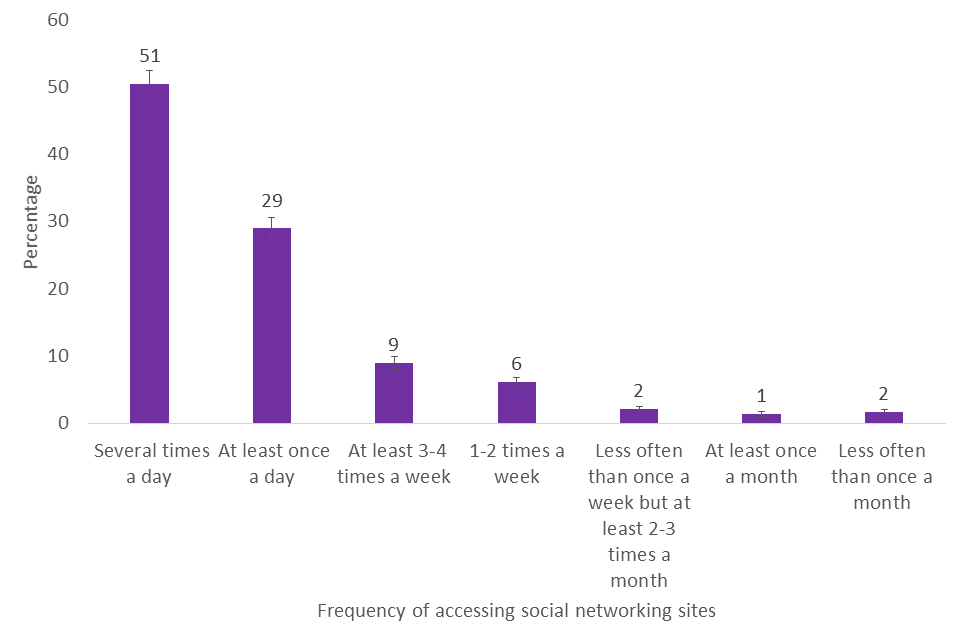
Frequency of accessing social networking sites, 2019/20
Of those respondents who accessed social networking sites once a month or more were asked for their reasons. It is worth noting that response categories were predefined for the respondent and related to areas relevant to digital, culture, media or sport.
The most common of these responses was to find out about what is happening in their local area (52%), find places to do a particular activity (24%), get information about arts events (18%) and get information about local sports facilities (17%).
Figure 6.2: Top five most commonly reported reasons for accessing social networking websites or apps, 2019/20

Most popular reasons given (from predefined list) for using social networking sites, 2019/20
Respondents were also asked, using a predefined list, whether they had done various activities on social media within the last 12 months. Of these, uploading photos, videos or music content was the most popular (55% of respondents), followed by reading or sharing news (50%) and streaming music (31%).
Figure 6.3 Participation in particular activities on social media in the last 12 months, 2019/20
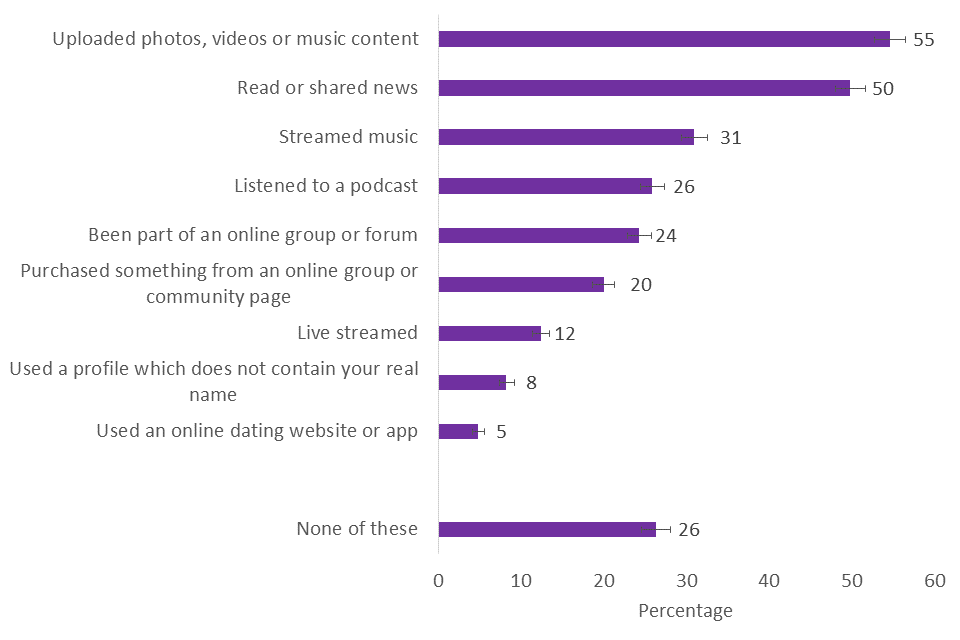
Popularity of doing certain activities on social networking sites in the last 12 months, 2019/20
2. Who accesses social networking websites and apps?
Nearly all (99%) of 16-24 year olds had used social networking sites in the last 12 months, and a decrease in participation was seen with increasing age, with only 38% of those over 75 years old using social networking. Increases in participation in social networking from 2018/19 to 2019/20 were seen for the age groups 45-64 (88% to 91%), 65-74 (64% to 74%) and 75+ (29% to 38%).
Fig 6.4 Reported frequency of using social networking websites or apps by age, 2018/19 - 2019/20
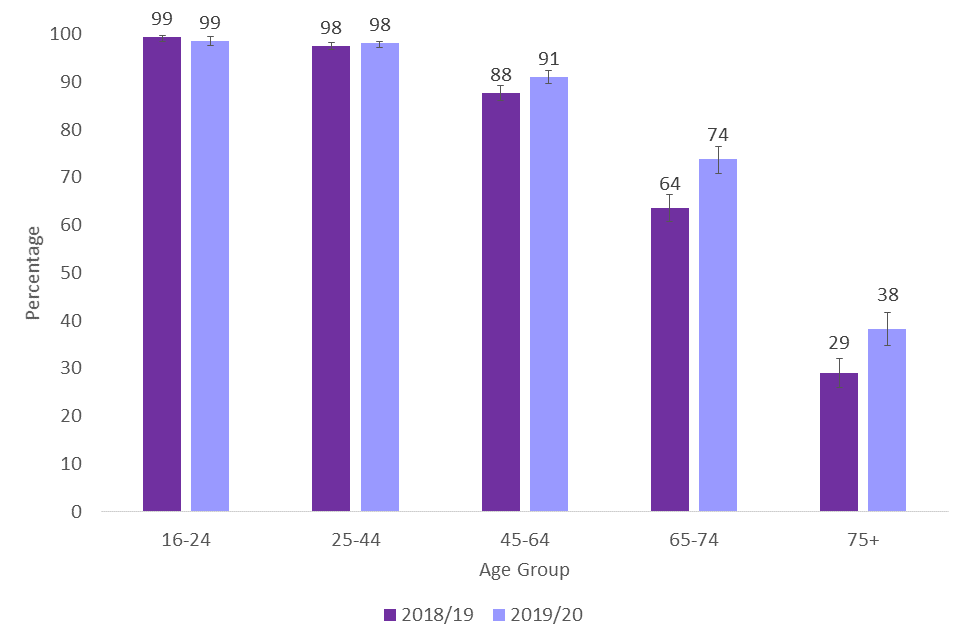
Percentage of respondents who have used social networking sites in the last 12 months by age group, 2018/19 – 2019/20
White respondents were less likely to have used social networking in the last 12 months (86%) than those of Asian or Black ethnicities (92-93%). The highest participation was seen by Mixed respondents, where 99% reported using social networking.
Fig 6.5 Reported frequency of using social networking websites or apps by ethnicity, 2018/19 - 2019/20
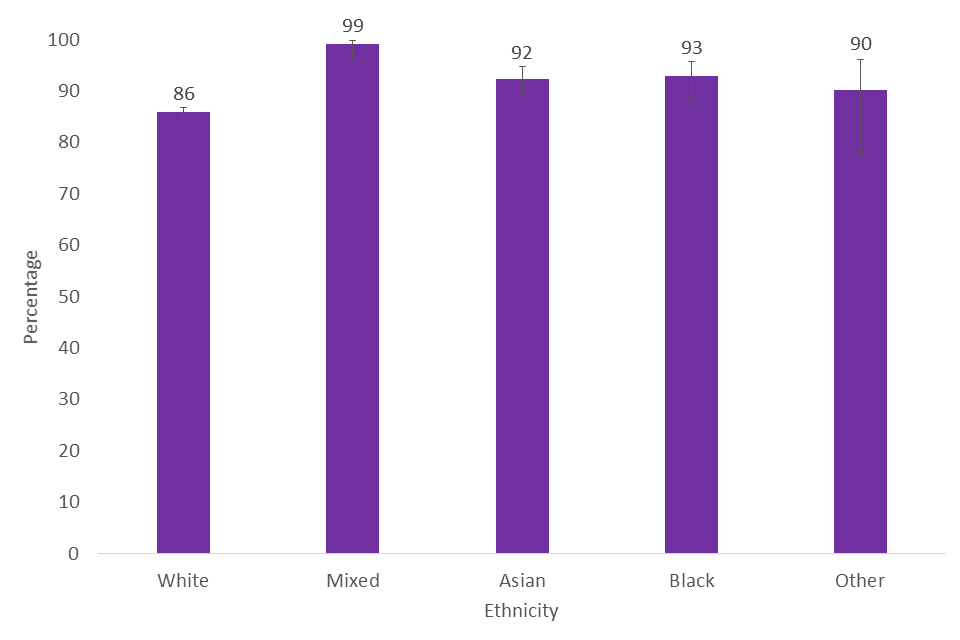
Percentage of respondents who have used social networking sites in the last 12 months by ethnicity, 2019/20
Regional variability in whether respondents used social networking was seen for 2019/20. For example, those in the North East were less likely (80%) than those in Yorkshire and the Humber, the East of England, London and the South East (87-92%). Additionally, those in London (92%) were more likely to have used social networking than those in the East the North West, the East Midlands, the West Midlands and the South West (84-84%).
Fig 6.6 Reported frequency of using social networking websites or apps by region, 2018/19 - 2019/20
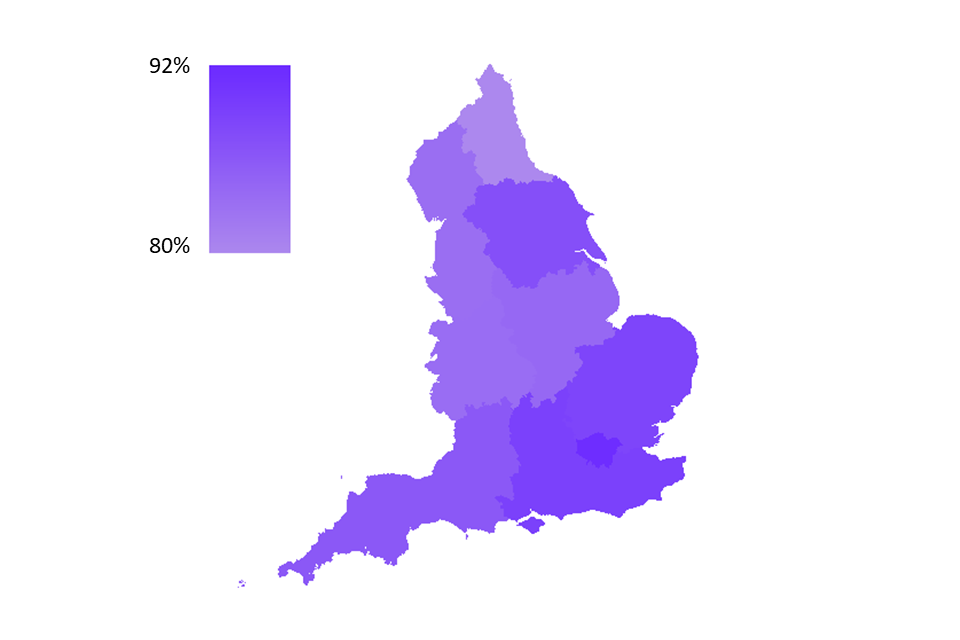
Percentage of respondents who have used social networking sites in the last 12 months by region, 2019/20
Similar to 2018/19, those with a long-term limiting illness or disability were less likely to have used social networking sites (78%) versus those without (91%).
Looking at socio-economic background [footnote 2], a higher proportion of respondents with higher managerial, administrative and professional occupations (91%) had used social networking in the last 12 months compared to those with intermediate occupations (86%) and those with routine and manual occupations (82%).
2.1 Further demographic data
- Those in the private rented sector were more likely to have used social networking (96%) than homeowners or those in the social rented sector (82-85%) *No variability was seen with the Index of Multiple Deprivation [footnote 3], gender, or urban/rural status
-
The 95% confidence intervals are indicated by error bars on the charts. They show the range that we are 95% confident the true value for the population falls between. When there is no overlap between the error bars for two or more groups, we can be more confident that the differences between groups represent true differences between these groups in the population ↩
-
Using National Statistics Socio-economic classification (NS-SEC), respondents were categorised as being in one of three groups – Higher managerial, adminisitative and professional occuptions; Intermediate occuptions; Routine occupations. The NS-SEC classifies people depending on their employment. For more information see Annex B. ↩
-
The Index of Multiple Deprivation, commonly known as the IMD, is the official measure of relative deprivation for small areas in England. It is calculated using several measures such as income deprivation, crime and living environment deprivation. The Index of Multiple Deprivation ranks every small area in England from 1 (most deprived area) to 32,844 (least deprived area), which we have sorted into deciles for this publication. ↩