Museums - Taking Part Survey 2019/20
Published 16 September 2020
Applies to England

© Crown copyright 2020
This publication is licensed under the terms of the Open Government Licence v3.0 except where otherwise stated. To view this licence, visit nationalarchives.gov.uk/doc/open-government-licence/version/3 or write to the Information Policy Team, The National Archives, Kew, London TW9 4DU, or email: psi@nationalarchives.gov.uk.
Where we have identified any third party copyright information you will need to obtain permission from the copyright holders concerned.
This publication is available at https://www.gov.uk/government/statistics/taking-part-201920-museums/museums-taking-part-survey-201920
The Taking Part survey is a continuous face to face household survey of adults aged 16 and over and children aged 5 to 15 years old in England. This chapter summarise results from adults (16+) and their engagement with museums and galleries from the 2019/20 survey, which ran from April 2019 to March 2020.
Differences between groups are only reported on in this publication where they are statistically significant i.e. where we can be confident that the differences seen in our sampled respondents reflect the population [footnote 1].
1. Attending museums or galleries
In 2019/20, 51% of respondents reported having visited a museum or gallery in the last 12 months. This is similar to 2018/19 and represents an increase from 42% in 2005/06.
Figure 3.1: Proportion of respondents who had visited a museum or gallery in the last 12 months, 2005/06 to 2019/20
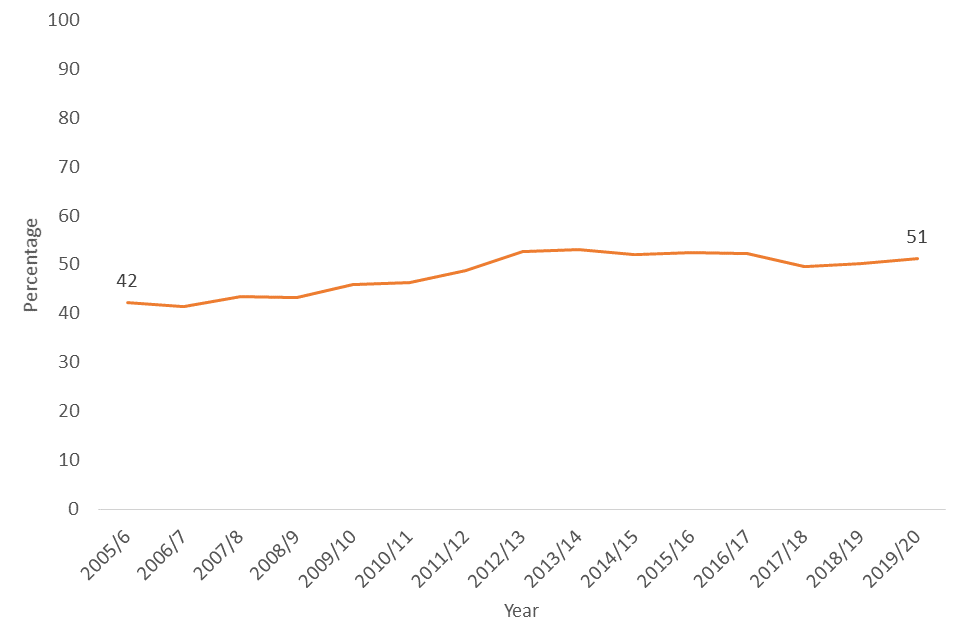
Percentage of respondents who have visited a museum or gallery in the last 12 months, 2005/6 – 2019/20
The survey asks about frequency of museum and gallery visits. In 2019/20, 0.5% of respondents said they has visited a museum or gallery at least once a week in the last 12 months, 4% at least once a month, 17% three to four times a year, 15% twice in the last 12 months, and 14% once in the last 12 months. Around half of the adult population (48%) reported that they had not attended a museum or gallery in the past 12 months. These estimates were similar to 2018/19.
Figure 3.2: Proportion of respondents who had visited a museum or gallery in the last 12 months frequency of engagement, 2018/19 and 2019/20
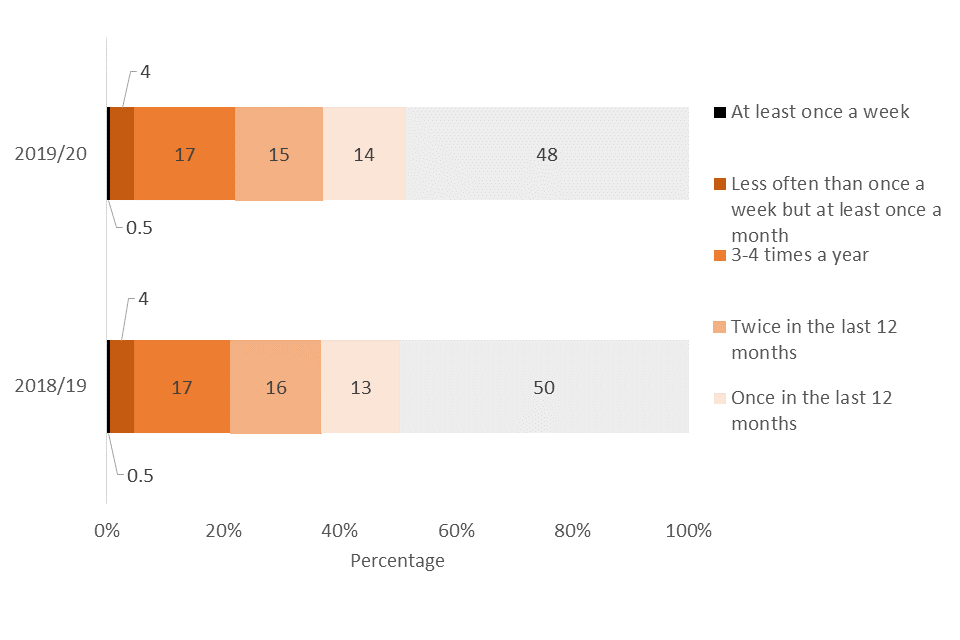
Nested bar chart showing the frequency with which respondents visited museums or galleries in the last 12 months, 2018/19 and 2019/20
In 2018/19, respondents were asked to give their reasons for visiting a museum or gallery. Respondents could give multiple reasons. The most common reason was a general interest in the subject of the museum/collection (50%) followed by spending time with family or friends (40%). None of the reasons which could have been selected significantly changed in popularity from 2018/19 to 2019/20.
Figure 3.3 - The five most common reasons for visiting a museum or gallery reported by respondents in the last 12 months, 2019/20

Bar chart showing the most common barriers for visiting a museum/gallery, 2019/20
Respondents who had not visited a museum or gallery were asked for their reasons for not visiting. In 2018/19, the most common reasons were not being interested (41%), not having time (38%), having a health problem or disability (13%) and difficulty getting there (8%). None of the reasons which could have been selected significantly changed in popularity from 2018/19 to 2019/20.
Figure 3.4 - The five most common reasons reported by respondents for not visiting a museum or gallery, 2019/20
Bar chart showing the most common barriers for visiting a museum/gallery, 2019/20
2. Digital participation
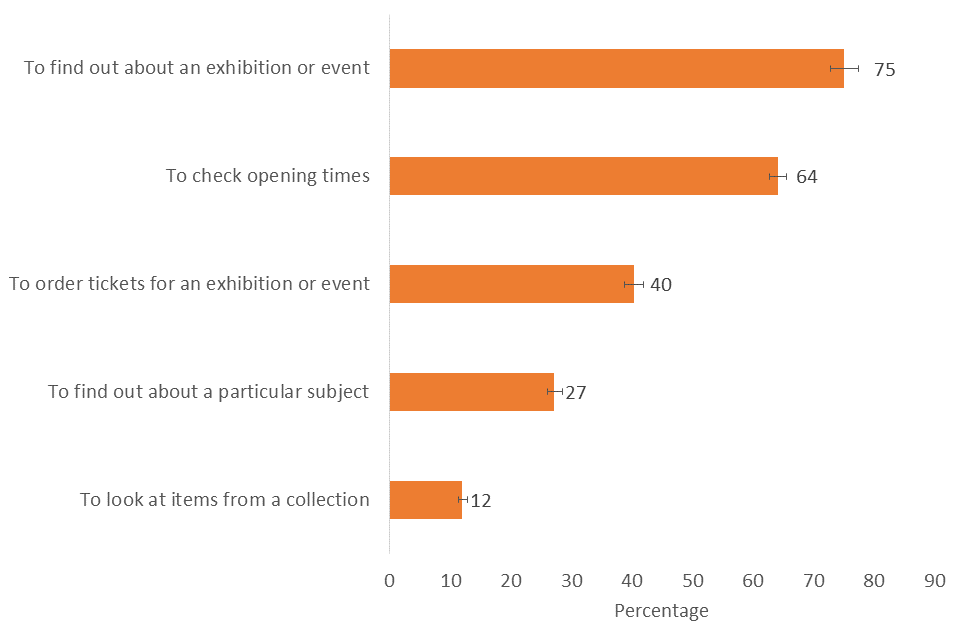
In 2019/20, 32% of respondents had visited or used a museum or gallery website or app in the last 12 months. This is an increase from 2018/19 (27%).
The most common reasons for visiting museum or gallery websites were ‘to find out about an exhibition or event’ (75%), ‘to check opening times’ (64%) and ‘to order tickets for an exhibition or event’ (40%). The popularity of the option ‘to find out about a particular subject’ dropped from 35% of visitors in 2018/19 to 27% in 2019/20.
Figure 3.5 - Five most commonly reported reasons for visiting a museum or gallery website, 2019/20
Bar chart showing the most common reasons for visiting a museum/gallery website, 2019/20
3. Volunteering in a museum or gallery
An estimated 3% of respondents reported having volunteered in a sector connected with museums or galleries in the past 12 months. For headline statistics on volunteering please see results from DCMS’ Community Life Survey.
4. Who visits museums and galleries?
In 2019/20, the most common age groups to visit a museum or gallery were between 25 and 74 years old (54-55%), whilst 45% of those aged 16-24 years visited at least once in the last 12 month. These age groups were significantly more likely to visit than those aged 75 and older (36%). This pattern has been seen consistently from 2005/6 when the survey began.
Figure 3.6: Proportion of respondents who have visited a museum or gallery in the last 12 months by age group, 2019/20
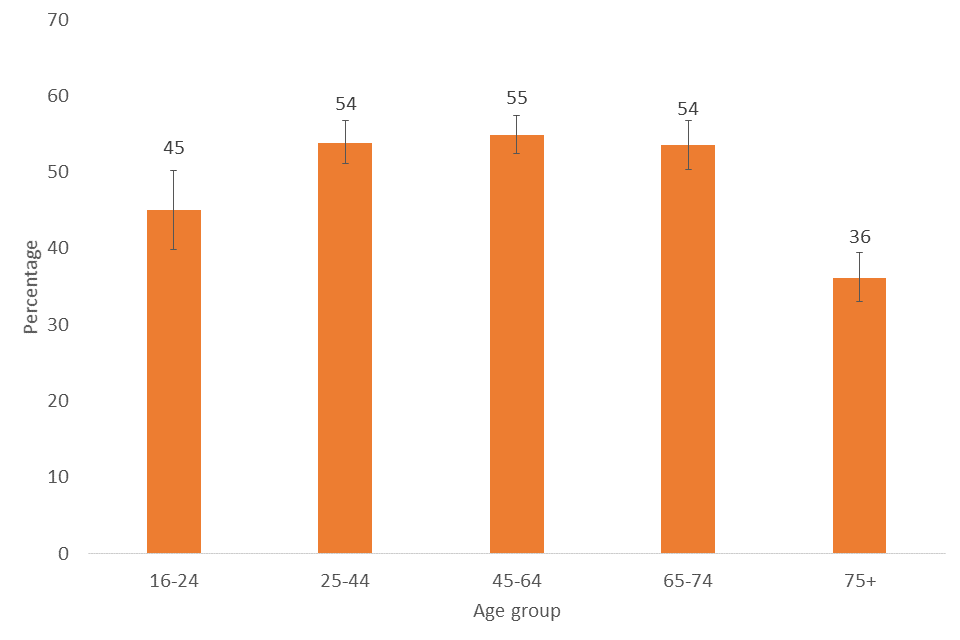
Percentage of respondents who have visited a museum or gallery in the last 12 months by age, 2019/20
Black respondents were less likely to have visited museums in 2019/20 (28%) than White, Mixed and Asian respondents (46-63%), a similar trend to previous years.
Figure 3.7 - Proportion of respondents who have visited a museum or gallery in the last 12 months by ethnicity, 2019/20
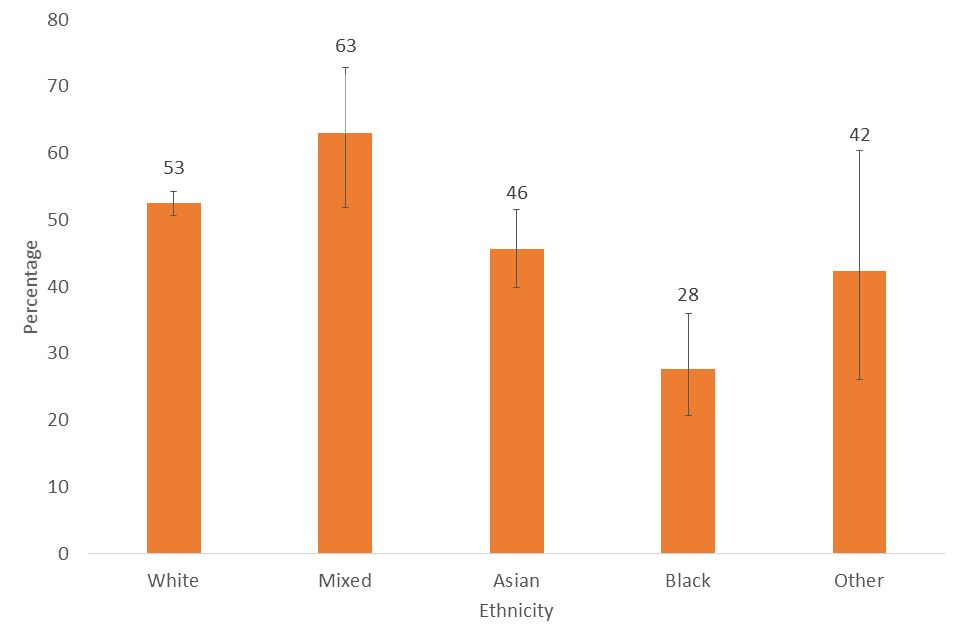
Percentage of respondents who have visited a museum or gallery in the last 12 months by ethnicity, 2019/20
Those living in the most deprived areas [footnote 2] were less likely to have visited a museum/gallery in 2019/20 (34%) compared to those living in the least deprived areas (59%).
Figure 3.8 - Proportion of respondents who have visited a museum or gallery in the last 12 months by Index of Multiple Deprivation, 2019/20

Percentage of respondents who have visited a museum or gallery in the last 12 months by Index of Multiple Deprivation, 2019/20
In 2019/20, no significant regional variability was seen. This is a difference from 2018/19, where respondents from the East Midlands were less likely to have visited museums compared to respondents from the East of England, the South East and the South West. This lack of variability should be considered against the smaller sample size for 2019/20, which limits our power to detect differences.
Figure 3.9 - Proportion of respondents who have visited a museum or gallery in the past 12 months by region, 2019/20
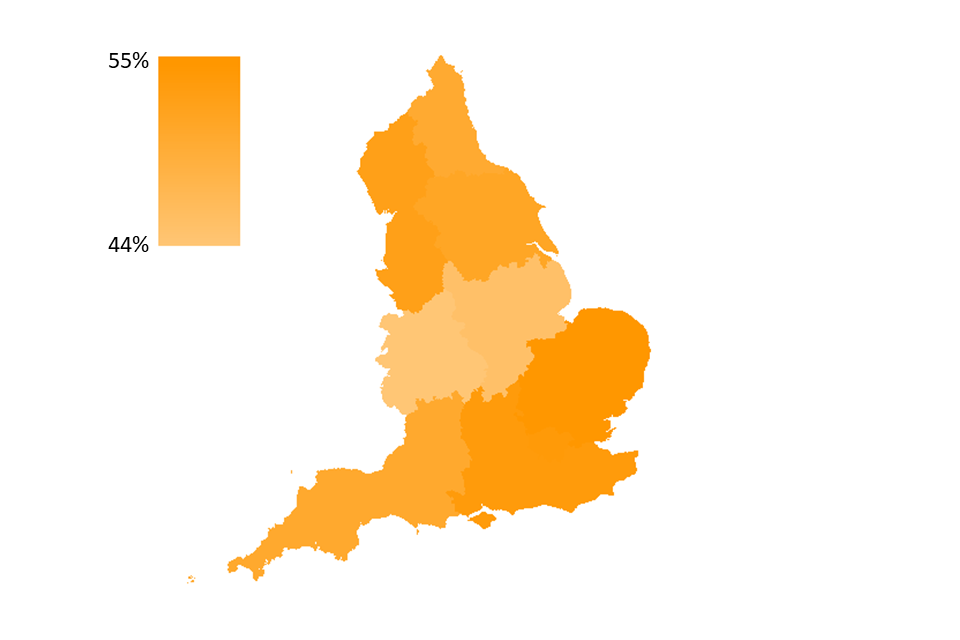
Percentage of respondents who have visited a museum or gallery in the last 12 months by region, 2019/20
Looking at socio-economic background [footnote 3], those with higher managerial, administrative and professional occupations were more likely to have visited a museum/gallery in 2019/20 (66%) than those with routine and manual occupations (36%).
In 2019/20, no difference was seen for visiting a museum when comparing those with a long-term limiting illness or disability than those without. In previous years, those with a long-term limiting illness or disability were less likely to have visited museums than those without. This narrowing should be considered against the smaller sample size for 2019/20, which limits our power to detect differences.
Figure 3.10 - Proportion of respondents who have visited a museum or gallery in the past 12 months by presence of a long-term limiting illness or disability, 2005/6 – 2019/20
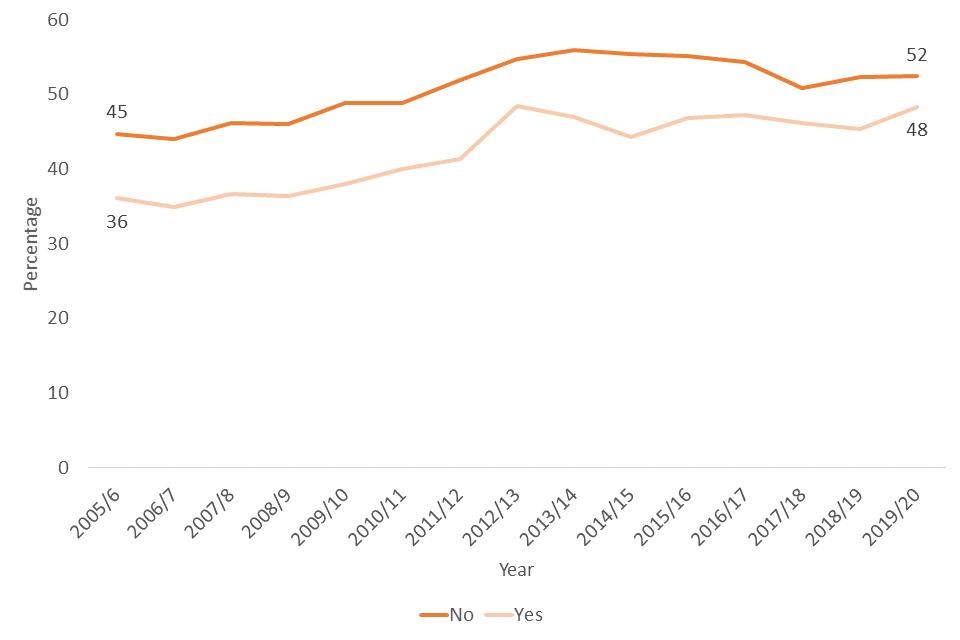
Percentage of respondents who have visited a museum or gallery in the last 12 months by presence of a long-term limiting illness or disability, 2005/6 – 2019/20
4.1 Further demographic data
- Respondents who are not working (45%) were less likely to have visited museums/galleries than those working (56%)
- Homeowners (56%) were more likely to have visited museums/galleries than social renters (32%)
- No significant difference was seen between those who live in urban or rural areas, or with gender
-
The 95% confidence intervals are indicated by error bars on the charts. They show the range that we are 95% confident the true value for the population falls between. When there is no overlap between the error bars for two or more groups, we can be more confident that the differences between groups represent true differences between these groups in the population ↩
-
The Index of Multiple Deprivation, commonly known as the IMD, is the official measure of relative deprivation for small areas in England. It is calculated using several measures such as income deprivation, crime and living environment deprivation. The Index of Multiple Deprivation ranks every small area in England from 1 (most deprived area) to 32,844 (least deprived area), which we have sorted into deciles for this publication. ↩
-
Using National Statistics Socio-economic classification (NS-SEC), respondents were categorised as being in one of three groups – Higher managerial, administrative and professional occupations; Intermediate occupations; Routine occupations. The NS-SEC classifies people depending on their employment. For more information see Annex B. ↩