Statutory homelessness in England: financial year 2022-23
Updated 6 November 2023
Applies to England

© Crown copyright 2023
This publication is licensed under the terms of the Open Government Licence v3.0 except where otherwise stated. To view this licence, visit nationalarchives.gov.uk/doc/open-government-licence/version/3 or write to the Information Policy Team, The National Archives, Kew, London TW9 4DU, or email: psi@nationalarchives.gov.uk.
Where we have identified any third party copyright information you will need to obtain permission from the copyright holders concerned.
This publication is available at https://www.gov.uk/government/statistics/statutory-homelessness-in-england-financial-year-2022-23/statutory-homelessness-in-england-financial-year-2022-23
This is the annual statistics release for statutory homelessness assessments and activities in England between 1 April 2022 and 31 March 2023.
1. In this release:
Release date: 13 October 2023
Date of next release: Autumn 2023
Contact: homelessnessstatistics@levellingup.gov.uk (Responsible Statistician: Madeha Asim)
Media enquiries: 0303 444 1209 / NewsDesk@levellingup.gov.uk
Initial assessments were made for 311,990 households in England in 2022-23, up 7.0% from the previous year. Of these, 298,430 households were assessed as owed a homelessness duty, due to being threatened with homelessness or already being homeless in 2022-23. This is up 6.8% from the previous year, and also 3.0% above the pre-COVID level in 2019-20. This increase from 2021-22 is driven by the increase in both households assessed as being threatened with homelessness, as well as households assessed as already homeless at the time of application.
140,790 households were assessed as being threatened with homelessness and therefore owed a prevention duty in 2022-23. This is a 4.8% increase from 2021-22, however remains 5.7% below the pre-COVID-19 level in 2019-20. The increase from 2021-22 has been influenced by a 22.1% increase, to 54,320 households, in those threatened with homelessness due to the end of an assured shorthold tenancy. In particular there was a 23.5% increase in households owed a prevention duty due to landlords wishing to sell or re-let a property.
157,640 households were assessed as homeless and therefore owed a relief duty in 2022-23. This is up 8.6% from 2021-22, and 12.1% above the pre-COVID-19 level in 2019-20. Similar to increases in prevention duties, this also has been influenced by a 39.4% increase, to 20,180 households, in those threatened with homelessness due to the end of an assured shorthold tenancy.
Other notable changes in 2022-23 compared to the previous year include:
-
decreases in the proportion of successful outcomes at the end of prevention and relief duties
-
increases in number of households (with and without children) owed a homelessness duty due to the end of an assured shorthold tenancy. In particular, large increases were seen in the end of assured shorthold tenancies due to landlords wishing to sell or re-let properties
-
an increase of 23.3% in households owed a prevention or relief duty where the main applicant was aged 65-74
-
increases in number of households owed a prevention or relief duty where the main applicant was in full-time (up 10.8%) or part-time work (up 6.5%), as well as a 19.3% increase in households where the main applicant was retired
2. Introduction
The data used in this release are from the Homelessness Case Level Information Collection (H-CLIC) data system. This system is used as a reporting requirement of local authorities to provide data on statutory homelessness for those approaching local authorities for help with homelessness in line with the Homelessness Reduction Act (HRA). H-CLIC collects detailed data on activities undertaken by local authorities to help prevent or relieve homelessness, and the outcomes of these activities. The statistics reported in this release show total activity over the 2022-23 financial year, except for data on temporary accommodation which is a snapshot on 31 March 2023. Statistics referenced from the accompanying “A” tables on prevention and relief duties owed refer to the initial duties owed on assessment i.e. any references to relief duties owed do not include those who are owed the relief duty following an unsuccessful prevention duty.
2.1 Changes to this release
New outputs have been developed and introduced as part of this 2022-23 annual publication, including:
-
2022-23 Flows dashboard: the flows dashboard was introduced with the 2021-22 annual publication to allow users to more interactively select cohorts of households of interest and follow their journey through the statutory homelessness system. Updates for 2022-23 include the ability to view data for new groups of interest including households required to leave accommodation provided by the home office as asylum support, households with a support need due to physical ill health or disability, and households with a support need due to learning disability.
-
Annual Technical Note: previous annual releases have not been published with a dedicated technical note. For this 2022-23 annual release, we have also published a dedicated technical note. This covers much of the same information as our published quarterly technical notes, with additional information dedicated to data outputs which are only produced with the annual release.
-
Statistics Use, Improvements, and User Engagement Note: this is a new output produced for the first time with this annual release. This output expands upon information which was previously included as a part of our technical note. This note focuses on providing information on how our statistics are used, and user engagement related to improving our statistics. This includes past activities and our current strategy and commitments, records of recent important developments to our statistics, and information on how users can feedback on our statistics.
-
Tables on Reasons for homelessness and homelessness duty outcomes for households with care leavers: this focuses specifically on households with care leavers (18-20 years old, and care leavers aged 21+), recorded as a household support need. These accompanying tables, provide information on the reasons for homelessness, and the outcomes of statutory homelessness duties for care leaver households in 2022-23. To note, this is not a flows analysis, and instead reports on all outcomes reported for households with care leavers in the period.
-
Accessibility of our main outputs this is the first annual release which has been published in a more accessible HTML format. Previous annual released have been produced in PDF format, which are known to be less accessible to some users.
3. Overview of homelessness in 2022-23
2022-23 largely saw homelessness levels increasing from 2021-22. For prevention duties owed, and prevention duties ending, these are still lower than pre-COVID 19 levels seen in 2019-20. For total assessments, relief duties (owed and ending), main duties (decisions and outcomes) and temporary accommodation snapshots, the current figures in 2022-23 are higher than pre-COVID levels in 2019-20.
Figure 1: Trends in prevention, relief and temporary accommodation since 2019 Q2

In total, 140,790 households were assessed as being threatened with homelessness and therefore owed a prevention duty in 2022-23, which is an 4.8% increase from 2021-22, however this remains 5.7% below the pre-COVID-19 level in 2019-20. This increase from 2021-22 to 2022-23 is seen in both households with children (7.9% increase to 61,120) and households without children owed a prevention duty (2.7% increase to 79,660).
The number of households whose prevention duty ended in 2022-23 was 130,770, an increase of 6.5% compared to the previous year but 6.5% lower than pre-pandemic figures in 2019-20.
The number of prevention duties ending increased 11.9% for households with children, and increased by 2.6% for households without children, compared to 2021-2022.
While the number of households with prevention duties ending has risen, there has been a reduction in the proportion of households securing accommodation at this stage. In 2021-22 54.6% of households with children, and 57.3% of households without children, secured accommodation for 6 months or more at the end of their prevention duty. In 2022-23 this was 49.9% for those with children, or 28,990 households, and for households without children this was 54.9%, or 39,960 households. This represents a drop of 4.6 and 2.4 percentage points in the proportion of successful outcomes at the end of prevention duties respectively.
In total 157,640 households were initially assessed as being homeless and therefore owed a relief duty in 2022-23. This is an increase of 8.6% from 2021-22, and also an increase of 12.1% compared to pre-COVID figures in 2019-20. This increase from 2021-22 to 2022-23 is seen in both households with children (16.7% increase to 43,340) and households without children owed a relief duty (5.8% increase to 114,290).
The number of households whose relief duty ended in 2022-23 was 175,290, an increase of 8.6% compared to the previous year, and also 12.8% higher than pre-pandemic figures in 2019-20. The number of relief duties ending increased 23.8% for households with children, and increased by 2.3% for households without children compared to 2021-2022.
While the number of households with relief duties ending has risen, there has been a reduction in the proportion of households securing accommodation at this stage. In 2021-22 31.3% of households with children, and 42.2% of households without children, secured accommodation for 6 months or more at the end of their relief duty. In 2022-23 this was 28.6%, or 16,780 households with children, and for households without children this was 39.9%, or 46,620 households. This represents a drop of 2.6 and 2.2 percentage points in the proportion of successful outcomes at the end of relief duties respectively.
The number of households reported in temporary accommodation has been increasing since 2021-22, and now surpasses previous recorded highs.
4. Households with children
In 2022-23, the number of households with children who were either threatened with homelessness or already homeless increased by 11.4% compared to 2021-22. 61,120 households with children were owed a prevention duty in 2022-23, a 7.9% increase from 2021-22. 43,340 households with children were owed a relief duty in 2022-23, a 16.7% increase from 2021-22.
4.1 Causes and circumstances of homelessness
Tables A2Pc, A2Rc, A4Pc, and A4Rc
The reason for loss of last settled home is a good indication of the cause of homelessness for households assessed as being owed a duty; and current accommodation is used to identify the accommodation types of households who are homeless or threatened with homelessness, at the point at which they make an application to a local authority for help.
Figure 2: Proportion of households with children owed a prevention or relief duty, by reason for loss of last settled home

For those owed a prevention duty, the most common reason for the threatened loss of last settled home was due to the end of their private rented assured shorthold tenancy (AST) at 31,320 households or 51.2% of households with children owed a prevention duty. While overall, households with children owed a prevention duty has increased by 7.9% from the last year, end of private rented AST has increased by over 20% from 2021-2022. The majority of private rented ASTs ended due to the landlord wishing to sell or re-let the property at 68.7% (21,530 households), an increase of 20.1% compared to 2021-22. Larger increases in the number of households with children citing end of private rented ASTs can also be seen for those owed a relief duty, up 43.4% from 2021-22, with landlords wishing to sell or re-let the property going up by more than half (51.7%).
The most common reason for loss of last settled home for those owed a relief duty was due to domestic abuse at 12,000 or 27.7% of households with children owed a relief duty. This is a 5.4% increase from 2021-22. However, for those owed a prevention duty, domestic abuse as a reason had decreased by 6.2% from 2021-22.
Other notable trends from 2022-23 for those owed a prevention duty include an increase in ASTs ending due to an increase in rents (164.7% higher than 2021-22 – 450 compared to 170 households), and decreases in the following reasons for loss of last settled home: Non-violent relationship breakdown with partner (15.1% lower than in 2021-22), rent arrears in social housing (15.7% lower than 2021-22) and eviction from social housing due to breach of tenancy or licence, not related to rent arrears (down 14.3% compared to 2021-22).
For households with children owed a relief duty, non-violent relationship breakdown with partner stayed broadly the same (a 0.4% increase from 2021-22), despite the number of households with children owed a relief duty increasing from 2021-22.
Figure 3: Proportion of households with children owed a prevention or relief duty, by accommodation at time of application

Reflecting the reasons for the threat of homelessness, the most common accommodation at time of application was in the private rented sector at 36,740 households or 60.1% of households with children owed a prevention duty. This was an increase of 14.4% compared to 2021-22. This increase was driven by those in self-contained accommodation, which makes up 92.5% of those in the private rented sector at the time of application, and increased 12.9% from 2021-22. Households in multiple occupation and those lodging (not with family or friends) increased by 23.9% and 64.1% respectively. An increase of 27.0% to 11,340 households approaching from the private rented sector can be seen for those owed a relief duty.
For those owed either a prevention or relief duty, 48,080 households with children living in the private rented sector at time of application is higher than the 39,220 households with children citing the end of a private rented AST as their reason for threat of loss of last settled home, indicating other reasons for leaving their private sector accommodation, such as family exclusions, domestic abuse, relationship breakdowns etc.
For households with children owed a relief duty, the most common accommodation at time of application is living with family (31.3%) at 13,560 households, up 19.2% from 2021-22. For those owed a prevention duty, 12,860 households with children were living with family, down 1.8% from 2021-22, despite the number of prevention duties owed increasing.
4.2 Support needs
Tables A3c
Support needs: areas of additional needs that mean the household requires support to acquire and sustain accommodation, giving an indication of the additional services local authorities need to provide to prevent an individual becoming homeless or to stop the cycle of repeat homelessness. Local authorities report as many support needs or relevant life experiences that apply to each household.
Figure 4: Proportion of households with children owed a prevention or relief duty, by support need

Figure note: Categories in Figure 4 marked with “*” have been created using multiple related support needs. This means some households may be counted more than once in these categories.
Of the 104,460 households with children owed a prevention or relief duty in 2022-23, 40.3% of households (42,090) had at least one support need, a similar proportion to 2021-22 (39.6%). Of the households who had a support need, the majority of households (58.5%) had one support need, 23.9% had two support needs, and 17.5% had three or more.
The most common support need for households with children in 2022-23 was those with a history of mental health problems, recorded for 17,000 households, or 16.3% of all households with children owed a duty. This is a 11.8% increase in absolute number of households since 2021-22, however this support need affects a similar proportion of households owed a duty in comparison to the previous year (as shown in Figure 4).
The separate support needs dashboard shows that 69.2% of households with children who had a mental health support need had one or more additional support needs. Of these, the most common co-occurring support need was physical ill health or disability, affecting 33.6% of households with children with a mental health support need.
Risk of/experience of domestic abuse was also a common support need among households with children, recorded for 16,020 households, or 15.3% of households owed a duty. This is a 4.8% increase in the number of households with children with a domestic abuse support need compared to 2021-22.
4.3 Prevention and relief duty outcomes
Tables P1c and R1c
Prevention and Relief duties: The homelessness legislation requires local authorities to take reasonable steps to try to prevent or relieve a household’s homelessness by helping them to secure accommodation that will be available to them for at least 6 months. These duties usually last for up to 56 days each, although may be extended in some circumstances. The reasons for duties ending indicate the likely outcomes for these applicants.
Figure 5 : Proportion of households with children whose duty ended by outcome

Figure note: the categories in Figure 5 are variables collapsed from tables P1c and R1c. Homeless at the end of the duty includes those intentionally homeless for prevention duties. Other, not related to securing or not securing accommodation includes: Application withdrawn or applicant deceased, contact lost, 56 days elapsed and no further action, local referral accepted by other LA, and no longer eligible. Households where the outcome is not known are not included.
Figure 5 shows the outcomes for the 58,040 prevention duties that ended for households with children in 2022-23, and the outcomes for the 58,570 relief duties ended in the same period.
The number of prevention duties that ended for households with children increased 11.9% from 2021-22, reflecting increases in prevention duties owed. Approximately half of households with children whose prevention duty ended secured accommodation for 6 months or more and were no longer threatened with homelessness (28,990 households or 49.9%). However in 2021-22, 54.6 of prevention duties for households with children ended in accommodation secured. By comparison this represents a drop of 4.6 percentage points in the proportion of successful outcomes at the end of prevention from 2021-22 to 2022-23. Of those who secured accommodation 37.0% secured their existing accommodation in 2022-23 – this equates to 10,740 households with children, an increase of 2.1 percentage points from 2021-22
For 18,260 or 31.5% of households with children whose prevention duty ended in 2022-23, their duty ended because the household became homeless, and were therefore owed a relief duty. This is a 5.0 percentage point increase from 2021-22, and accounts for a disproportionate increase of 33.2% from 2021-22 as number of prevention duties ending for households with children had only increased by 11.9% over the same period.
There are several further reasons why a prevention duty may end that do not relate to securing accommodation for 6+ months or the household becoming homeless. 17.7% of prevention duties ended for other reasons, including losing contact, or the application being withdrawn; and 0.8% ended due to the household refusing accommodation or refusing to co-operate.
58,570 households with children had their relief duties end in 2022-23, up 23.8% from 2021-22.
The majority of households with children (34,650 households or 59.2%) had their relief duty end because their homelessness had not been relieved within 56 days and at this point the local authority would need to assess whether a main duty is owed to them. Less than a third (16,780 or 28.6%) of households with children owed a relief duty had accommodation secured for at least 6 months.
10.4% of households with children had their relief duty end for reasons not related to failing to secure or securing accommodation for at least 6 months, and 1.8% ended due to the household refusing accommodation, refusing to co-operate, or becoming intentionally homeless from accommodation provided under the duty.
4.4 Type of accommodation secured
Tables P2c and R2c
Figure 6: Proportion of households with children who secured accommodation by type

28,990 households with children whose prevention duty ended were able to secure accommodation for 6 months or more. Of these, the most common accommodation secured was self-contained accommodation in the private rented sector (47.5%).
For those whose relief duty ended, 16,780 households secured accommodation for 6 months or more. Of these, the most common accommodation secured was either self-contained accommodation in the private rented sector (30.8%) or a registered provider tenancy in the social rented sector (30.8%).
5. Single households
Single households: A term used for households without children, which will include couples and households with two or more adults.
Single adult households: Single adult households are a subset of single households, where the household comprises just one individual adult.
In 2022-23, the number of single households who were either threatened with homelessness or already homeless increased by 4.5% compared to 2021-22. 79,660 single households were owed a prevention duty in 2022-23, a 2.7% increase from 2021-22. However, 114,290 single households were owed a relief duty in 2022-23, a 5.8% increase from 2021-22.
5.1 Causes and circumstances of homelessness
Tables A2Ps, A2Rs, A4Ps, and A4Rs
Figure 7: Proportion of single households owed a prevention or relief duty, by reason for loss of last settled home

In 2022-23, the most common reason for loss of last settled home for single households was family or friends no longer able to accommodate. This accounted for 24,200 households or 30.4% of single households owed a prevention duty, which is a 1.9% increase from 2021-22. For single households owed a relief duty, this accounted for 38,840 households or 34.0%, a 9.5% increase from 2021-22, higher than the overall increase in single households owed a relief duty over the same period.
The number of single households citing the end of private rented AST increased by 23.6% to 22,990 for those owed a prevention duty, and increased by 37.1% to 12,280 for those owed a relief duty.
Most categories of reasons for homelessness or threat of homelessness had increased since 2021-22, reflecting the increases seen in households owed prevention and relief duties over this period. There were some cases were this was not the case. For prevention duties there were decreases in the number of households threatened with homelessness due to:
-
Non-violent relationship breakdown with partner, down 13.8% to 4,000 households
-
Domestic abuse, down 4.7% to 4,400 households
-
Other violence or harassment, down 9.8% to 1,380 households
-
Other reasons or not known, down 48.8% to 4,500 households
For relief duties there were decreases in the number of households who were homeless due to:
-
Non-violent relationship breakdown with partner, down 4.4%% to 9,440 households
-
Other reasons or not known, down 49.3% to 6,890 households
Figure 8: Proportion of single households owed a prevention or relief duty, by accommodation at time of application

In 2022-23, under prevention, the most common accommodation type at the time of application for single households was in the private rented sector at 27,610 households or 34.7% of single households owed a prevention duty, up 13.9% from 2021-22.
The number of single households owed a prevention duty approaching from living with family decreased by 2.9% to 21,650. For those living with friends, this figure increased by 1.6% to 9,460.
The most common accommodation type at the time of application for single households owed a relief duty was ‘living with family’. This accounted for 22.0% or 25,200 households, an increase of 12.5% for this type.
Rough sleeping: People sleeping in the open air (such as on the streets, in tents, doorways, parks, bus shelters or encampments), or other places not designed for habitation (such as stairwells, barns, sheds, car parks, cars, derelict boats, stations, or “bashes” which are makeshift shelters, often comprised of cardboard boxes). These individuals in this publication may have slept rough one night or across several nights.
Rough sleeping at the time of Local Authority Approach: This group are defined as those who were, in the judgement of the assessor, rough sleeping when they approached a local authority for help.
History of Rough Sleeping: This is a support need based on a history of sleeping rough and does not mean that the household was sleeping rough at the time of approach to the local authority.
The number of single households assessed as rough sleeping at the time of approach has increased by 30.5% since 2021-22, to 14,540 households in 2022-23. The number of households owed a prevention or relief duty approaching from no fixed abode has decreased 17.3%. As there has also been over 50% decrease in the other/not known category, we can attribute some increases in households from specific categories due to improved reporting.
5.2 Support needs
Table A3s
Figure 9: Proportion of single households owed a prevention or relief duty, by support need

Figure note: Categories in Figure 9 marked with “*” have been created using multiple related support needs. This means some households may be counted more than once in these categories.
Of the 193,950 single households owed a prevention or relief duty in 2022-23, 59.5% or 115,370 households had at least one support need, compared with 57.8% in 2021-22.
Among single households who had a support need, 41.8% had one support need, 23.7% had 2 support needs, and 34.4% had 3 or more. This is in contrast to households with children, where the majority of those with support needs, had only one support need (58.5%).
The most common support need for single households was a history of mental health problems. This equates to 62,340 households or 32.1% of single households assessed as owed a duty. The number of households with this support need has risen 7.5% since 2021-22, however this support need group continues to represent a similar proportion of all single households owed a duty.
The separate support needs dashboard shows that 78.4% of single households who had a mental health support need had one or more additional support needs. Of these, the most common co-occurring support need to history of mental health problems was physical ill health or disability, affecting 36.2% of single households with a history of mental health problems support need.
For a consecutive year, households with a former asylum seeker support need saw the largest increase from 2021-22, up 47.5% to 3,260 households in 2022-23. Despite this increase, these households only represent 1.7% of single households owed a prevention or relief duty in 2022-23.
Other substantial increases included a 23.1% increase in those with a support need for access to employment education or training (to 7,360 households), and a 22.3% increases in those with a recorded support need due to old age (to 4,660).
Only one support need saw a decrease in number of single households from 2021-22. Single households with a support need due to being a young person aged 16-17 has fallen 10.7% to 2,010 households in 2022-23.
5.3 Prevention and relief duty outcomes
Tables P1s and R1s
Figure 10: Proportion of single households whose duty ended by outcome

Figure note: the categories in Figure 10 are variables collapsed from tables P1s and R1s. Homeless at the end of the duty includes those intentionally homeless for prevention duties. Other, not related to securing or not securing accommodation includes: Application withdrawn or applicant deceased, contact lost, 56 days elapsed and no further action, local referral accepted by other LA, and no longer eligible. Households where the outcome is not known are not included.
The figure above shows the outcomes for the 72,730 prevention duties that ended for single households in 2022-23, and the outcomes for the 116,710 relief duties ended in the same period.
The number of prevention duties that ended for single households increased slightly (2.6%) from 2021-22, and in line with the small increase in prevention duties owed to single households (2.7%) over the year.
The majority of single households whose prevention duty ended (39,960 households or 54.9%) secured accommodation for 6 months or more and were no longer threatened with homelessness. Of these households, over two-thirds (68.6%) secured alternative accommodation, while the remaining 31.4% were able to remain in their exiting accommodation as a result of the prevention duty.
For 13,110 or 18.0% of single households, the prevention duty ended because the household became homeless, and was therefore owed a relief duty. There are several further reasons why a prevention duty may end that do not relate to securing accommodation for 6+ months or the household becoming homeless. 25.9% of prevention duties ended for other reasons, such as losing contact, or the application being withdrawn, and 1.2% ended due to the household refusing accommodation or refusing to co-operate.
116,710 single households had their relief duties end in 2022-23, a small increase of 2.3% from 2021-22.The most common reason for relief duties ending in 2022-23 was due to households securing accommodation for 6 months or more at 46,620 households or 39.9%. The proportion of single households securing accommodation at the end of the relief duty has dropped by 2.2 percentage points since 2021-22.
In 2022-23, 42,210 (36.2%) single households had their relief duty end because their homelessness had not been relieved within 56 days and at this point the local authority would need to assess whether a main duty is owed to them. 21.7% of households’ relief duty ended for reasons not related to failing to secure or securing accommodation for at least 6 months, and 2.2% ended due to the household refusing accommodation, refusing to co-operate, or becoming intentionally homeless from accommodation provided.
5.4 Type of accommodation secured
Tables P2s and R2s
Figure 11: Proportion of single households who secured accommodation by type

In 2022-23, 39,960 single households whose prevention duty ended were able to secure accommodation for 6 months or more, down 1.7% from 2021-22, despite the number of prevention duties ending overall showing a slight increase (2.6%).
Of these, the most common type of accommodation secured was self-contained in the private rented sector at 25.7% of single households.
Despite the number of prevention duties ending in accommodation secured decreasing, single households securing accommodation in the social rented sector overall had increased 1.5% from 2021-22 to 19,280 households. Of which, this was due to increases in single households securing a council tenancy, up 7.2%, and increases in those securing supported housing or hostel accommodation, up 3.5%.
To note, there were decreases of over 10% in the number of households securing accommodation:
-
In private rented sector houses of multiple occupation, down 16.8% to 2,320 households
-
Staying with family, down 12.8% to 3,420 households
-
Staying with friends, down 12.3% to 1,350 households
-
As an owner occupier, down 12.0% to 220 households
For single households whose relief duty ended, 46,620 households secured accommodation for 6 months or more, down 3.1% from 2021-22, reflecting the decrease in relief duties ending overall. Of these, the most common type of accommodation secured was in supported housing or hostel in the social rented sector at 36.5% of single households; this equates to 17,020 households. Despite the number of relief duties ending in secured accommodation decreasing, the number of single households securing accommodation in the social rented sector overall had increased by 8.4% to 27,480 households in 2022-23. This was due to increases in the number of households securing accommodation for all types of social rented sector accommodations, of which:
-
a 19.2% increase in households securing a council tenancy, to 4,160 households
-
a 12.9% increase in households securing a registered provider tenancy, to 6,300 households
-
a 4.5% increase in households securing supported housing or hostel accommodation to 17,020 households
There were also increases in the number of single households securing accommodation with friends, with family, or as owner occupiers compared to 2021-22.
Conversely, the number of single households securing accommodation in the private rented sector fell by 9.1% overall. This is due to decreases in the number of households securing accommodation across all of the different types of private sector accommodation, of which:
-
a 4.3% decrease in households securing self-contained private sector accommodation, to 7,320 households
-
a 16.8% decrease in those securing accommodation ins houses of multiple occupation to 4,270 households
-
a 4.9% decrease in households securing accommodation as lodgers (not with family or friends), to 390 households
There were also decreases in single households recorded as securing other types of accommodation, or those whose type of accommodation secured was not known.
6. Additional demographics
This section concerns the demographics of the lead applicant of a household and applies to all households owed a prevention or relief duty. The lead applicant is the person who makes the homeless application on behalf of the household, which can be one or more people.
6.1 Ethnicity
Table A8
Table 1: Ethnicity breakdowns for lead applicants of households owed a prevention or relief duty (number and percentage of households) in 2022-23, with comparison to population ethnicity estimates (in percentages)
| England | London | Rest of England | ||||
|---|---|---|---|---|---|---|
| Ethnicity | Owed a duty | Population % | Owed a duty | Population % | Owed a duty | Population % |
| Asian, or Asian British | 19,030 (6.4%) | 9.60% | 6,740 (11.8%) | 20.70% | 12,290 (5.1%) | 7.60% |
| Black, Black British, Caribbean or African | 30,540 (10.2%) | 4.20% | 15,990 (28.0%) | 13.50% | 14,550 (6.0%) | 2.50% |
| Mixed / Multiple ethnic groups | 9,560 (3.2%) | 3.00% | 3,450 (6.0%) | 5.70% | 6,110 (2.5%) | 2.40% |
| White | 200,410 (67.2%) | 81.00% | 17,170 (30.0%) | 53.80% | 183,240 (75.9%) | 86.10% |
| Other | 11,350 (3.8%) | 2.20% | 4,500 (7.9%) | 6.30% | 6,860 (2.8%) | 1.40% |
| Not known | 27,540 (9.2%) | - | 9,310 (16.3%) | - | 18,230 (7.6%) | - |
| Total | 298,430 (100.0%) | 100.00% | 57,150 (100.0%) | 100.00% | 241,280 (100.0%) | 100.00% |
Table note:
- Population estimates used in this release are reproduced with reference to Census 2021 data. See section 4. How ethnic composition varied across England and Wales.
- ‘Not known’ represents a high number of homelessness duties owed and could mask some of the proportions of the household ethnicities owed homelessness duties.
- Household ethnicity is set at main applicant level and the proportion of the population is calculated on an individual level. From these data it is unclear whether there is more than one person in the household and if people that identify as a particular ethnicity are more likely to live in larger households than others.
During 2022-23, 67.2% of homeless households had a White lead applicant. 81.0% of individuals in England are White according to ONS population estimates, suggesting White households are underrepresented in the those owed a homelessness duty. Households with an Asian/Asian British lead applicant are also underrepresented as they account for 6.4% of those owed a homelessness duty, and Asian/Asian British individuals account for 9.6% of the population in England. Conversely, households with a Black, Black British, Caribbean or African lead applicant are likely to be overrepresented as they account for 10.2% of those owed a homelessness duty, and Black, Black British, Caribbean or African individuals account for 4.2% of the population in England.
The population distribution of people by ethnicity across England is not even and this can complicate the homeless ethnicity picture, especially when looking at the data from London. Households in London account for 19.2% of homelessness, but the ethnicities of lead applicants in London differ in contrast to those in the rest of England (see table above).
6.2 Age
Table A6
Figure 12: Proportion of households by age of lead applicant

In 2022-23, the most common age group of lead applicants in households owed a prevention or relief duty was those aged between 25 and 34 years old, making up 88,560 households or 29.7% of the total. The number of households with a lead applicant aged 25 or over increased from 2021-22, while age groups 16-17 and 18-24 saw a decrease. The largest age groups to increase were those aged 65-74, increasing 23.3% to 9,050 households; those aged 75+, increasing 18.2% to 3,370; and those aged 55-64, increasing 15.4% to 23,480 households.
For all groups with a lead applicant aged 25 or over the absolute numbers are the highest they have been since these statistics began recording in their current form in 2018-19. For households with a lead applicant 16-17 years old, these figures have fallen 8.6% to 2,340 households since 2021-22. Households with an 18-24 year old lead applicant have been at the lowest level since 2020-21, with a 11.0% reduction in this period to 52,910 households.
The number of households where the age of the main applicant is not known, has also been declining since 2019-20, with a 87.1% decrease to 220 households in this period. This means that some increases observed in other categories will be due to improved reporting.
6.3 Employment status
Table A10
Figure 13: Proportion of households by employment status of lead applicant

The most common employment status for lead applicants of households owed a prevention or relief duty was registered unemployed, accounting for 101,020 or 33.9% of households in 2022-23, this is only a slight increase (1.3%) since 2021-22.
The second largest category was households where the lead applicant was in full time work, accounting for 42,620 or 14.3% of households. There was a similar number of households where the lead applicant is not working due to long term illness/disability, accounting for 41,240 households or 13.8% of households owed a duty.
There have been increases in households with lead applicants in all employment categories since 2021-22, with increases ranging between 1.3% and 29.6% in the period. The largest changes are for households where the main applicant is described as having an “other” employment status, up 29.6% to 23,600, and those where the lead applicant is retired, up 19.3% to 8,850 households.
The exception to these increases are households with a main applicant who is a student/in training which has fallen 3.5% since 2021-22, to 4,400.
7. Main duty
Tables MD1 and MD3
Main Duty: The ‘main’ homelessness duty describes the duty a local authority has towards an applicant who is unintentionally homeless, eligible for assistance and has priority need . These households are only owed a main duty if they did not secure accommodation in the prevention or relief stage, and so it is not owed to those ‘threatened with homelessness’. In addition a minimum of 56 days of assistance must have elapsed from a household being accepted as owed a relief duty, and being owed a main duty.
Eligibility and priority need are further defined in the technical note.
Figure 14: Number of households assessed against a main duty decision, by outcome

Local authorities made 74,290 main homelessness duty decisions in 2022-23, up 18.9% from 2021-22. Of these, 71.1% (or 52,800 households) were accepted as owed a main homelessness duty in 2022-23. This represents an increase of 3.1 percentage points compared to the proportion of main duties which were accepted in 2021-22.
In relation to other main duty decisions:
- 4.5% (3,320 households) were homeless and with priority need but considered to be intentionally homeless. This represents a decrease of 0.3 percentage points compared to the proportion in 2021-22.
- 22.9% (17,020 households) were homeless but with no priority need. This represents a decrease of 2.4 percentage points compared to the previous year.
- 1.5% (1,150 households) were found to be not homeless at main duty decision. This represents a decrease of 0.4 percentage points compared to the proportion in 2021-22.
8. Temporary accommodation
Table TA1
Temporary Accommodation: Temporary Accommodation is the term used to describe accommodation secured by a local housing authority under their statutory homelessness functions. The majority of households in temporary accommodation have been placed under the main homelessness duty, but temporary accommodation is also provided during the relief stage to households who the LA has reason to believe may have priority need, or on interim basis in other circumstances such as pending the outcome of a review on a homelessness decision.
Figure 15: Number of households in temporary accommodation since Q2 2019, by household type

On 31 March 2023, 104,510 households were in temporary accommodation, an increase of 10.0% from the same period last year.
Households with children increased by 10.3% to 64,940, while single households increased by 9.6% to 39,570.
Map 1: Households with children in temporary accommodation per 1000 households, by local authority in England

Map 2: Single households in temporary accommodation per 1000 households, by local authority in England

Map Notes: The maps above illustrate the regional differences between rates of households with children in temporary accommodation compared to single households in temporary accommodation. These show there is a higher concentration of households with children in areas such as London, Birmingham and Manchester. In contrast, the maps show that single households are more spread out across England.
8.1 Type of temporary accommodation
Figure 16: Type of accommodation for households in temporary accommodation on 31 March 2023, by region and household type

In London, households with children in temporary accommodation are most likely to be in private sector accommodation (34.2% or 13,530 households), or nightly paid self-contained accommodation (29.5% or 11,690 households). By contrast, in the rest of England, households with children in temporary accommodation are most likely to be in local authority or housing association provided accommodation (36.4% or 9,220 households).
In London, single households in temporary accommodation are most likely to be in nightly paid self-contained accommodation (33.5% or 6,860 households), or private sector accommodation (21.6% or 4,420 households). In contrast, in the rest of England, single households in temporary accommodation are most likely to be in bed and breakfast hotels (35.5% or 6,800 households), or local authority or housing association provided accommodation ( 23.7% or 4,540 households).
8.2 Length of time in temporary accommodation
Tables TA4, TA4c, and TA4s
Figure 17: Type of accommodation for households in temporary accommodation on 31 March 2023, by length of stay and household type

The most common length of time for households with children to be in temporary accommodation was 2 to 5 years, representing 17,100 or over a quarter (26.3%) of households with children. Of these households, 36.1% were in private sector accommodation and 31.2% were in local authority/housing association accommodation.
This was followed by 15,060 households with children in temporary accommodation for less than six months, representing over a fifth (23.2%) of households with children. Of these 31.7% were placed in self-contained nightly paid privately managed accommodation, and 23.8% were in local authority/housing association accommodation.
Another fifth (13,530 or 20.8%) of households with children in temporary accommodation had been there for 5 years or more. Over half (51.8%) of these were in private sector accommodation. A similar proportion of these households were also in Local authority or housing association accommodation stock (19.5%) or in Nightly paid self contained, privately managed accommodation (19.6%).
The most common length of time for households without children to stay in temporary accommodation was less than 6 months, representing 14,820 or 37.5% of single households in temporary accommodation; and of these, 41.8% were in bed and breakfast accommodation
8.3 Ethnicity of lead applicant for households in temporary accommodation
Table TA6
Figure 18: Households in temporary accommodation on 31 March 2023, by ethnicity of lead applicant

In England, the most common ethnic group for lead applicants in temporary accommodation is White, accounting for 41,610 or 39.8% of households in temporary accommodation. However, this group is underrepresented compared to the proportion of individuals in England’s population. By contrast, households in temporary accommodation where the main applicant is Black, Black British, Caribbean or African; from another ethnic group; or where ethnicity is not known are overrepresented by comparison to England’s population. More detailed information on this in the table below.
Table 2: Ethnicity breakdowns for lead applicants of households in temporary accommodation (number and percentage of households) with comparison to population ethnicity estimates (in percentages)
| England | London | Rest of England | ||||
|---|---|---|---|---|---|---|
| Ethnicity | HHs in TA | Population % | HHs in TA | Population % | HHs in TA | Population % |
| Asian, or Asian British | 9.7% | 9.6% | 10.3% | 20.7% | 8.8% | 7.6% |
| Black, Black British, Caribbean or African | 19.7% | 4.2% | 25.7% | 13.5% | 11.6% | 2.5% |
| Mixed / Multiple ethnic groups | 4.0% | 3.0% | 4.8% | 5.7% | 3.0% | 2.4% |
| White | 39.8% | 81.0% | 22.6% | 53.8% | 63.0% | 86.1% |
| Other | 6.4% | 2.2% | 7.6% | 6.3% | 4.7% | 1.4% |
| Not known | 20.4% | - | 29.0% | - | 8.8% | - |
Table note:
- HHs in TA = Households in Temporary Accommodation
- Population estimates used in this release are reproduced with reference to Census 2021 data. See section 4. How ethnic composition varied across England and Wales.
- ‘Not known’ represents a high number of homelessness duties owed and could mask some of the proportions of the household ethnicities owed homelessness duties.
- Household ethnicity is set at main applicant level and the proportion of the population is calculated on an individual level. From these data it is unclear whether there is more than one person in the household and if people that identify as a particular ethnicity are more likely to live in larger households than others.
8.4 Age of lead applicant for households in temporary accommodation
Table TA5
Figure 19: Households in temporary accommodation on 31 March 2023, by age of lead applicant

In England, the most common age for lead applicants in temporary accommodation was 35-44, accounting for 32,500 or 31.1% of households in temporary accommodation on 31st March 2023.
A further 28.0%, or 29,250 households, had a lead applicant aged 25-34; and 19.9% or 20,750 had a lead applicant aged 45-54.
Very few households in temporary accommodation (less than 5%) had lead applicants who were aged 16-17 (70 or 0.1%), 65-74 (2,140 or 2.0%), 75 and over (780 or 0.7%), or where the age of the main applicant was not known (60 or 0.1%).
Comparing households in temporary accommodation in London with those in the rest of England, households where the lead applicant was aged 35-44 were most common and accounted for a similar proportion in London (31.3%) compared to the rest of England (30.9%). However, households with lead applicants aged 45 and above represented a higher proportion of the households in temporary accommodation in London (34.3%), compared to those in the rest of England (25.9%). Conversely, households with a lead applicant aged 34 and under represented a higher proportion of the households in temporary accommodation in the rest of England (43.2%), compared to in London (34.4%).
9. Flows analysis of households owed a duty between April 2021 and March 2022
Tables F1, F2, and F3 and in the dedicated flows dashboard
This section explores the flow of households through homelessness duties and their outcomes. It concerns cases initially assessed as owed a prevention or relief duty between April 2021 and March 2022, and whose case closed or received a main duty decision as of March 2023.
The flows do not indicate the length of time taken for each case, as this varies with some lasting a day and others the full two-year period.
More information on the annual flows analysis available in the technical note.
9.1 All households homelessness flow
Table F1
There are a range of journeys and outcomes for households flowing through the homelessness duties. To ensure the flows are comprehensible, certain outcomes that are usually separate have been grouped together; for example, preventions and reliefs ending for Other reasons, and accommodation outcomes. Please see the flows tables, F1-3, for more information on how these fields have been grouped.
Overall, 249,920 households received homelessness assistance in 2021-22, up 2.8% from 2020-21. Of these households, 51.1% secured accommodation for 6+ months, 24.2% left the system for Other reasons, 17.9% were owed a main duty, and 6.8% were homeless and not owed a main duty following relief.
Figure 20: Flow of all households
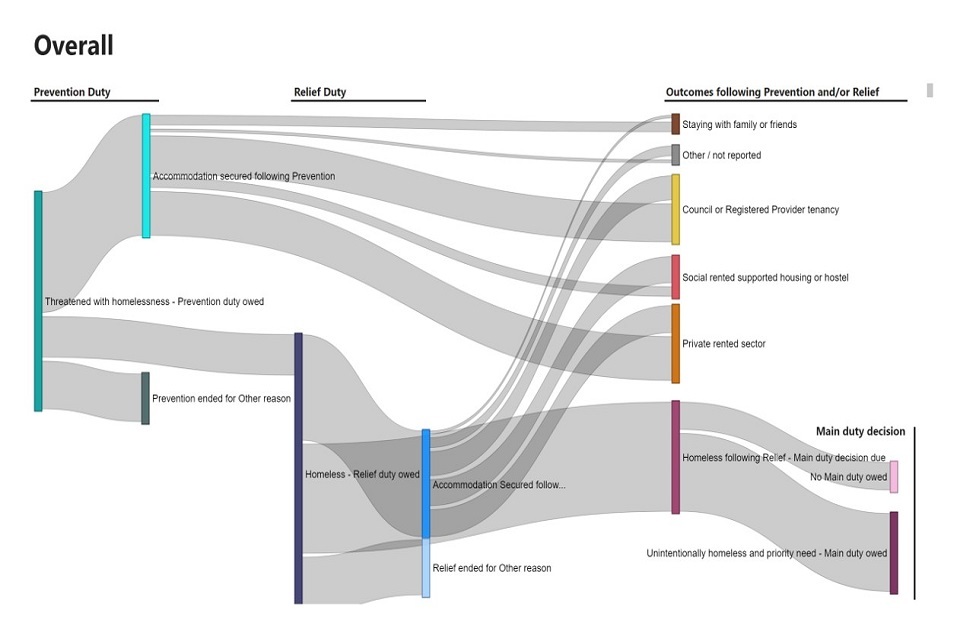
Figure note: The size of each ‘flow’ in this diagram is proportional to the number of homelessness cases taking that particular route through the system. Each coloured box indicates a stage in a homelessness duty or outcome, and their size is proportional to the number of households reaching that stage. The system has two entry points: households threatened with homelessness and owed a Prevention duty (the leftmost box), and households initially homeless and owed a Relief duty (note that this box also includes where some cases have flowed from Prevention). Succeeding diagrams are subsets, and their comparative size do not indicate a similarity in the number of households to this overall flow.
Table 3: Outcomes of the homelessness duties owed to all households first owed a prevention or relief duty in 2021-22
| Total initially owed duty | Prevention duty | Relief duty | ||||
|---|---|---|---|---|---|---|
| Households | % of total | Households | % of prevention duties | Households | % of relief duties | |
| Total assessed as owed duty | 249,920 | 100.00% | 120,360 | 100.00% | 153,930 | 100.00% |
| Total secured accommodation at duty end | 127,700 | 51.10% | 67,810 | 56.30% | 59,890 | 38.90% |
| Duty ended for Other reasons | 60,400 | 24.20% | 28,190 | 23.40% | 32,210 | 20.90% |
| Homeless at duty end | 86,200 | 34.50% | 24,370 | 20.20% | 61,830 | 40.20% |
| Homeless after relief- owed a main duty | 44,720 | 17.90% | - | - | 44,720 | 29.10% |
| Homeless after relief- not owed a main duty | 17,110 | 6.80% | - | - | 17,110 | 11.1% |
Table Note Relief duties in this table refer to all relief duties owed, including those owed after a prevention duty
On initial approach, the proportion of households who were threatened with homelessness and owed a prevention duty was lower (48.2%) compared to those already homeless and owed relief (51.8%) in 2021-22. This was also the case in 2020-21, but different from 2019-20 where households owed a prevention duty made up the majority of duties owed. The number of relief duties owed rises further when taking into account all relief duties owed during the period, including those following prevention, as shown in the table above. 24,370 prevention duties (20.2%) failed to prevent homelessness and consequently moved on to a relief duty, in addition to the 129,560 households initially owed a relief duty.
Over half of prevention duties ended with accommodation secured (56.3%), a larger proportion than relief duties ending with an accommodation secured outcome (38.9%). This is expected since the preventative interventions required to keep existing accommodation are often more straightforward than finding and securing new accommodation for an already homeless household.
Private rented sector tenancies were the most common outcomes following successful duties. This was the especially the case for prevention (38.6% of those securing accommodation) compared to relief duties (28.2%) and could be a result of many preventions involving the retention of an existing tenancy. For households securing accommodation at the end of the prevention duty, council and registered provider tenancies also represented a substantial proportion of outcomes (33.9%). For households securing accommodation at the end of relief duty, both council and registered provider tenancies (25.6%) and social rented supported housing or hostel accommodation (27.5%) were common outcomes. Supported housing or hostel accommodation secured outcomes were more likely following relief compared to prevention. This is indicative of the predominantly single adult homeless households requiring specific support or emergency accommodation more often than those threatened with homelessness. More information about these differences is provided in the single households and households with children flows sections.
Table 4: Accommodation secured for all households following prevention or relief duties owed in 2021-22, showing number of households and percentage of outcome secured by duty type
| Prevention duty | Relief duty | |||
|---|---|---|---|---|
| Private rented sector | 26,180 | 38.60% | 16,890 | 28.20% |
| Council or Registered Provider tenancy | 22,990 | 33.90% | 15,310 | 25.60% |
| Social rented supported housing or hostel | 7,490 | 11.00% | 16,490 | 27.50% |
| Staying with family or friends | 7,480 | 11.00% | 3,660 | 6.10% |
| Other / not reported | 3,680 | 5.40% | 7,550 | 12.60% |
| Total | 67,810 | 100.00% | 59,890 | 100.0% |
‘Other / not reported’ accommodation outcomes consists of where local authorities have stated ‘Other’ or have not been able to provide the specific accommodation outcome, and was reported more regularly for relief outcomes (12.6%) than prevention outcomes (5.4%). Overuse of ‘Other / not known’ as a type of accommodation secured is a data quality issue, and we are working with local authorities to improve reporting of accommodation outcomes.
60,400 prevention and relief duties ended for Other reasons, amounting to roughly one quarter of total outcomes (24.2%). These are outcomes where the household has neither secured accommodation nor been found homeless after 56 days, and includes: Contact lost, withdrawn application / applicant deceased, preventions not requiring further action after 56 days, and refusal of suitable accommodation.
Over a third of relief duties (40.2%) ended with the household still homeless and therefore due a main duty decision. Of these, 44,720 households (72.3%) were assessed as unintentionally homeless with a priority need and owed a main homelessness duty.
The remaining 17,110 (27.7%) were not owed a main duty following unsuccessful attempts to relieve the households’ homelessness after a minimum of 56 days. 13,420 households were not owed a main duty because they were homeless but had no priority need, 2,160 had priority need but were considered intentionally homeless and a further 1,540 were not owed a main duty for other reasons. Other reasons include not homeless, not eligible, contact lost and application withdrawn.
9.2 Homelessness flows for key sub-groups of households
Table F1
The flow of cases through homelessness duties can differ depending on the circumstances and composition of applicant households. This section shows how the flows compared for key sub-groups entering the system in 2021-22, these include:
-
Households with children
-
Single households
-
Households rough sleeping at the time of application
-
Households on departure from custody
-
Care leavers aged 18-20
-
Households with a member with physical ill health or disability
-
Households with a member with a learning disability
-
Households required to leave accommodation provided by the Home Office as asylum support
The households with children and single households cohorts are mutually exclusive. However, there may be overlap between other groups as they are based on current accommodation (households rough sleeping), reasons for homelessness (departure from custody, required to leave Home Office asylum support accommodation), and support needs (care leavers, physical ill health and disability, learning disability).The majority of households rough sleeping at the time of application, those on departure from custody, and care leavers aged 18-20 are made up of single households.
The F1 flows table and our flows dashboard also provides figures on additional groups (e.g. households with domestic abuse listed as their reason for loss of last settled accommodation) which are not covered in the narrative of this release.
In terms of approaches, households with children were more likely to approach at prevention (59.7%), while single households are more likely to approach at relief (58.0%). Applications of households in the other groups were also more likely at relief, rather than at prevention stage. Those rough sleeping at the time of application solely approached at relief as they are already homeless.
Households with care leavers aged 18-20 were the most likely to secure accommodation for 6 months or more at 53.9% of those who were assessed in 2021-22. This is followed by single households at 52.1%. Conversely households rough sleeping on approach (43.6%) and those on departure from custody (43.0%) were the least likely to secure accommodation through prevention or relief duties.
Of those who secured accommodation, households with children were most likely to secure accommodation in the private rented sector (41.6%) compared to other accommodation outcomes, as were single households (29.8%), and households required to leave accommodation provided as asylum support (28.7%). Those sleeping rough were most likely to secure accommodation in supported housing or hostels (46.7%), similar to those on departure from custody (48.4%) and care leavers aged 18-20 (39.8%). Finally households with a physical ill health or disability support need, and those with a learning disability support need were most likely to secure accommodation with a council or registered provider tenancy (36.1% and 29.0%).
Households with children homelessness flow
34.8% of cases initially owed duties in 2021-22 were households containing children, which is a higher proportion compared to 2020-21 (29.4%). This equates to 87,070 households with children who were initially owed a homelessness duty in in 2021-22, up 22.0% from 2020-21. This increase likely reflects the measures that were put in place to protect renters and home owners during COVID-19, which lowered the number of households with children owed a homelessness duty in 2020-21.
Of the 87,070 households with children who received homelessness assistance in 2021-22:
- 49.2% secured accommodation for 6+ months (compared to 51.1% of all households)
- 18.4% left the system for Other reasons (versus 24.2% overall)
- 30.6% were owed a main duty (versus 17.9% overall)
- 1.8% were homeless and not owed a main duty following relief (versus 6.8% overall).
Figure 21: Flow of households with children

Households with children securing accommodation at the end of prevention duty were most likely to secure accommodation in the private rented sector (46.7%). While those with successful outcomes at the relief stage were most likely to secure a council or registered provider tenancy (43.8%). This difference is in part due to private rented tenancies being easier to retain, through early intervention, than to secure new tenancies for families in the sector.
Table 5: Accommodation secured for households with children following prevention or relief duties owed in 2021-22, showing number of households and percentage of outcome secured by duty type
| Prevention duty | Relief duty | |||
|---|---|---|---|---|
| Private rented sector | 13,090 | 46.70% | 4,720 | 32.00% |
| Council or Registered Provider tenancy | 10,600 | 37.80% | 6,460 | 43.80% |
| Social rented supported housing or hostel | 850 | 3.00% | 790 | 5.40% |
| Staying with family or friends | 2,360 | 8.40% | 800 | 5.40% |
| Other / not reported | 1,160 | 4.10% | 1,990 | 13.50% |
| Total | 28,060 | 100.00% | 14,760 | 100.00% |
While successful accommodation outcomes following prevention were comparable with the overall cohort flow, prevention duties ending for Other reasons were slightly lower for households with children (18.9%) than overall (23.4%). This suggests households with children were less likely to leave the system due to losing contact or withdrawing an application than those without children. A higher proportion of households with children were homeless at the end of the prevention duty and consequently moved on to relief duties at 27.1%, compared to 20.2% overall.
57.4% of households with children who had been owed a relief duty, either initially or after an unsuccessful prevention duty, were still homeless at the end of the relief duty. This is substantially higher than 40.2% of households overall. This difference could be partly linked to the lower proportion of family households leaving the system for Other reasons. These households are also very likely to be owed a main duty, since having dependent children is a priority need. Accordingly, 94.3% of households with children that were homeless at the end of relief were assessed as unintentionally homeless and priority need and therefore owed a main homelessness duty.
1,600 households with children were homeless at the end of relief and not owed a main duty, of which 840 households were intentionally homeless. 290 households were found to have no priority need (such as when dependent children have left the household by the decision stage) and 460 households were not owed a main duty for other reasons.
Single households homelessness flow
65.2% of households owed a homelessness duty in 2021-22 did not contain children (referred to as ‘single households’). This equates to 162,840 single households initially owed a duty in 2021-22, down 5.2% from 2020-21.
Of the 162,840 single households who received homelessness assistance in 2021-22:
- 52.1% secured accommodation for 6+ months (similar to 51.1% of all households)
- 27.2% left the system for Other reasons (versus 24.2% overall)
- 11.1% were owed a main duty (versus 17.9% overall)
- 9.5% were homeless and not owed a duty following relief (versus 6.8% overall).
Single households were more likely to be already homeless on approach – 58.0% were owed initial relief duties compared to 51.8% of households overall.
Figure 22: Flow of single households
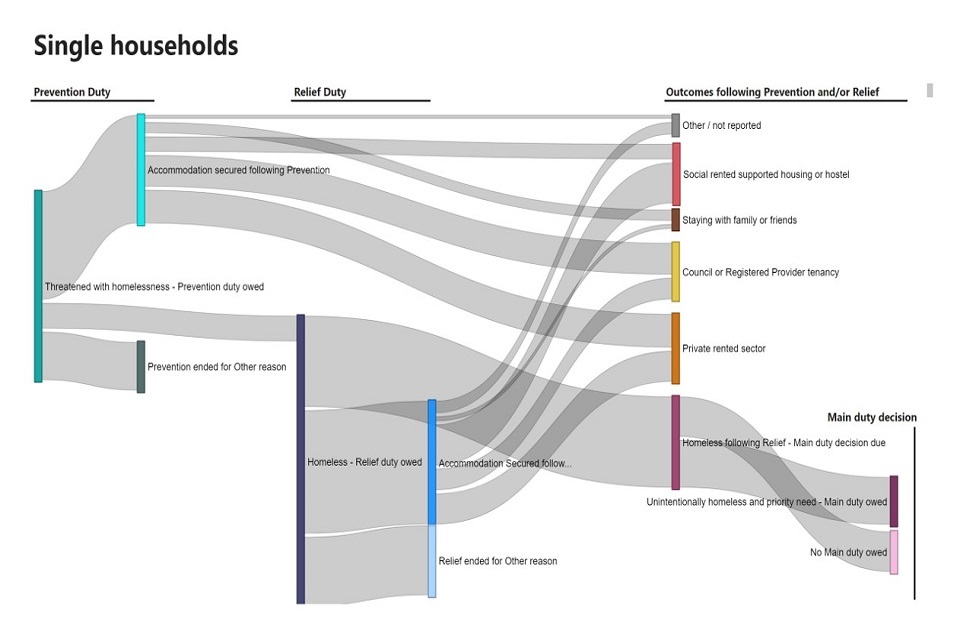
Compared to households overall, accommodation outcomes for single households were more evenly spread among the different accommodation types. Out of the 84,880 single households securing accommodation at prevention or relief duty end:
-
29.8% secured private sector accommodation (compared to 33.7% of households overall)
-
25.0% secured a council or registered provider tenancy (compared to 30.0% overall)
-
26.3% secured accommodation in social rented supported housing or hostel (compared to 18.8% overall)
-
9.4% were able to stay with family or friends (compared to 8.7% overall)
-
9.5% had an other or not reported accommodation outcome (compared to 8.8% overall)
Table 6: Accommodation secured for single households following prevention or relief duties owed in 2021-22, showing number of households and percentage of outcome secured by duty type
| Prevention duty | Relief duty | |||
|---|---|---|---|---|
| Private rented sector | 13,090 | 32.90% | 12,170 | 27.00% |
| Council or Registered Provider tenancy | 12,390 | 31.20% | 8,850 | 19.60% |
| Social rented supported housing or hostel | 6,640 | 16.70% | 15,700 | 34.80% |
| Staying with family or friends | 5,120 | 12.90% | 2,860 | 6.30% |
| Other / not reported | 2,520 | 6.30% | 5,550 | 12.30% |
| Total | 39,750 | 100.00% | 45,130 | 100.00% |
While prevention duties for single households were less likely to end with homelessness than for households overall (15.0% versus 20.2%), a correspondingly greater proportion ended for Other reasons (26.9% versus 22.0%). This was also true of relief duties, with 24.8% ending for Other reasons compared to 20.9% for households overall.
The prevalence of Other outcomes among single households suggests a relative difficulty in maintaining their applications. As can be seen in tables P1 and R1, many outcomes other than accommodation or homelessness involve contact being lost, withdrawn applications, and preventions ending with no further action.
Just under half (46.2%) of single households still homeless after relief were not owed a main duty, in contrast to the small minority of households with children (5.7%). Most households without children will not have priority need, and so will not be owed the main duty if their homelessness is not relieved. Potential priority needs for single households include; pregnancy, domestic abuse, vulnerability as a result of mental health problems, physical disability / ill health, and leaving care. More information on priority need can be found in table MD3.
Flow of households rough sleeping on approach
3.9% of households were rough sleeping at the time of application in 2021-22, a slightly lower proportion compared to 4.1% in 2020-21. The higher rate in 2020-21 reflects the additional support which was in place for people sleeping rough during the COVID-19 pandemic. Since those sleeping rough are by definition homeless, all were initially owed a relief duty.
9,730 households sleeping rough at the time of application were owed a relief duty in 2021-22, down 3.0% from 2020-21. Of these households:
-
43.6% secured accommodation for 6+ months (compared to 51.1% of all households)
-
28.6% left the system for Other reasons (versus 24.2% overall)
-
11.3% were owed a main duty (versus 17.9% overall)
-
and 16.4% were homeless and not owed a main duty following relief (versus 6.8% overall)
Figure 23: Flow of households rough sleeping on approach
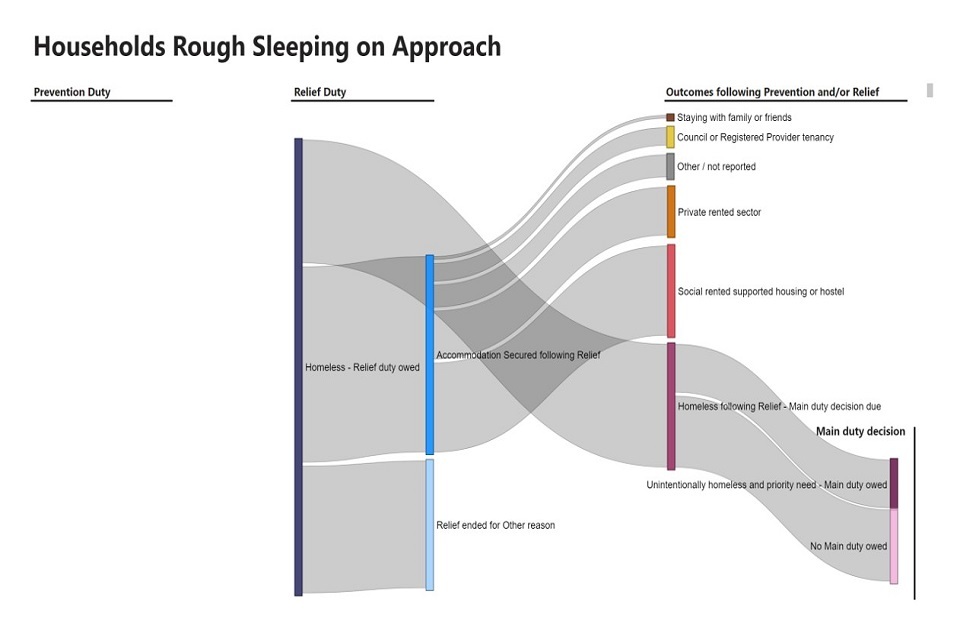
Supported housing or hostel was the most common accommodation outcome (of all 46.7% accommodation secured). Of those who were homeless at the end of relief duty, 40.7% of households who had been rough sleeping on approach, were owed a main duty.
Homelessness flows for households who were homeless, or threatened with homelessness, on departure from custody
3.1% of households were homeless, or threatened with homelessness, on departure from custody, equating to 7,830 households in 2021-22. This is a similar proportion to 2020-21 (3.2%). Of these households:
-
43.0% secured accommodation for 6+ months (compared to 51.1% of all households)
-
36.7% left the system for Other reasons (versus 24.2% overall)
-
8.6% were owed a main duty (versus 17.9% overall)
-
and 11.9% were homeless and not owed a duty following relief (versus 6.8% overall)
Over two thirds (69.9%) were homeless on initial approach and owed a relief duty, suggesting that the threat of homelessness was not identified, or referrals were not made or accepted early enough for a prevention duty to be accepted. However, this proportion is lower, compared to 2020-21 (73.3%) indicating some improvements in cases being picked up earlier while prevention is still possible. The remaining 30.1% of households departing from custody were initially owed a prevention duty in 2021-22.
Figure 24: Flow of households who were homeless, or threatened with homelessness, on departure from custody

Of those securing accommodation, the most common outcome was those securing accommodation in social rented supported housing or a hostel. This accounted for 48.1% and 48.4% of those securing accommodation at the prevention and relief stages respectively.
Of the 1,600 households on custody departure who were homeless after relief and due a main duty decision, 41.9% were owed a main duty. The remaining households who were not owed a main duty:
-
44.4% were homeless but with no priority need
-
10.6% were intentionally homeless but had a priority need
-
3.1% were not owed a main duty for other reasons
Flow of households with care leavers aged 18-20
1.3% of households owed a duty were care leavers aged 18-20, equating to 3,170 care leavers assessed as owed a duty in 2021-22. This is a similar level and proportion compared to 2020-21 and 2019-20.
Of the 3,170 18-20 care leavers households who received homelessness assistance in 2021-22:
-
53.9% secured accommodation for 6+ months (compared to 51.1% of all households)
-
23.7% left the system for Other reasons (versus 24.2% overall)
-
18.3% were owed a main duty (versus 17.9% overall)
-
4.1% were homeless and not owed a main duty following relief (versus 6.8% overall)
Figure 25: Flows of households with care leavers aged 18-20

Most care leavers aged 18-20 (61.8%) were homeless on initial approach and owed a relief duty, while the remaining 38.2% were owed a prevention duty.
Of those that secured accommodation at the prevention stage, similar proportions secured accommodation in social rented support housing or hostel (36.1%) or with a council or registered provider tenancy (33.3%). For care leavers aged 18-20 securing accommodation at the relief stage, the most common outcome was to social rented support housing or hostel (42.4%).
Of the 710 households with care leavers aged 18-20, who were homeless after relief and due a main duty decision, 81.7% were owed a main duty. The remaining households who were not owed a main duty:
-
4.2% were homeless but with no priority need
-
11.3% were intentionally homeless but had a priority need
-
2.8% were not owed a main duty for other reasons
Flow of households with a support need due to physical ill health or disability
17.3% of households owed a duty had a support need due to physical ill health or disability, equating to 43,320 households assessed as owed a duty in 2021-22.
Of the 43,320 households with a physical ill health or disability who received homelessness assistance in 2021-22:
-
50.2% secured accommodation for 6+ months (compared to 51.1% of all households)
-
22.3% left the system for Other reasons (versus 24.2% overall)
-
22.0% were owed a main duty (versus 17.9% overall)
-
5.5% were homeless and not owed a main duty following relief (versus 6.8% overall).
More of these households were homeless on initial approach and owed a relief duty (53.4%), while the remaining 46.6% were owed a prevention duty on approach.
Figure 26: Flows of households with a physical ill health or disability support need

Of those that secured accommodation, the most common outcome was securing a council or registered provider tenancy. This accounted for 41.1% of those securing accommodation at the prevention stage, and 31.1% of those securing accommodation at the relief stage.
Of the 11,920 households who were homeless after relief and due a main duty decision, 79.9% were owed a main duty. The remaining households who were not owed a main duty:
-
13.4% were homeless but with no priority need
-
5.2% were intentionally homeless but had a priority need
-
1.5% were not owed a main duty for other reasons
Flow of households with a support need due to learning disability
5.5% of households owed a duty had a support need due learning disability, equating to 13,690 households assessed as owed a duty in 2021-22.
Of the 13,690 households from this group who received homelessness assistance in 2021-22:
-
47.8% secured accommodation for 6+ months (compared to 51.1% of all households)
-
24.3% left the system for Other reasons (versus 24.2% overall)
-
21.0% were owed a main duty (versus 17.9% overall)
-
6.9% were homeless and not owed a main duty following relief (versus 6.8% overall).
More households (55.7%) were homeless on initial approach and owed a relief duty, while the remaining 44.3% were owed a prevention duty.
Figure 27: Flows of households with a learning disability support need
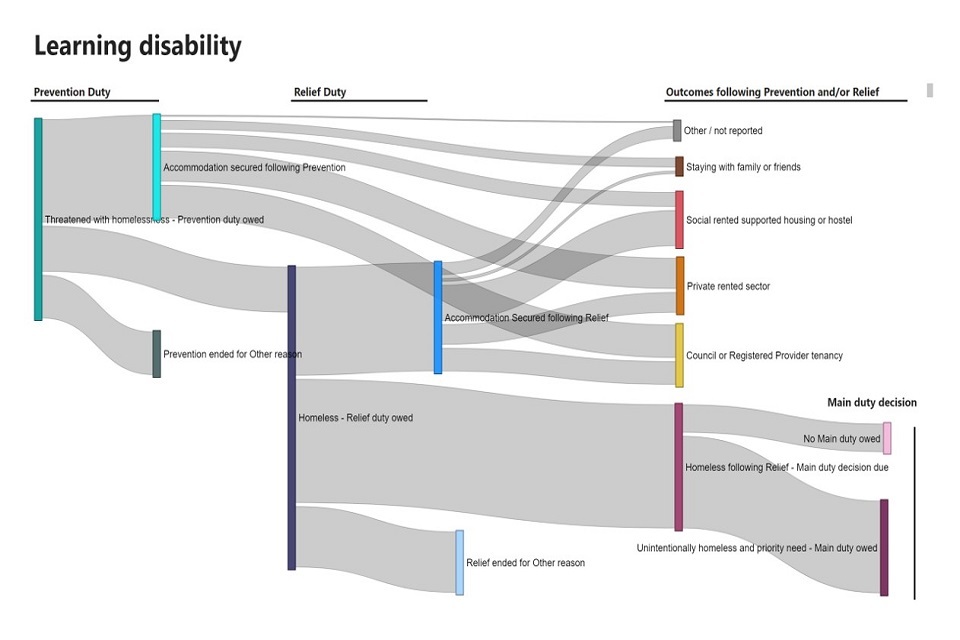
Of those that secured accommodation at the end of a prevention duty, the most common outcomes were for accommodation secured in the private rented sector (32.0%) or a council or registered provider tenancy (34.5%). In contrast, for households with a learning disability support need who secured accommodation at the end of a relief duty, the most common accommodation outcome was in social rented supported housing or hostel (35.1%).
Of the 3,810 households who were homeless after relief and due a main duty decision, 75.3% were owed a main duty. The remaining households who were not owed a main duty:
-
17.6% were homeless but with no priority need
-
5.0% were intentionally homeless but had a priority need
-
2.4% were not owed a main duty for other reasons.
Flow of households required to leave accommodation provided by the Home Office as asylum support
1.5% of households owed a duty had required to leave accommodation provided by Home Office as asylum support, equating to 3,700 households assessed as owed a duty in 2021-22.
Of the 3,700 households from this group who received homelessness assistance in 2021-22:
-
50.8% secured accommodation for 6+ months (compared to 51.1% of all households)
-
15.1% left the system for Other reasons (versus 24.2% overall)
-
27.6% were owed a main duty (versus 17.9% overall)
-
6.5% were homeless and not owed a main duty following relief (versus 6.8% overall).
More households (61.1%) were homeless on initial approach and owed a relief duty, while the remaining 38.6% were owed a prevention duty.
Figure 28: Flows of households departing from accommodation provided as asylum support
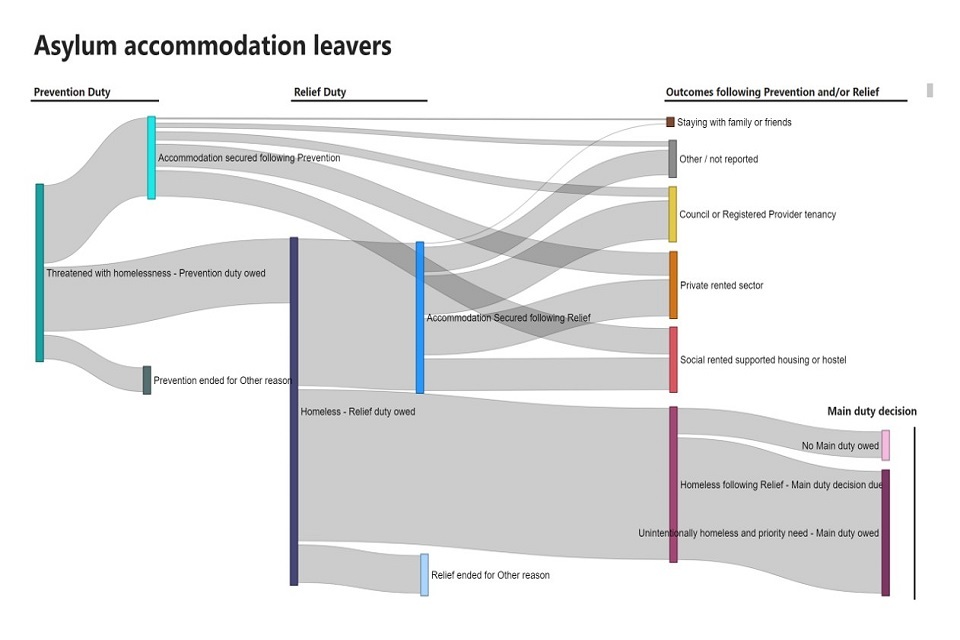
Of those that secured accommodation at the end of a prevention duty, the most common outcomes were for accommodation secured in the private rented sector (31.8%) or a council or social rented supported housing or hostel (36.4%).
In contrast, for households required to leave asylum support accommodation who secured accommodation at the end of a relief duty, the most common accommodation outcomes were for accommodation secured in the private rented sector (27.0%) or a council or registered provider tenancy (27.9%).
Of the 1,260 households who were homeless after relief and due a main duty decision, 81.0% were owed a main duty. The remaining households who were not owed a main duty:
-
18.3% were homeless but with no priority need
-
none were intentionally homeless but had a priority need
-
0.8% were not owed a main duty for other reasons.
10. Accompanying tables
Accompanying tables are available to download alongside this release. References to previously published tables are included where comparisons are possible.
Initial assessments of statutory homelessness duties owed
- A1: Number of households assessed and owed a prevention or relief duty
- A2P: Reason for loss of last settled home for households assessed as owed a prevention duty
- A2R: Reason for loss of last settled home for households assessed as owed a relief duty
- A3: Support needs of households assessed as owed a prevention or relief duty
- A4P: Accommodation at time of application for households assessed as owed a prevention duty
- A4R: Accommodation at time of application for households assessed as owed a relief duty
- A5P: Household type at time of application for households assessed as owed a prevention duty
- A5R: Household type at time of application for households assessed as owed a relief duty
- A6: Age of main applicants assessed as owed a prevention or relief duty
- A7: Households referred to a local authority prior to being assessed
- A8: Ethnicity of main applicants assessed as owed a prevention of relief duty
- A9: Nationality of main applicants assessed as owed a prevention or relief duty
- A10: Employment status of main applicants assessed as owed a prevention or relief duty
- A11: Reason for eligibility of main applicants assessed as owed a prevention or relief duty
- A12: Sexual Identity of main applicants assess as owed a prevention or relief duty
Statutory homelessness prevention duty outcomes
- P1: Reason for households’ prevention duty ending
- P2: Type of accommodation secured for households at end of prevention duty
- P3: Main prevention activity that resulted in accommodation secured for households at end of prevention duty
- P4: Destination of households with alternative accommodation secured at end of prevention duty
- P5: Household type of households with accommodation secured at end of prevention duty
Statutory homelessness relief duty outcomes
- R1: Reason for households’ relief duty ending
- R2: Type of accommodation secured for households at end of relief duty
- R3: Main prevention activity that resulted in accommodation secured for households at end of relief duty
- R4: Destination of households with alternative accommodation secured at end of relief duty
- R5: Household type of households with accommodation secured at end of relief duty
Statutory homelessness main duty decisions & outcomes
- MD1: Outcome of main duty decision for eligible households
- MD2: Outcome of households no longer owed a main duty
- MD3: Priority need category of households owed a main duty
Additional breakdowns, below, for 2022-23 can be at found at Statutory homelessness in England financial year 2022-23.
Households with children
- A2Pc: Reason for loss of last settled home for households with children assessed as owed a prevention duty
- A2Rc: Reason for loss of last settled home for households with children assessed as owed a relief duty
- A3c: Support needs of households with children assessed as owed a prevention or relief duty
- A4Pc: Accommodation at time of application for households with children assessed as owed a prevention duty
- A4Rc: Accommodation at time of application for households with children assessed as owed a relief duty
- P1c: Reason for households with children’s prevention duty ending
- P2c: Type of accommodation secured for households with children at end of prevention duty
- R1c: Reason for households with children’s relief duty ending
- R2c: Type of accommodation secured for households with children at end of relief duty
Single households
- A2Ps: Reason for loss of last settled home for single households assessed as owed a prevention duty
- A2Rs: Reason for loss of last settled home for single households assessed as owed a relief duty
- A3s: Support needs of single households assessed as owed a prevention or relief duty
- A4Ps: Accommodation at time of application for single households assessed as owed a prevention duty
- A4Rs: Accommodation at time of application for single households assessed as owed a relief duty
- P1s: Reason for single households’ prevention duty ending
- P2s: Type of accommodation secured for single households at end of prevention duty
- R1s: Reason for single households’ relief duty ending
- R2s: Type of accommodation secured for single households at end of relief duty
Additional temporary accommodation breakdowns
- TA4: Number of households in temporary accommodation at end of quarter, by length of time
- TA4c: Number of households with children in temporary accommodation at end of quarter, by length of time
- TA4s: Number of single households in temporary accommodation at end of quarter, by length of time
- TA5: Number of households in temporary accommodation at end of quarter, by age of lead applicant
- TA6: Number of households in temporary accommodation at end of quarter, by ethnicity of lead applicant
11. About our statistics
11.1 Technical information
Further details on H-CLIC, imputation, suppression, response rate, temporary accommodation data, and outputs in included with this annual release are available in the dedicated technical note. Further technical information related to our statistics, including information on changes to methodology are included in the relevant quarterly release pages and the respective technical notes.
11.2 Statistics labelling
These statistics are have been labelled Accredited Official Statistics. See information on Accredited Official Statistics is available via the UK Statistics Authority website.
These accredited official statistics were independently reviewed by the Office for Statistics Regulation in October 2023. They comply with the standards of trustworthiness, quality and value in the Code of Practice for Statistics and should be labelled ‘accredited official statistics’
Please note that Accredited official statistics are called National Statistics in the Statistics and Registration Service Act 2007.
More information on the UK statistical system is available via the UK Statistics Authority website.
Information about statistics at DLUHC is available via the Department’s website.