State-funded schools inspections and outcomes as at 31 August 2021: main findings
Published 25 November 2021
Applies to England

© Crown copyright 2021
This publication is licensed under the terms of the Open Government Licence v3.0 except where otherwise stated. To view this licence, visit nationalarchives.gov.uk/doc/open-government-licence/version/3 or write to the Information Policy Team, The National Archives, Kew, London TW9 4DU, or email: psi@nationalarchives.gov.uk.
Where we have identified any third party copyright information you will need to obtain permission from the copyright holders concerned.
This publication is available at https://www.gov.uk/government/statistics/state-funded-schools-inspections-and-outcomes-as-at-31-august-2021/state-funded-schools-inspections-and-outcomes-as-at-31-august-2021-main-findings
This is the main findings report for the state-funded schools and inspections and outcomes as at 31 August 2021 release. The following are also available:
- underlying data
- methodology
- pre-release access list
Summary
This release includes:
- schools’ most recent inspections and outcomes as at 31 August 2021
- revised data for inspections completed between 1 September 2020 and 31 March 2021
- data for inspections completed between 1 September 2020 and 31 August 2021 and published by 30 September 2021
Impact of the coronavirus (COVID-19) pandemic on this release
On 17 March 2020, section 5(1) of the Education Act 2005 was disapplied under the Coronavirus Act 2020. As a result, routine inspections of schools were suspended and did not resume until the summer term of 2021. We did, however, carry out some non-routine inspections of schools under section 8 of the Education Act 2005. These included additional monitoring visits to schools judged less than good in the spring term 2021.
Numbers of schools and inspections
Figure 1: State-funded schools and inspections, 1 September 2020 to 31 August 2021
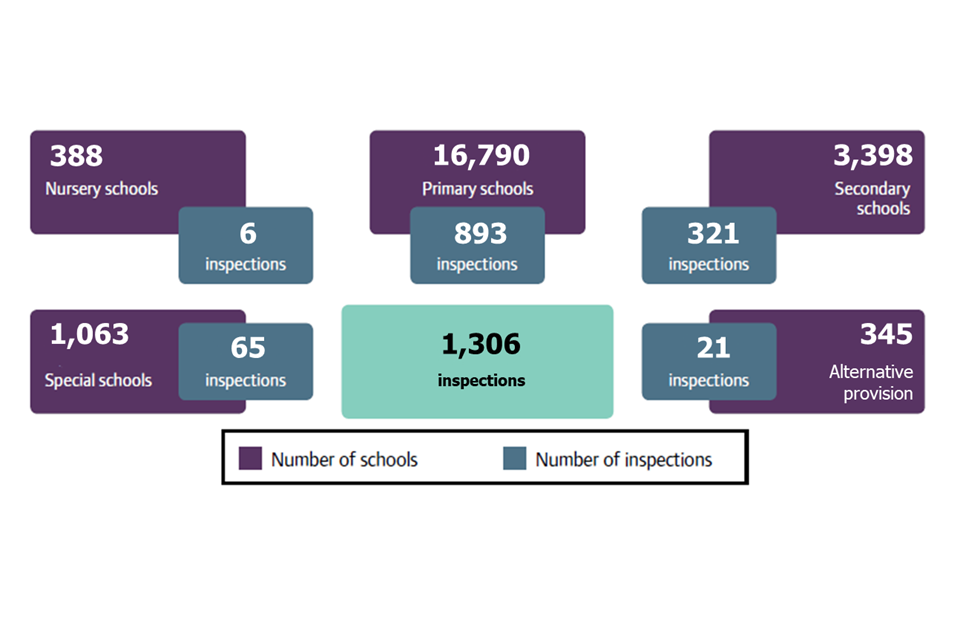
1. Number of schools open on 31 August 2021.
2. Includes section 5 inspections, section 8 inspections of good and outstanding schools, monitoring inspections and ‘no formal designation’ inspections.
3. Includes inspections carried out between 1 September 2020 and 31 August 2021 that had a report published by 30 September 2021.
4. Alternative provision includes academy alternative provision, free school alternative provision and pupil referral units.
View data in an accessible table format.
There are currently nearly 22,000 state-funded schools. Forty-four per cent of schools are now academies and free schools, compared with 41% last year. This year, we carried out 1,306 inspections.
Schools at their most recent inspection
Eighty-six per cent of all schools are good or outstanding. This is unchanged since August 2020. This is to be expected as we did not resume full inspections until the summer term 2021, when we did a relatively small number. Schools can only gain or change their grade at a full section 5 inspection, of which there were 84 between April and July 2021.
Figure 2: Overall effectiveness of state-funded schools at their most recent inspection, by phase
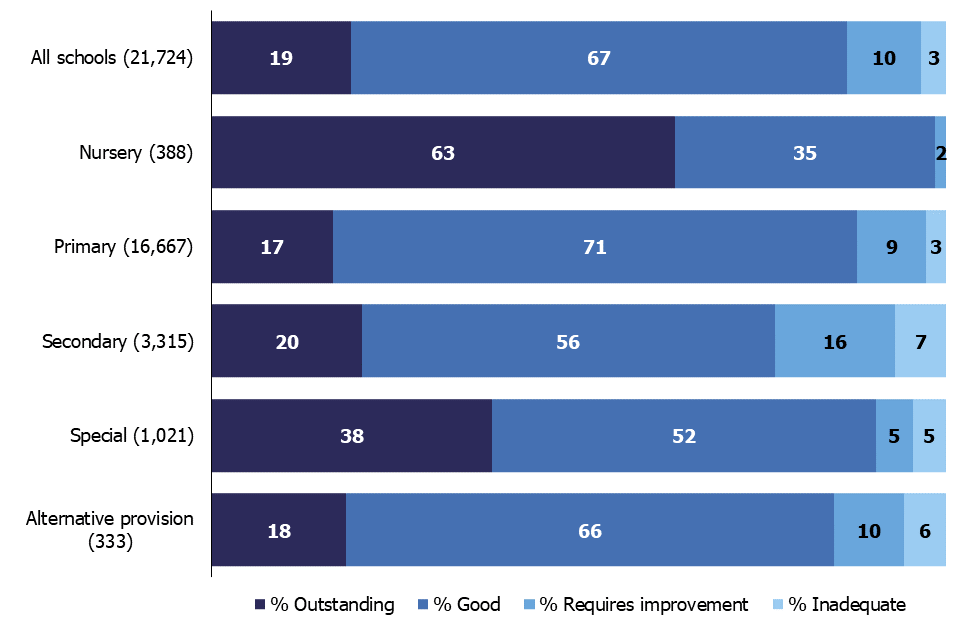
1. Alternative provision includes academy alternative provision, free school alternative provision and pupil referral units.
View data in an accessible table format.
The proportion of secondary schools that we judged good or outstanding increased to 77% from 76% last year. The proportion judged good or outstanding in all other phases remained the same compared with last year: 88% of primary schools, 98% of nursery schools, 90% of special schools and 85% of alternative provision.
Inspections between 1 September 2020 and 31 August 2021
This has not been a typical year for school inspections due to the impact of the COVID-19 pandemic. We have carried out fewer inspections than usual, and we only resumed section 5 inspections during the summer term (from April 2021).
In this academic year, we have carried out:
- 84 section 5 inspections. This includes section 8 inspections of good and outstanding schools and monitoring inspections that converted to section 5 inspections
- 162 section 8 inspections of good and outstanding schools that did not convert to a section 5 inspection
- 1,060 section 8 monitoring inspections and ‘no formal designation’ inspections
Figure 3: Overall effectiveness of schools, by academic year (section 5 inspections only)
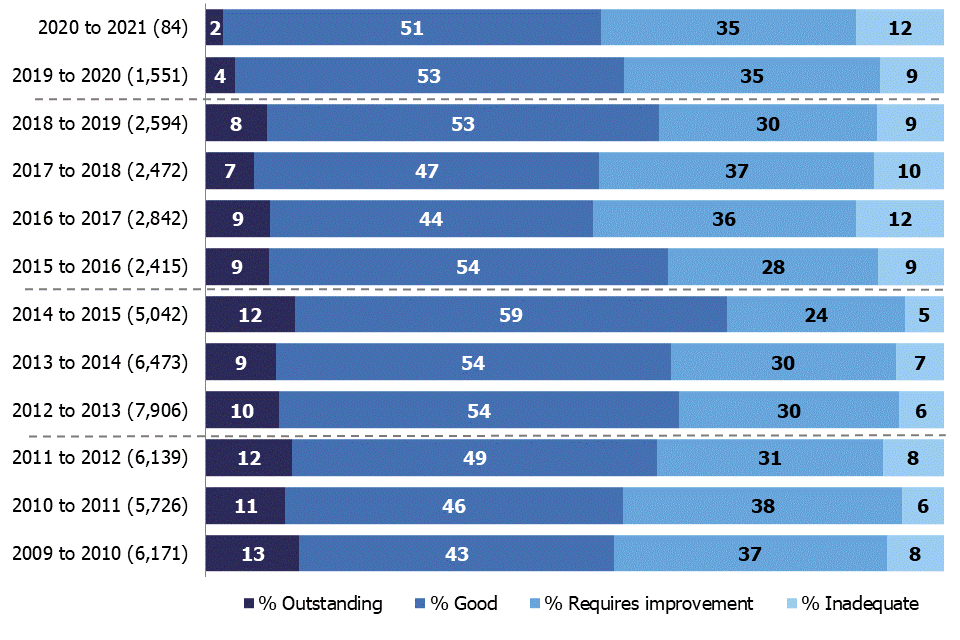
1. Dotted lines on the chart indicate a change to the inspection framework in January and September 2012, September 2015 and September 2019.
View data in an accessible table format.
We also carried out 1,281 interim visits during the autumn term 2020. These were research visits to look at the impact of the pandemic on schools and children. These visits are not included in our official statistics publications; see our published transparency data for more details about these visits.
We carried out only section 8 monitoring inspections and section 8 ‘no formal designation’ inspections during the spring term. See our spring official statistics publication for more details about these inspections. We carried out monitoring inspections to determine whether schools were taking effective action to provide education during the COVID-19 pandemic. This included evaluating remote education provided by the school, and checking whether on-site provision was available for vulnerable children and children of key workers.
Figure 4: Overall effectiveness of schools, by phase, including outcomes for section 8 inspections that did not convert, 1 September 2020 to 31 August 2021
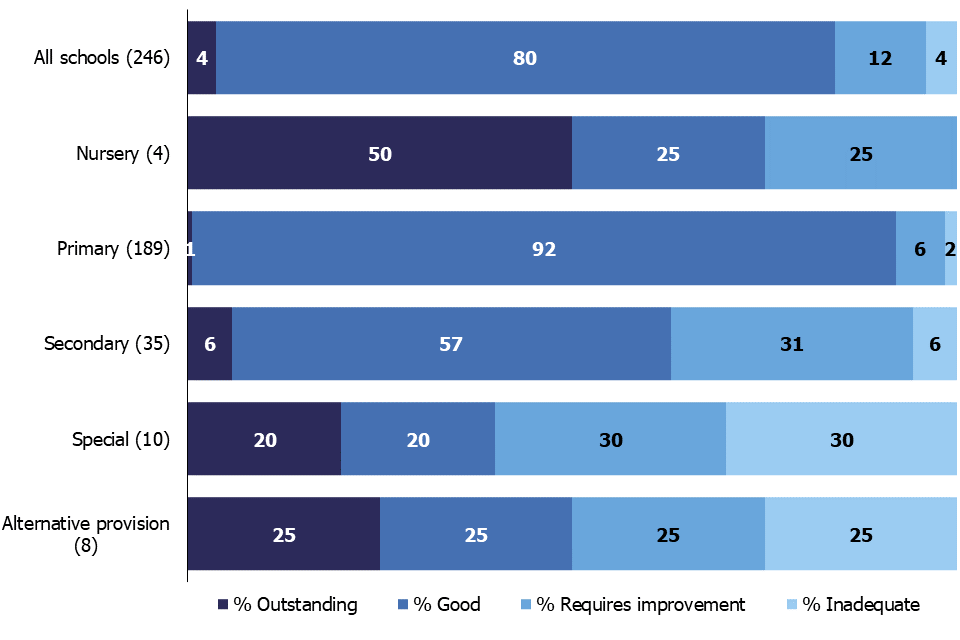
1. Alternative provision includes academy alternative provision, free school alternative provision and pupil referral units.
View data in an accessible table format.
This year, we carried out 84 section 5 inspections and 162 section 8 inspections of good and outstanding schools that did not convert to a section 5 inspection. Of these, we judged that 207 (84%) of schools were good or outstanding. Over three quarters were inspections of primary schools and, of these, we judged that 174 (92%) were good or outstanding.
Figure 5: The balance between the numbers of schools becoming good or outstanding and the numbers becoming requires improvement or inadequate
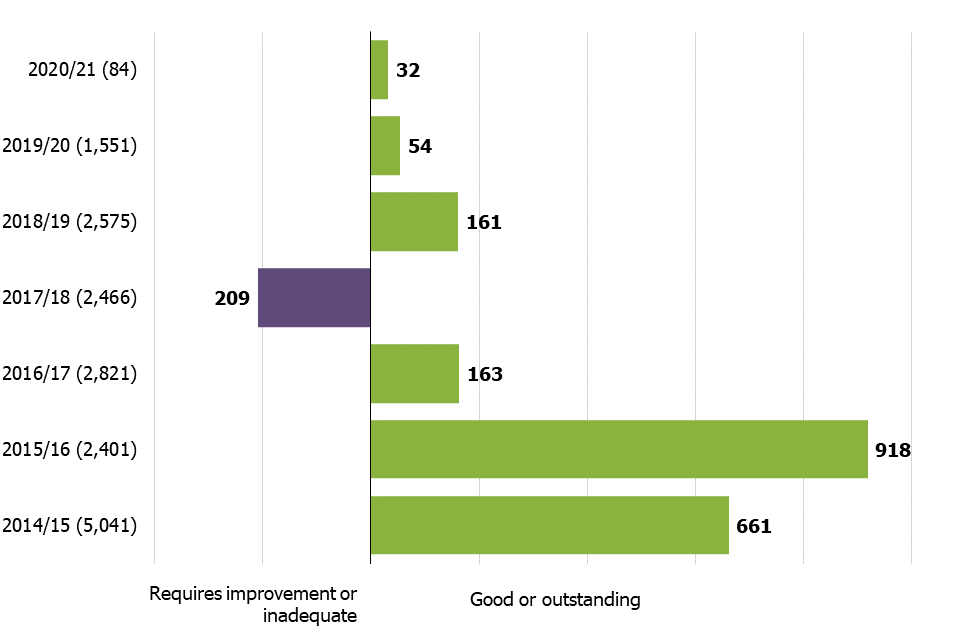
View data in an accessible table format.
Of the 84 section 5 inspections that we carried out this year, there were 32 more schools that improved to good or outstanding than schools that declined to requires improvement or inadequate. Forty-three schools previously judged to require improvement or be inadequate improved to good or outstanding, while 11 previously good or outstanding schools declined to requires improvement or inadequate.
During the 2017 to 2018 academic year, changes in the volumes and outcomes of inspections of schools that were previously outstanding, or that required improvement, contributed to more schools seeing a decline than improving their grade.
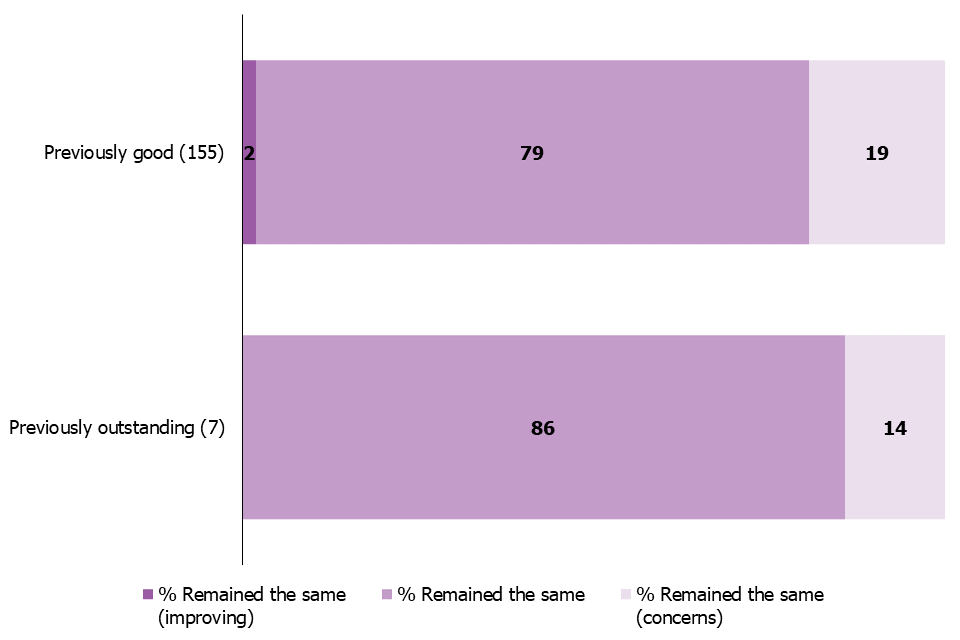
Section 8 inspections of good and outstanding schools
This year, we carried out 162 section 8 inspections of good and outstanding schools that did not convert to a section 5 inspection. Of the 7 previously outstanding schools, we judged that 6 remained outstanding and 1 was outstanding with concerns. Of the previously good schools, we judged that 122 (79%) remained good, 30 (19%) were good with concerns and 3 (2%) were good and improving.
Figure 6: Outcomes of section 8 inspections of previously good and outstanding schools, by most recent overall effectiveness judgement, 1 September 2020 to 31 August 2021
View data in an accessible table format.
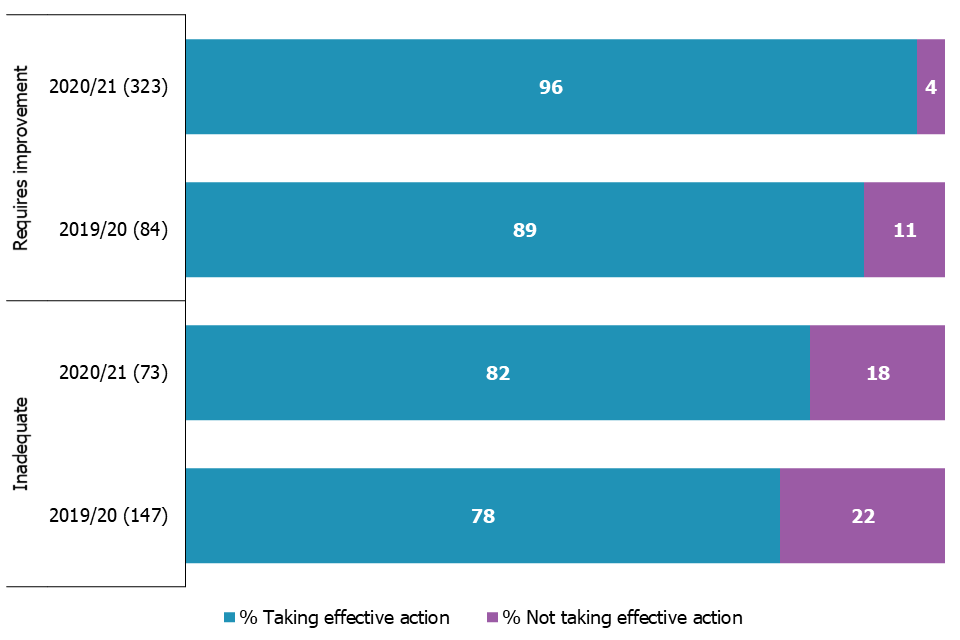
Section 8 monitoring inspections
We resumed our normal monitoring inspections of schools that require improvement or are inadequate from the summer term of 2021. The purpose of these monitoring inspections is to judge whether schools are taking effective action towards an improved judgement at their next graded inspection.
We carried out 396 monitoring inspections between May and July 2021. Of these, 323 were of schools previously judged to require improvement. We judged that 311 (96%) of these schools were taking effective action in order to become a good school, compared with 89% last year. We judged 60 (82%) of inadequate schools to be taking effective action towards the removal of their category of concern, compared with 78% last year.
Figure 7: Outcomes of monitoring inspections, by most recent overall effectiveness judgement, 1 September 2019 to 31 August 2020 and 1 September 2020 to 31 August 2021
View data in an accessible table format.
Revisions to previous release
There have been no revisions to the previous release relating to inspections that took place between 1 September 2020 and 31 March 2021 as we did not carry out any section 5 inspections in this period. This was due to the suspension of routine inspections as a result of the COVID-19 pandemic.
Notes
The purpose of these official statistics is to disseminate the data on school standards collected through Ofsted’s role as an inspectorate. They provide information about how the judgements of schools have changed over time. They vary across different phases of education and different parts of the country.
This official statistics release reports on the outcomes of state-funded school inspections carried out under sections 5 or 8 of the Education Act 2005. We carried out these inspections between 1 September 2020 and 31 August 2021. This release includes all inspections published by 30 September 2021. This release also includes the most recent inspections and outcomes for all schools that we have inspected, as at 31 August 2021.
Throughout this release, we use the term ‘schools’ to cover all local authority maintained schools, state-funded academies and non-maintained special schools in England that section 5 of the Education Act 2005 requires us to inspect.
We carried out inspections between September 2015 and August 2019 under the common inspection framework.
Since September 2019, we carry out inspections under the EIF.
You can find an explanation of the main uses of this data, further contextual information and the arrangements for quality assurance in the methodology report. This report provides information about strengths and limitations of the statistics.
Where we have quoted percentages in this report, figures have been rounded and may not add to 100.
Section 5 and section 8
Ofsted carries out inspections under sections 5 and 8 of the Education Act 2005.
We are required to inspect at prescribed intervals all schools to which section 5 applies. The regulations set the interval for section 5 inspections ‘within 5 school years from the end of the school year in which the last inspection took place’.
Section 8 enables Her Majesty’s Chief Inspector (HMCI) to carry out inspections for a range of purposes. This includes monitoring visits by Her Majesty’s Inspectors (HMI) to schools that are in a category of concern following a section 5 inspection. HMI may also visit schools to aid HMCI in keeping the Secretary of State informed or to contribute to reports on, for example, the teaching in a curriculum subject or a particular aspect of the work of schools.
Inspections carried out under section 8 include:
- section 8 inspections of schools judged to be good or outstanding at their most recent section 5 inspection
- monitoring inspections of schools judged as requires improvement, having serious weaknesses or requiring special measures
- any inspection carried out in other circumstances if the inspection has no specific designation
- unannounced behaviour inspections
Section 8 inspections of schools judged to be good or outstanding at their most recent section 5 inspection
These section 8 inspections are usually a 2-day inspection, except for in the case of some small primary schools that may receive a 1-day inspection. These take place approximately every 4 years. The section 8 inspection determines whether the school continues to provide the same good or outstanding standard of education for pupils. The inspection does not result in individual graded judgements. It also does not change the overall effectiveness grade of the school. If there are serious concerns, we convert the section 8 inspection to a section 5 inspection, where inspectors will make the full set of graded judgements.
Since November 2017, some previously good schools are subject to a section 5 inspection instead of a section 8 inspection if our risk assessment tells us that a section 8 inspection would be highly likely to convert. For example, this applies if a school underwent significant change, such as changing its age range, or if we have concerns that the quality of provision may have deteriorated significantly.
Since January 2018, section 8 inspections are only converted to a section 5 inspection if there are serious concerns. If a section 8 inspection does not convert, there are additional outcomes if the school remains either good or outstanding, but the next inspection will be a section 5 inspection.
Between May 2012 and November 2020, outstanding primary and secondary schools were exempt from routine inspection. In November 2020, Parliament lifted its exemption. The school inspection handbook provides further details around inspection of formerly exempt outstanding schools.
Due to the impact of the COVID-19 pandemic, routine inspections of schools did not resume until the summer term of 2021.
Glossary
Definitions of terms are within the statistical glossary.
Further information
Contacts
If you are a member of the public and have any comments or feedback on this publication, contact Louise Butler on 03000 131 457 or the schools data and analysis team on inspectioninsight@ofsted.gov.uk.
Press enquiries should be sent to our press team on pressenquiries@ofsted.gov.uk.
Acknowledgements
Thanks to the following for their contribution to this statistical release: Joel Armstrong, Mike Barker, Mundeep Gill, James Jordan, Clair Simpson, Matthew Spencer.
Annex: data tables for figures
This section contains the underlying data in an accessible table format for all figures.
Data for Figure 1: State-funded schools and inspections, 1 September 2020 to 31 August 2021
| Phase | Number of schools | Number of inspections |
|---|---|---|
| Nursery | 388 | 6 |
| Primary | 16790 | 893 |
| Secondary | 3398 | 321 |
| Special | 1063 | 65 |
| Alternative provision | 345 | 21 |
| All schools | 21984 | 1306 |
See Figure 1.
Data for Figure 2: Overall effectiveness of state-funded schools at their most recent inspection, by phase
| Phase | % Outstanding | % Good | % Requires improvement | % Inadequate |
|---|---|---|---|---|
| Alternative provision (333) | 18 | 66 | 10 | 6 |
| Special (1,021) | 38 | 52 | 5 | 5 |
| Secondary (3,315) | 20 | 56 | 16 | 7 |
| Primary (16,667) | 17 | 71 | 9 | 3 |
| Nursery (388) | 63 | 35 | 2 | 0 |
| All schools (21,724) | 19 | 67 | 10 | 3 |
See Figure 2.
Data for Figure 3: Overall effectiveness of schools, by academic year (section 5 inspections only)
| Academic year | % Outstanding | % Good | % Requires improvement | % Inadequate |
|---|---|---|---|---|
| 2009 to 2010 (6,171) | 13 | 43 | 37 | 8 |
| 2010 to 2011 (5,726) | 11 | 46 | 38 | 6 |
| 2011 to 2012 (6,139) | 12 | 49 | 31 | 8 |
| 2012 to 2013 (7,906) | 10 | 54 | 30 | 6 |
| 2013 to 2014 (6,473) | 9 | 54 | 30 | 7 |
| 2014 to 2015 (5,042) | 12 | 59 | 24 | 5 |
| 2015 to 2016 (2,415) | 9 | 54 | 28 | 9 |
| 2016 to 2017 (2,842) | 9 | 44 | 36 | 12 |
| 2017 to 2018 (2,472) | 7 | 47 | 37 | 10 |
| 2018 to 2019 (2,594) | 8 | 53 | 30 | 9 |
| 2019 to 2020 (1,551) | 4 | 53 | 35 | 9 |
| 2020 to 2021 (84) | 2 | 51 | 35 | 12 |
See Figure 3.
Data for Figure 4: Overall effectiveness of schools, by phase, including outcomes for section 8 inspections that did not convert, 1 September 2020 to 31 August 2021
| Phase of education | % Outstanding | % Good | % Requires improvement | % Inadequate |
|---|---|---|---|---|
| Alternative provision (8) | 25 | 25 | 25 | 25 |
| Special (10) | 20 | 20 | 30 | 30 |
| Secondary (35) | 6 | 57 | 31 | 6 |
| Primary (189) | 1 | 92 | 6 | 2 |
| Nursery (4) | 50 | 25 | 25 | 0 |
| All schools (246) | 4 | 80 | 12 | 4 |
See Figure 4.
Data for Figure 5: The balance between the numbers of schools becoming good or outstanding and the numbers becoming requires improvement or inadequate
| Academic year | Balance |
|---|---|
| 2014 to 2015 (5,041) | 661 |
| 2015 to 2016 (2,401) | 918 |
| 2016 to 2017 (2,821) | 163 |
| 2017 to 2018 (2,466) | -209 |
| 2018 to 2019 (2,575) | 161 |
| 2019 to 2020 (1,551) | 54 |
| 2020 to 2021 (84) | 32 |
See Figure 5.
Data for Figure 6: Outcomes of section 8 inspections of previously good and outstanding schools, by most recent overall effectiveness judgement, 1 September 2020 to 31 August 2021
| Overall effectiveness | % Remained the same (improving) | % Remained the same | % Remained the same (concerns) |
|---|---|---|---|
| Previously outstanding (7) | 0 | 86 | 14 |
| Previously good (155) | 2 | 79 | 19 |
See Figure 6.
Data for Figure 7: Outcomes of monitoring inspections, by most recent overall effectiveness judgement, 1 September 2019 to 31 August 2020 and 1 September 2020 to 31 August 2021
| Overall effectiveness | Academic year | % Taking effective action | % Not taking effective action |
|---|---|---|---|
| Inadequate | 2019 to 2020 (147) | 78 | 22 |
| Inadequate | 2020 to 2021 (73) | 82 | 18 |
| Requires improvement | 2019 to 2020 (84) | 89 | 11 |
| Requires improvement | 2020 to 2021 (323) | 96 | 4 |
See Figure 7.