State-funded schools inspections and outcomes as at 31 August 2020
Published 29 October 2020
Applies to England

© Crown copyright 2020
This publication is licensed under the terms of the Open Government Licence v3.0 except where otherwise stated. To view this licence, visit nationalarchives.gov.uk/doc/open-government-licence/version/3 or write to the Information Policy Team, The National Archives, Kew, London TW9 4DU, or email: psi@nationalarchives.gov.uk.
Where we have identified any third party copyright information you will need to obtain permission from the copyright holders concerned.
This publication is available at https://www.gov.uk/government/statistics/state-funded-schools-inspections-and-outcomes-as-at-31-august-2020/state-funded-schools-inspections-and-outcomes-as-at-31-august-2020
This is the main findings report for the state-funded schools and inspections and outcomes as at 31 August 2020 release. The following are also available:
- underlying data
- methodology
- pre-release access list
Summary
This release includes:
- schools’ most recent inspections and outcomes as at 31 August 2020
- revised data for inspections completed between 1 September 2019 and 31 March 2020
- data for inspections completed between 1 September 2019 and 31 August 2020 and published by 31 August 2020
Impact of coronavirus (COVID-19) on this release
All routine inspections and the publication of most inspection reports were suspended in March 2020 due to COVID-19. We started to publish inspection reports again from May and all those published by 31 August 2020 are included in this release.
Introduction
Eighty-eight per cent of all primary schools are good or outstanding, compared with 76% of secondary schools.
This year, 77% of schools have been judged good or outstanding for overall effectiveness, a small decrease from 80% last year.
This year, 56% of schools inspected improved from requires improvement to good or outstanding, compared with 64% last year.
Numbers of schools and inspections
Figure 1: State-funded schools and inspections in 2019/20
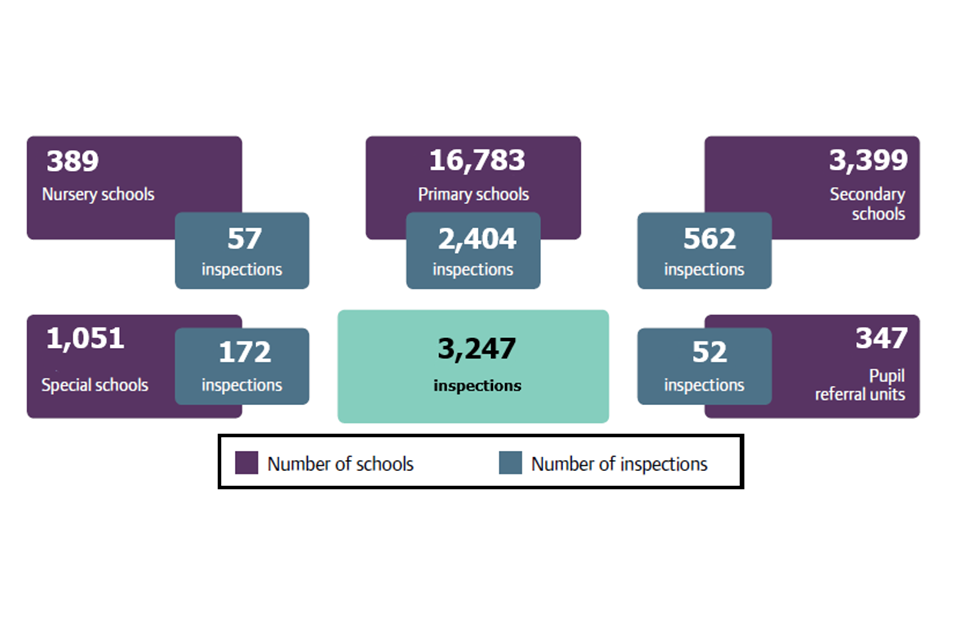
1. Number of schools open on 31 August 2020.
2. Includes section 5 inspections, section 8 inspections of good and non-exempt outstanding schools, monitoring visits, no formal designation visits and exempt school inspections.
3. Includes inspections carried out between 1 September 2019 and 31 August 2020 that had a report published by 31 August 2020.
Download a zip file with the underlying data in csv format.
There are currently nearly 22,000 state-funded schools. Forty-one per cent of schools are now academies and free schools. This year we carried out 3,247 inspections.
Schools at their most recent inspection
Eighty-eight per cent of all primary schools are good or outstanding, compared with 76% of secondary schools.
Eighty-six per cent of all schools are good or outstanding. The percentage of schools judged good or outstanding has remained the same since August 2018 but is a substantial increase from 68% in 2010. Since August 2018, the percentage of schools judged outstanding has declined from 21% to 19%, while the percentage of schools judged good has increased from 65% to 67%. This is probably caused by fewer previously good and previously non-exempt outstanding schools becoming or remaining outstanding at their inspections this year than in previous years.
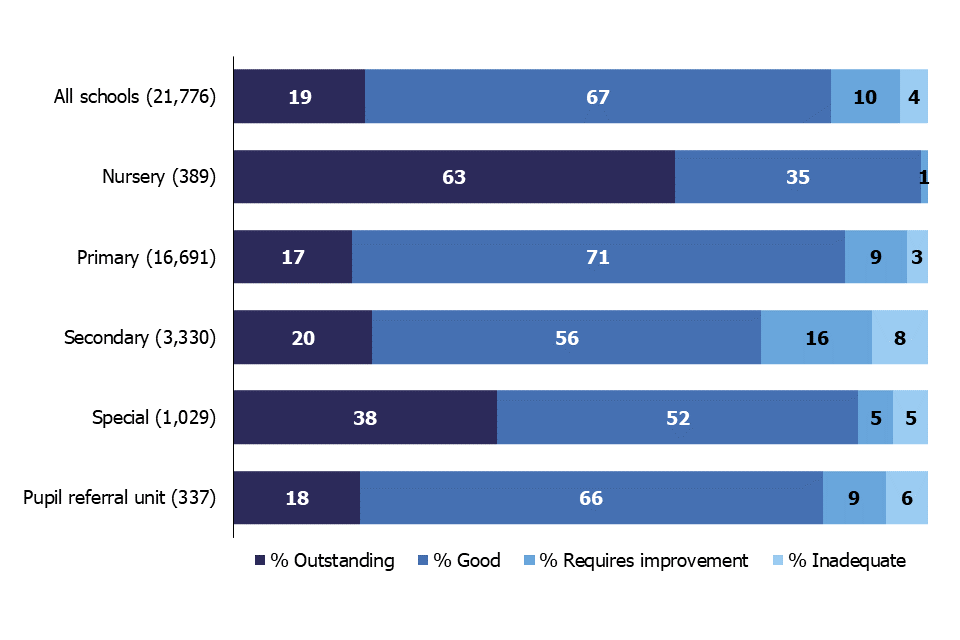
Figure 2: Overall effectiveness of state-funded schools at their most recent inspection, by phase
Download a zip file with the underlying data in csv format.
More primary schools are good or outstanding than secondary schools: 88% compared with 76%. This is an increase of 1 percentage point for primary schools compared with last year, while the figure for secondary schools remains unchanged. Additionally, 98% of nursery schools (no change from August 2019), 90% of special schools (compared with 92% last year) and 85% of pupil referral units (compared with 83% last year) are good or outstanding.
Inspections between 1 September 2019 and 31 August 2020
In this academic year, we have carried out:
- 1,551 section 5 inspections. This includes section 8 inspections of good and non-exempt outstanding schools and monitoring inspections that became section 5 inspections
- 1,344 section 8 inspections of good and non-exempt outstanding schools that did not convert to a section 5 inspection
- 352 section 8 monitoring inspections, no formal designation inspections and exempt school inspections
Figure 3: Overall effectiveness of state-funded schools in 2018/19 and 2019/20, by phase
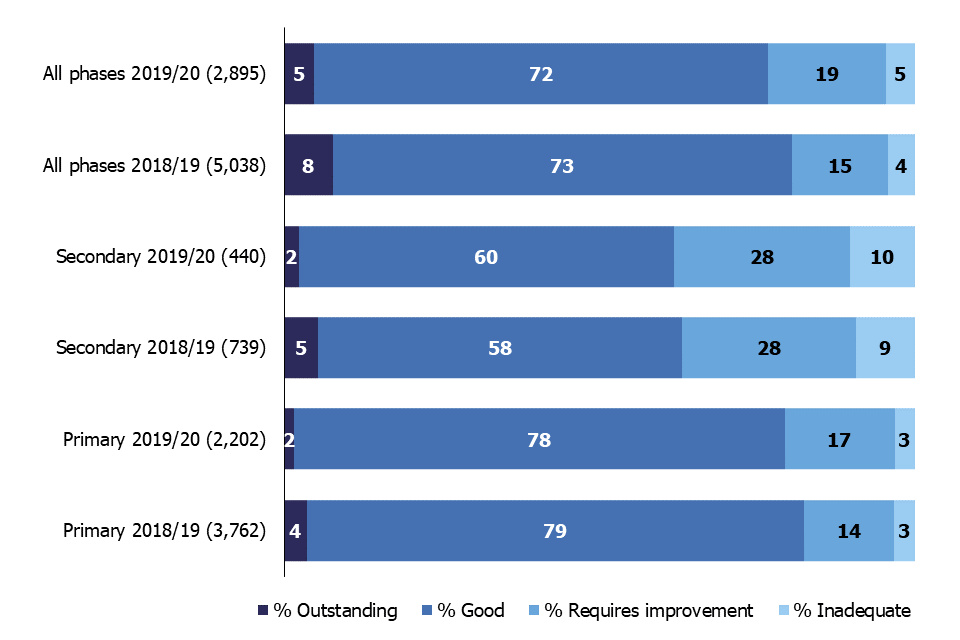
This includes section 5 inspections and section 8 inspections of good and non-exempt outstanding schools. Download a zip file with the underlying data in csv format.
In September 2019, we began inspections under the education inspection framework (EIF). Between September 2019 and March 2020, we carried out 3,247 inspections. This included 2,895 section 5 inspections and section 8 inspections of good and non-exempt outstanding schools. This was fewer inspections than in a normal year; for instance, last year we carried out 5,558 inspections. This decrease is because schools closed in March 2020 due to the impact of COVID-19 and inspections were paused.
This year, 77% of schools have been judged good or outstanding for overall effectiveness, a small decrease from 80% last year. The percentage judged outstanding has decreased by 3 percentage points compared with last year, while the percentage judged good decreased by 1 percentage point. However, inspections in any single year are not representative of all schools because we inspect weaker schools more often than stronger ones. A slightly lower proportion of the schools inspected this year were good or outstanding at their previous inspection, when compared with last year. This may have contributed to the slightly lower grades seen this year.
Figure 4: Inspections judgements for state-funded schools inspected this academic year
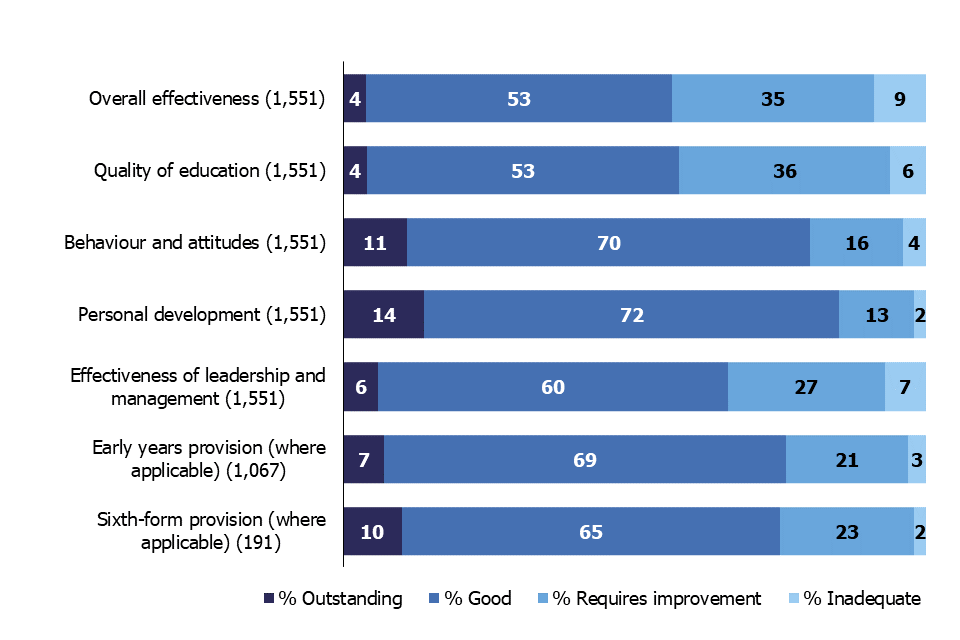
This includes section 5 inspections only.
Download a zip file with the underlying data in csv format.
This year we have carried out 1,551 section 5 inspections. Of these, 57% were judged good or outstanding for overall effectiveness. This proportion was the same as the new quality of education judgement, and higher for leadership and management (66%). However, grades were often noticeably higher for the other judgements than for overall effectiveness.
Overall, 16,755 schools have early years provision for children aged 5 or under, and, of these, 8,163 take 2- and 3-year-olds. Our early years judgement covers all this provision, both nursery and reception. Of the schools with early years provision that had a full inspection this year, 76% were graded good or outstanding for that provision. However, as the early years judgement is not made on section 8 visits to good and non-exempt outstanding schools, this figure may not reflect the quality of all the schools we visited this year.
Inspections of schools previously judged to be outstanding
The percentage of non-exempt outstanding schools that have remained outstanding this year has decreased to 84%, compared with 93% last year.
This year we have inspected 253 previously outstanding primary and secondary schools that are exempt from routine inspection, compared with 392 exempt schools that were inspected last year. The percentage of these schools that have remained outstanding this year has decreased slightly to 15%, compared with 16% last year. While most of the exempt schools inspected this year did decline, a larger proportion than last year only declined to good (65% compared with 56% last year), and correspondingly fewer declined to requires improvement and inadequate (20% compared with 28%). This may be partly due to changes in the way exempt schools are selected for inspection. We now consider the length of time since the last inspection.
Figure 5: Overall effectiveness of previously exempt state-funded schools, by academic year
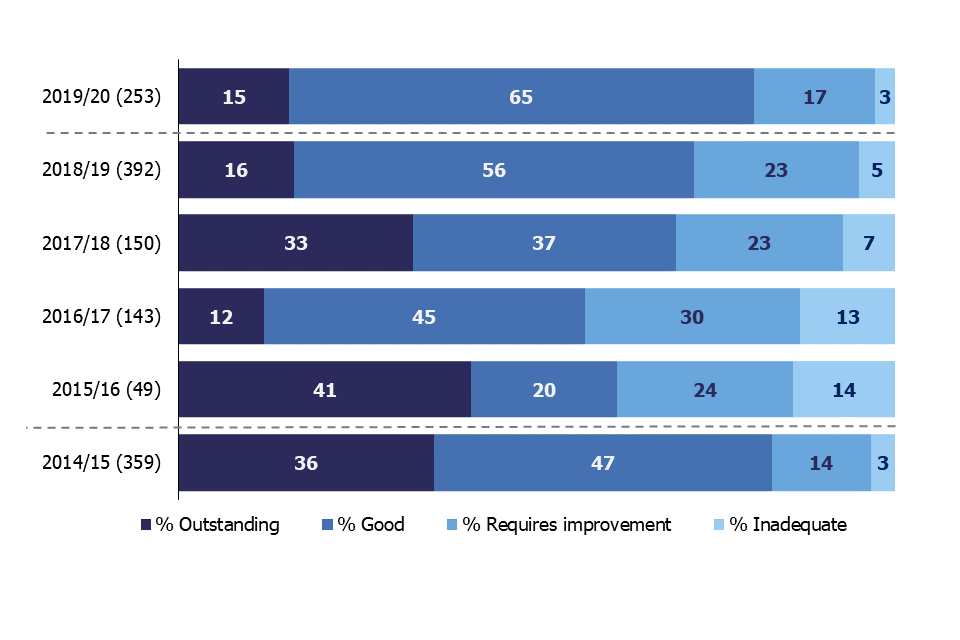
1. The dashed lines indicate that there were changes to the inspection framework in September 2015 and September 2019.
2. This includes section 5 inspections and section 8 inspections of good and non-exempt outstanding schools.
Download a zip file with the underlying data in csv format.
Since 2012, outstanding primary and secondary schools have been exempt from routine inspection. As a result, we have not inspected more than 1,000 exempt schools for a decade or longer. On 1 September 2019, the government announced its intention to remove the exemption for outstanding schools. Following a public consultation by the Department for Education, Parliament approved the change. We plan to start the routine inspection of these schools from January 2021.
This year we have inspected 99 previously outstanding non-exempt special schools, pupil referral units and nursery schools, compared with 201 that we inspected last year. The percentage of these schools that have remained outstanding this year has decreased to 84%, compared with 93% last year.
Figure 6: Overall effectiveness of previously non-exempt state-funded schools, by academic year
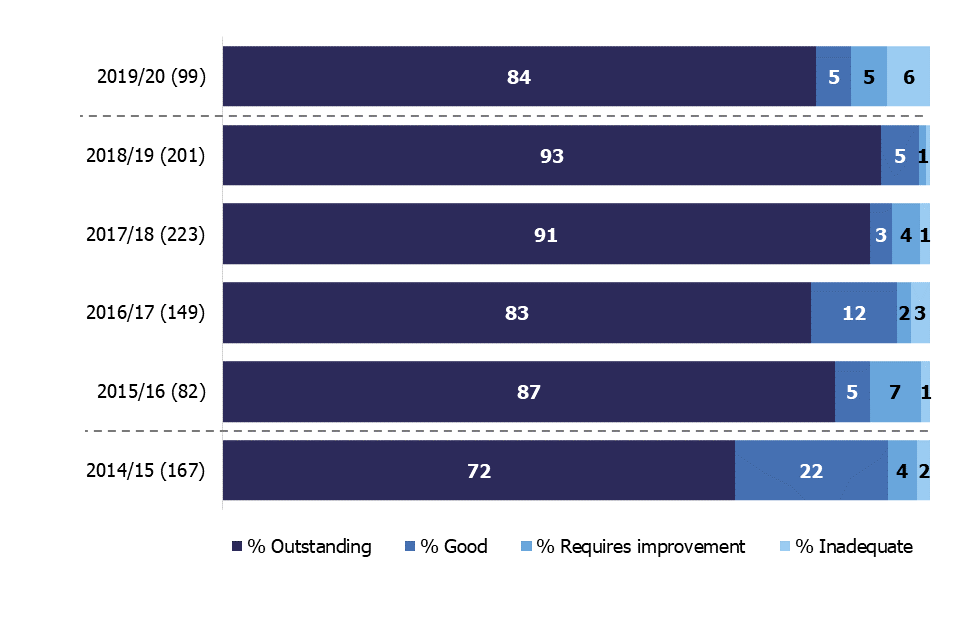
1. The dashed lines indicate that there were changes to the inspection framework in September 2015 and September 2019.
2. This includes section 5 inspections and section 8 inspections of good and non-exempt outstanding schools.
Download a zip file with the underlying data in csv format.
Inspections of schools previously judged to be good
Eighty-three per cent of the previously good schools inspected this year remained good and 2% became outstanding.
We have carried out 1,844 section 5 and section 8 inspections of previously good schools this year. Of these, 83% remained good, 2% became outstanding, 12% now require improvement and 3% became inadequate.
Between 2014/15 and 2018/19, the proportion of previously good schools remaining good or improving to outstanding increased each year. This year, there has been a decrease of 2 percentage points from 87% last year to 85% this year.
Figure 7: Grade movement for state-funded schools previously judged to be good, by year
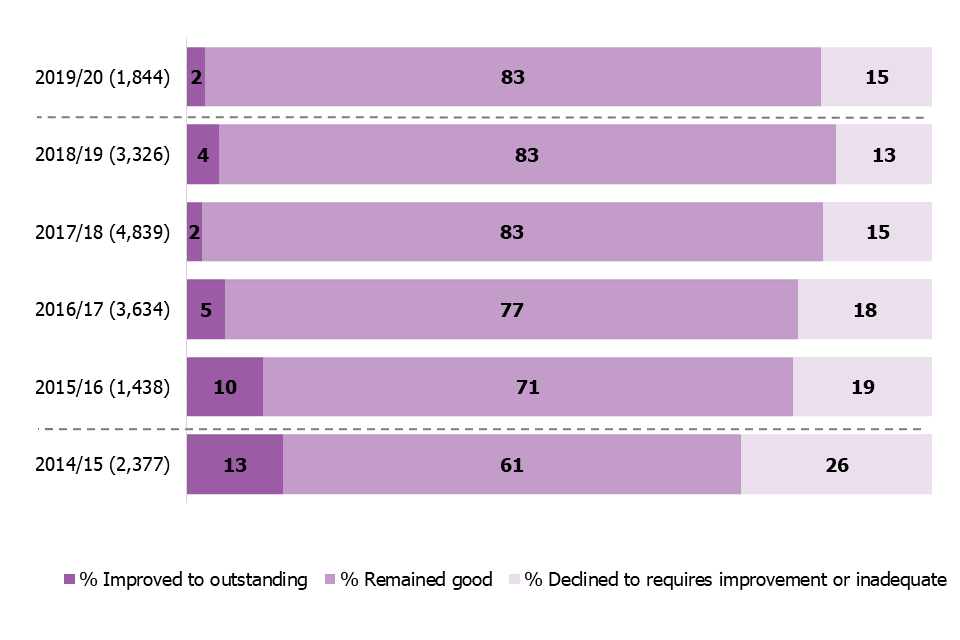
1. The dashed lines indicate that there were changes to the inspection framework in September 2015 and September 2019.
2. This includes section 5 inspections and section 8 inspections of good and non-exempt outstanding schools.
Download a zip file with the underlying data in csv format.
Secondary schools have the highest proportion of schools that declined to requires improvement or inadequate, at 24%.
Figure 8: Grade movement in 2019/20 for state-funded schools previously judged to be good, by phase
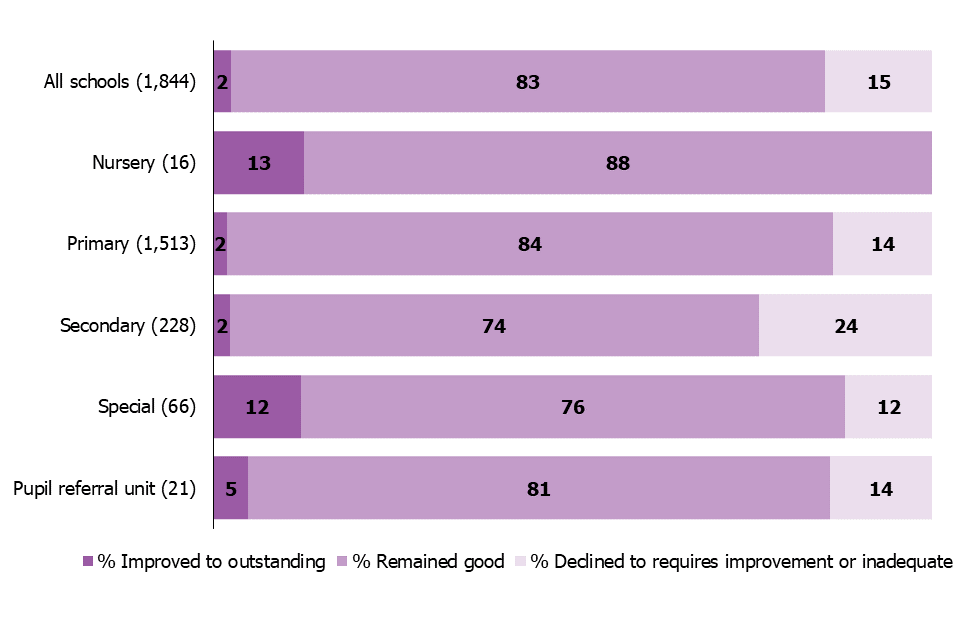
This includes section 5 inspections and section 8 inspections of good and non-exempt outstanding schools.
Download a zip file with the underlying data in csv format.
Only 1% of section 8 inspections of good schools converted to section 5 inspections. Of those that did not convert, 18% indicated that the school might decline at a section 5 inspection (compared with 11% last year) and 5% indicated that the school might improve (compared with 12% last year).
Inspections of schools previously judged to require improvement
This year, 56% of schools inspected improved from requires improvement to good or outstanding, compared with 64% last year.
We have carried out 586 section 5 inspections this year of schools that were previously judged to require improvement. This year, 56% of schools inspected improved from requires improvement to good or outstanding, compared with 64% last year. A further 36% remained requires improvement, an increase from 27% last year.
Figure 9: Grade movement for state-funded schools previously judged to require improvement, by year
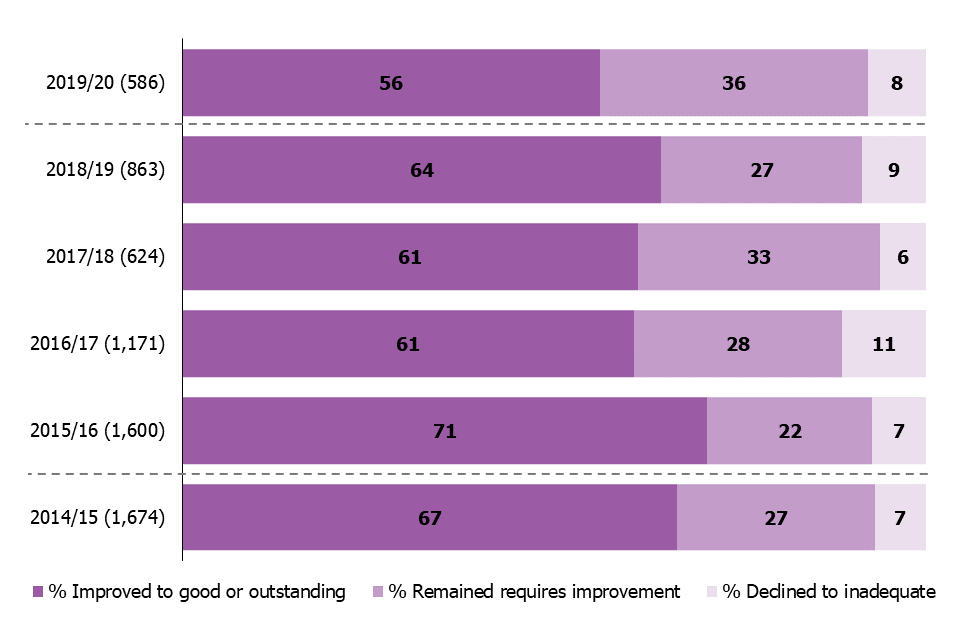
1. The dashed lines indicate that there were changes to the inspection framework in September 2015 and September 2019.
2. This includes section 5 inspections only.
Download a zip file with the underlying data in csv format.
Primary schools previously judged to require improvement are more likely to improve to good or outstanding than secondary schools, with 62% improving their grade this year compared with 42% of secondary schools. This pattern is true across each of the last 5 academic years.
Figure 10: Grade movement for primary schools previously judged to require improvement, by year
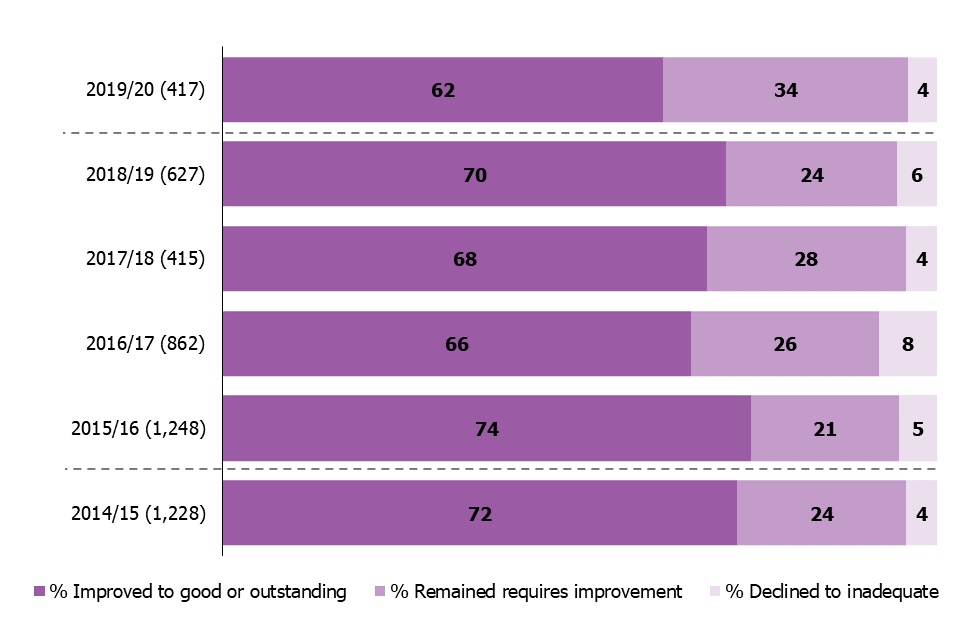
1. The dashed lines indicate that there were changes to the inspection framework in September 2015 and September 2019.
2. This includes section 5 inspections only.
Download a zip file with the underlying data in csv format.
Figure 11: Grade movement for secondary schools previously judged to require improvement, by year
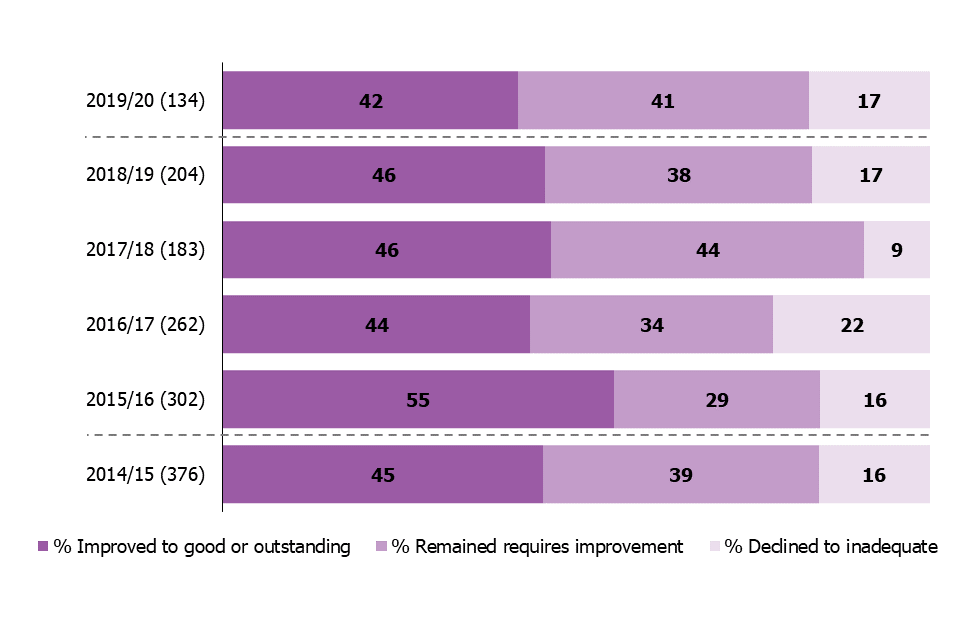
1. The dashed lines indicate that there were changes to the inspection framework in September 2015 and September 2019.
2. This includes section 5 inspections only.
Download a zip file with the underlying data in csv format.
The outcomes of inspections by level of deprivation
Eighty-six per cent of schools with the least deprived pupils were judged good or outstanding this year, compared with 69% of schools with the most deprived pupils.
Figure 12: Overall effectiveness judgements by level of deprivation, 2019/20[footnote 1]
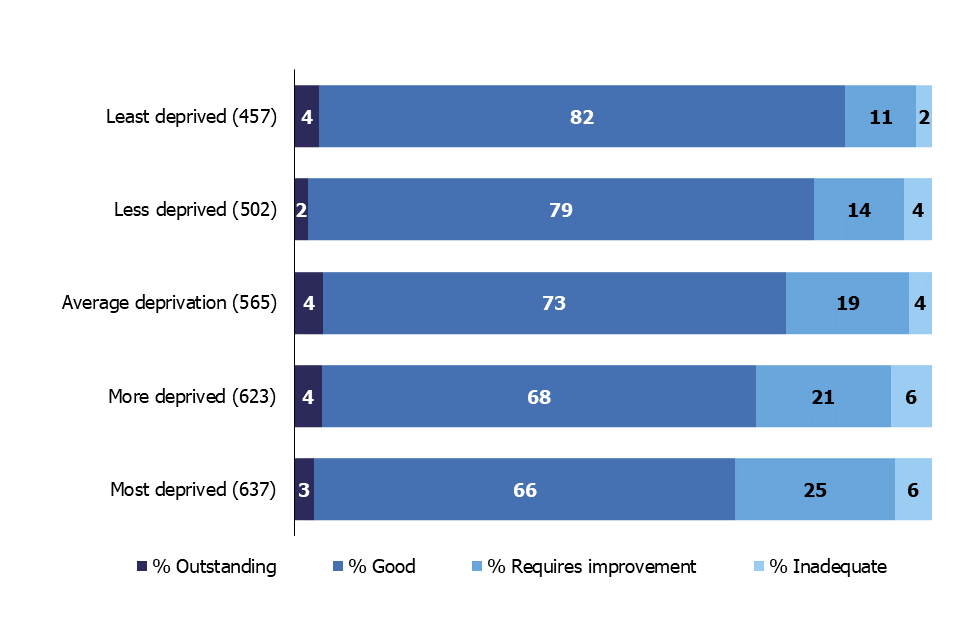
This includes section 5 inspections and section 8 inspections of good and non-exempt outstanding schools. Download a zip file with the underlying data in csv format.
A higher proportion of schools with the least deprived pupils were judged good or outstanding than those with the most deprived pupils. This pattern was seen under the common inspection framework between 2015 and 2019 and is still the case under the EIF this year. Last year, 88% of schools with the least deprived pupils were judged good or outstanding compared with 72% of schools with the most deprived pupils. Nevertheless, 69% of the schools we visited this year in the most deprived quintile were judged good or outstanding, so a positive inspection outcome is far from unusual for these schools.
Changes in overall effectiveness grades
Overall, 81% of schools inspected this year have either retained or improved on their previous overall effectiveness grade (this includes schools that had a section 8 inspection that did not convert to a section 5 inspection). This ranges from 93% of nurseries to 75% of secondary schools. Within this, 64% of schools kept the same grade as at their previous inspection compared with 65% last year.
Figure 13: Change in overall effectiveness of state-funded schools inspected in 2019/20, by phase
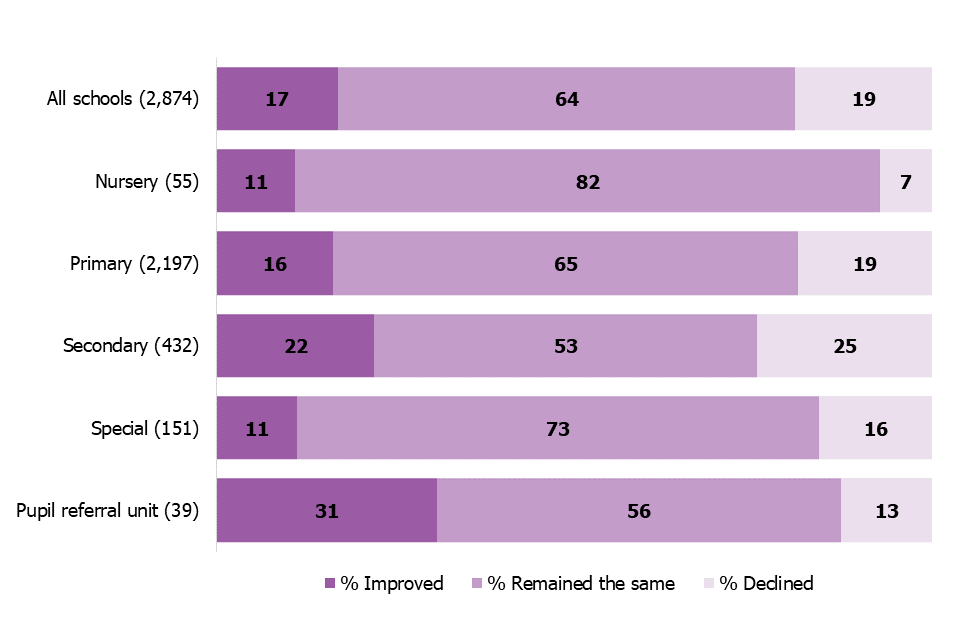
This includes section 5 inspections and section 8 inspections of good and non-exempt outstanding schools.
Download a zip file with the underlying data in csv format.
Overall, this is a fairly stable picture, with nearly two thirds of schools keeping the same grade under the EIF, and almost as many schools improving as declining. Underneath this high-level picture of minimal change, we have seen small changes for different groups of schools, such as fewer outstanding schools keeping the top grade, slightly fewer good schools improving and fewer requires improvement schools improving. After 7 months of inspections, the overall proportion of all schools graded good or outstanding at their most recent inspection is unchanged and remains at 86%, the same proportion as in August 2019. This year, 13% of all state-funded schools had either a section 5 inspection or a section 8 inspection of a good and non-exempt outstanding school.
Revisions to previous release
The provisional data in the previous release relates to inspections that took place between 1 September 2019 and 31 March 2020, with the reports published by 30 April 2020.
All routine inspections and the publication of most inspection reports were suspended in March 2020 due to COVID-19. As we only started to publish inspections reports again from May, this has led to a larger number of changes between the provisional and revised data than usual.
We provide revised data for inspections in this period in tables 1R and 2R of the Excel file accompanying this release: State-funded schools inspections and outcomes as at 31 August 2020, charts and tables.
This revised data includes an additional 235 section 5 inspections that had not been published by 30 April 2020 but were published by 31 August 2020. These inspections resulted in the following number of additional judgements at each overall effectiveness grade:
- 6 outstanding
- 113 good
- 75 requires improvement
- 41 inadequate
Table 1: Changes in overall effectiveness proportions for schools inspected between 1 September 2019 and 31 March 2020
| Ofsted phase | Provisional % outstanding | Revised % outstanding | Percentage point change in % outstanding | Provisional % good | Revised % good | Percentage point change in % good | Provisional % requires improvement | Revised % requires improvement | Percentage point change in % requires improvement | Provisional % inadequate | Revised % inadequate | Percentage point change in % inadequate |
|---|---|---|---|---|---|---|---|---|---|---|---|---|
| All schools | 4 | 4 | 0 | 54 | 53 | -1 | 35 | 35 | 0 | 7 | 9 | 2 |
| Nursery | 24 | 20 | -4 | 59 | 60 | 1 | 12 | 15 | 3 | 6 | 5 | -1 |
| Primary | 3 | 3 | 0 | 57 | 56 | -1 | 35 | 34 | -1 | 5 | 6 | 1 |
| Secondary | 3 | 3 | 0 | 45 | 43 | -2 | 40 | 40 | 0 | 12 | 15 | 3 |
| Special | 15 | 15 | 0 | 34 | 31 | -3 | 30 | 31 | 1 | 21 | 23 | 2 |
| Pupil referral unit | 7 | 6 | -1 | 61 | 59 | -2 | 25 | 28 | 3 | 7 | 6 | -1 |
Provisional includes inspections published up to 30 April 2020 and revised includes inspections published up to 31 August 2020.
We publish revisions to data in this publication in line with our revisions policy for official statistics.
Notes
The purpose of these official statistics is to disseminate the data on school standards collected through Ofsted’s role as an inspectorate. They provide information about how the judgements of schools have changed over time. They vary across different phases of education and different parts of the country.
This official statistics release reports on the outcomes of state-funded school inspections carried out under sections 5 or 8 of the Education Act 2005. We carried out these inspections between 1 September 2019 and 31 March 2020. This release includes all inspections published by 31 August 2020. This release also includes the most recent inspections and outcomes for all schools that we have inspected, as at 31 August 2020.
Throughout this release, we use the term ‘schools’ to cover all local authority maintained schools, state-funded academies and non-maintained special schools in England that section 5 of the Education Act 2005 requires us to inspect.
We carried out inspections between September 2015 and August 2019 under the common inspection framework.
From September 2019, we carry out inspections under the EIF.
You can find an explanation of the main uses of this data, further contextual information and the arrangements for quality assurance in the methodology report. This report provides information about strengths and limitations of the statistics.
Where we have quoted percentages in this report, figures have been rounded and may not add to 100.
Section 5 and section 8
Ofsted carries out inspections under sections 5 and 8 of the Education Act 2005.
We are required to inspect at prescribed intervals all schools to which section 5 applies. The regulations set the interval for section 5 inspections ‘within 5 school years from the end of the school year in which the last inspection took place’. The exceptions to this requirement are schools that are exempt from section 5 inspection (known as ‘exempt schools’).
Section 8 enables Her Majesty’s Chief Inspector (HMCI) to carry out inspections for a range of purposes. This includes monitoring visits by Her Majesty’s Inspectors (HMI) to schools that are in a category of concern following a section 5 inspection. HMI may also visit schools to aid HMCI in keeping the Secretary of State informed or to contribute to reports on, for example, the teaching in a curriculum subject or a particular aspect of the work of schools. Section 8 is also used to enable HMCI, if they have concerns, to carry out an inspection of those outstanding schools that are exempt from routine inspection under section 5.
Inspections carried out under section 8 include:
- section 8 inspections of schools judged to be good at their most recent section 5 inspection and those outstanding schools that are not exempt from section 5
- monitoring inspections of schools judged as requires improvement, having serious weaknesses or requiring special measures
- any inspection carried out in other circumstances if the inspection has no specific designation
- unannounced behaviour inspections
Section 8 inspections of schools judged to be good at their most recent section 5 inspection and those outstanding schools that are not exempt from section 5
These section 8 inspections are usually either a 1- or 2-day inspection and take place approximately every 4 years. The section 8 inspection determines whether the school continues to provide the same good or outstanding standard of education for pupils. The inspection does not result in individual graded judgements nor does it change the overall effectiveness grade of the school. If there are serious concerns, we convert the section 8 inspection to a section 5 inspection, when inspectors will make the full set of graded judgements.
From November 2017, some previously good schools are subject to a section 5 inspection instead of a section 8 inspection if our risk assessment tells us that a section 8 inspection would be highly likely to convert. For example, this applies if a school underwent significant change, such as changing its age range, or if the quality of provision may have deteriorated significantly.
From January 2018, section 8 inspections are only converted to a section 5 inspection if there are serious concerns. If a section 8 inspection does not convert, there are additional outcomes if the school remains either good or outstanding, but the next inspection will be a section 5 inspection.
Glossary
Definitions of terms are within the statistical glossary.
Further information
Contacts
If you are a member of the public and have any comments or feedback on this publication, contact Louise Butler on 03000 131 457 or the schools data and analysis team on inspectioninsight@ofsted.gov.uk.
Press enquiries should be sent to our press team on pressenquiries@ofsted.gov.uk.
Acknowledgements
Thanks to the following for their contribution to this statistical release: Clair Simpson, Matthew Spencer, James Jordan and Jay Kerai.
Instructions for printing and saving
Depending on which browser you use, such as Internet Explorer or Google Chrome, and the type of device you use, such as an iPhone or laptop, these instructions may vary.
You will find your print and save options in your browser’s menu. You may also have other options available on your device. Tablets and mobile device instructions will be specific to the make and model of the device.
How to search
Click on Ctrl + F on a Windows laptop or Command + F on a Mac
This will open a search box in the top right-hand corner of the page. Type the word you are looking for in the search bar and press enter.
Your browser will highlight the word, usually in yellow, wherever it appears on the page. Press enter to move to the next place it appears.
How to print a copy of the guidance
Click on Ctrl + P on a Windows laptop or Command + P on a Mac
You can also choose to save as a PDF.
-
Based on the indices of multiple deprivation (IDACI) 2019. Each school is assigned a score based on the home postcodes of the pupils who attended the school at the time of the January 2020 school census. The schools are then placed into one of 5 deprivation bands. ↩