Single Living Accommodation Lived Experience Survey: 2026
Published 6 August 2026

© Crown copyright 2026
This publication is licensed under the terms of the Open Government Licence v3.0 except where otherwise stated. To view this licence, visit nationalarchives.gov.uk/doc/open-government-licence/version/3 or write to the Information Policy Team, The National Archives, Kew, London TW9 4DU, or email: psi@nationalarchives.gov.uk.
Where we have identified any third party copyright information you will need to obtain permission from the copyright holders concerned.
This publication is available at https://www.gov.uk/government/statistics/single-living-accommodation-lived-experience-survey-2026--2/single-living-accommodation-lived-experience-survey-2026
1. Main points
-
66% of Service personnel (SP) consider quality the most important factor for Single Living Accommodation (SLA) in comparison to choice, cost and value for money, broadly consistent with 2022 and 2024.
-
The top three aspects of SLA SP are most satisfied with is unchanged since 2022. These are welfare provision on site (73%), convenience (67%) and lighting (66%).
-
The top four aspects of SLA SP are most dissatisfied with is unchanged since 2022. These are current snack preparation facilities (53%), response to requests for maintenance/repair (48%), Wi-Fi provision (45%) and quality of maintenance/repair work (45%).
-
An en-suite remains the facility most wanted or expected by SP in SLA (82%). Enhanced cooking facilities and a double bed have consistently ranked among the most desired facilities in 2022, 2024 and 2026.
-
83% of SP had experienced a fault or repair issue in their SLA within the last 12 months. The top reasons were uncontrollable heat/cold in a room (54%), water leak/blocked drains (44%) and damp and mould (35%).
-
16% of SP had felt unsafe in their SLA due to unacceptable behaviours. The top reasons for this were unannounced/forced entry of a contractor/industry partner (8%) and anti-social behaviour (7%).
-
39% of SP said their experience of SLA has no impact on their intention to stay or leave the Armed Forces. 13% of SP said their experience of SLA increases their intention to stay in the Armed Forces increased from 10% in 2022. 39% of SP said their experience of SLA increases their intention to leave - similar to 2024, but an increase from 34% in 2022.
Responsible Statistician: People Accommodation Analysis Head of Branch Further information: people-accommodation-research@mod.gov.uk
Please refer to the Supplementary tables for all data presented in this publication.
2. Introduction
2.1 Context
The Single Living Accommodation (SLA) Lived Experience Survey was designed by the Ministry of Defence (MOD) to produce statistics that would help to inform decisions on the future design of SLA. The survey is intended to understand what SP in the UK armed forces want and need from SLA and how SLA is currently being used.
SLA is normally provided in the form of accommodation blocks inside military bases. It is available to single and unaccompanied personnel who are married/in a civil partnership undertaking initial training or those serving on a regular engagement with the UK Armed Forces, including Full Time Reserve Service (Full Commitment). It can be used as a permanent residence for some SP or on an ad hoc basis by others where they have an additional residence, for example their own home.
For more information about SLA, please see the Joint Service Publication 464: Tri-service accommodation regulations Volume 1.
2.2 Single Living Accommodation Survey
The survey was open to all Regular and Reserve SP, whether in receipt of SLA or not, in April and May 2026 using an online questionnaire.
Overall, 5,722 survey responses were received. After data cleaning there were 4,721 valid survey responses representing a response rate of 2.2%.
The Reference Tables, the Background Quality Report (BQR) and questionnaire are published as separate documents and can be found on GOV.UK. The BQR contains full details of the survey methodology, analysis, and data quality considerations.
Throughout the report, where statistical significance tests are applied, they are carried out at the 95% confidence level. Confidence intervals provide a range around an estimate, reflecting the uncertainty associated with survey results. Where a statistically significant difference is reported, this means there is sufficient statistical evidence to conclude that the observed difference between survey results is unlikely to be due to chance variation alone.
The glossary contains definitions of terminology used in this publication.
3. Use of Single Living Accommodation
This section covers how SP currently use SLA.
Most responses to the survey (77%) are from SP who are currently living in SLA. A higher proportion of Other Ranks (83%) are currently living in SLA compared with Officers (59%). Of those currently living in SLA, 54% report using it as their home or primary place of residence. These results may not reflect the actual number of SP living in SLA.
3.1 Figure 1: Number of nights SP typically spend living in SLA per week.
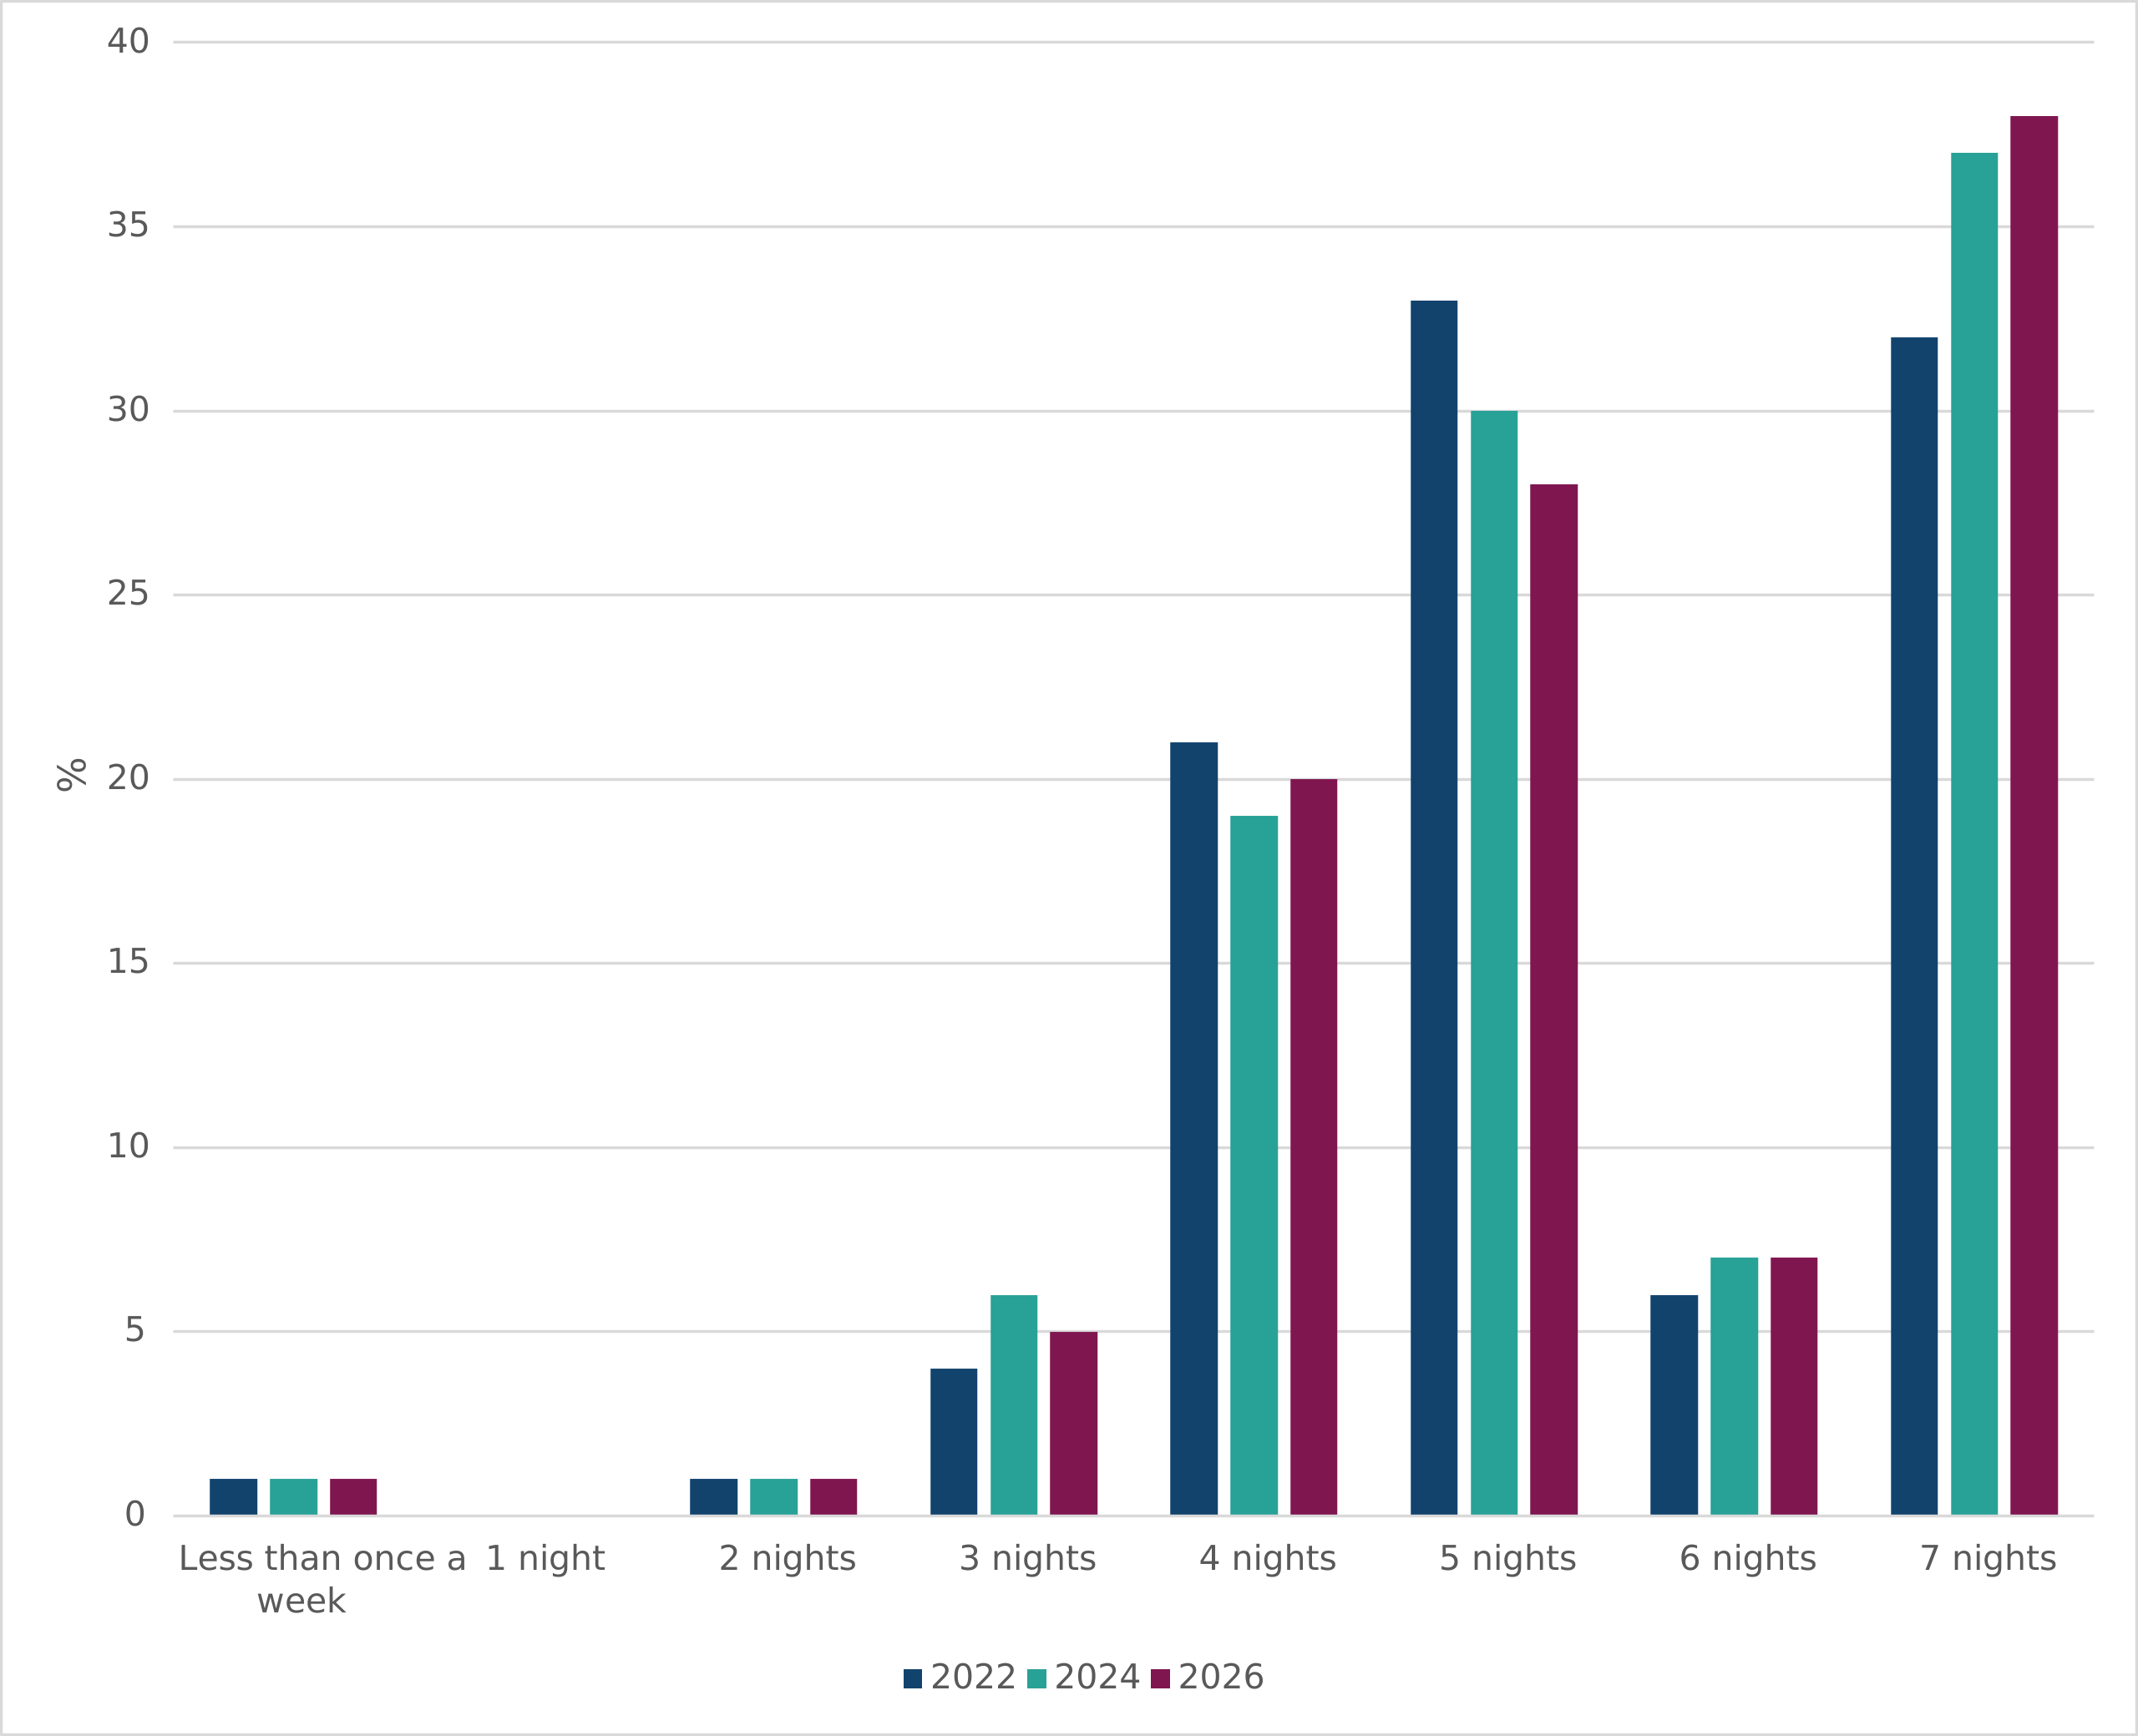
Figure 1 shows the number of nights SP typically spend living in SLA. Overall, 38% of SP who currently live in SLA report doing so for seven nights a week, an increase from 37% in 2024 and a statistically significant increase from 32% in 2022. 28% report living in SLA for five nights a week. The data in this chart is available in Table 8 of the reference tables.
Of those currently living in SLA, 44% of Other Ranks report staying seven nights a week, compared with 20% of Officers. For Other Ranks, this represents a statistically significant increase of 3% since 2024.
24% of respondents had a flexible working pattern. Of those with a flexible working pattern, Tuesday (95%), Wednesday (93%) and Monday (89%) were the nights SP used SLA most.
4. Temporary use of Single Living Accommodation
This section covers SP’s preferences regarding the temporary use of SLA. SLA can be permanently or temporarily allocated. Currently, temporary SLA is Service provided accommodation (SLA or hotel) which is booked as and when required with no or limited provision for storage of personal possessions.
SP think that staying in SLA for less than two (23%) or three (31%) nights per week would be considered temporary usage. Nearly two thirds (63%) of SP think temporary use is defined as 3 days or less. This proportion of SP who think this is similar to 2022 (62%) and 2024 (63%).
SP were asked how they would prefer to book SLA if it was offered on a temporary basis. Consistent with 2022 and 2024 levels, the majority (81%) would prefer to book using an online booking tool. The proportion of Other Ranks who selected an online booking tool has decreased by two percentage points to 79% since 2024. The proportion of Officers who selected this option remains unchanged at 86% since 2024.
4.1 Figure 2: Proportion of SP, if SLA was offered on a temporary basis similar to a hotel, who would be content to stay in a true mixed-rank block where Junior and Senior ranks were mixed on the same floor.
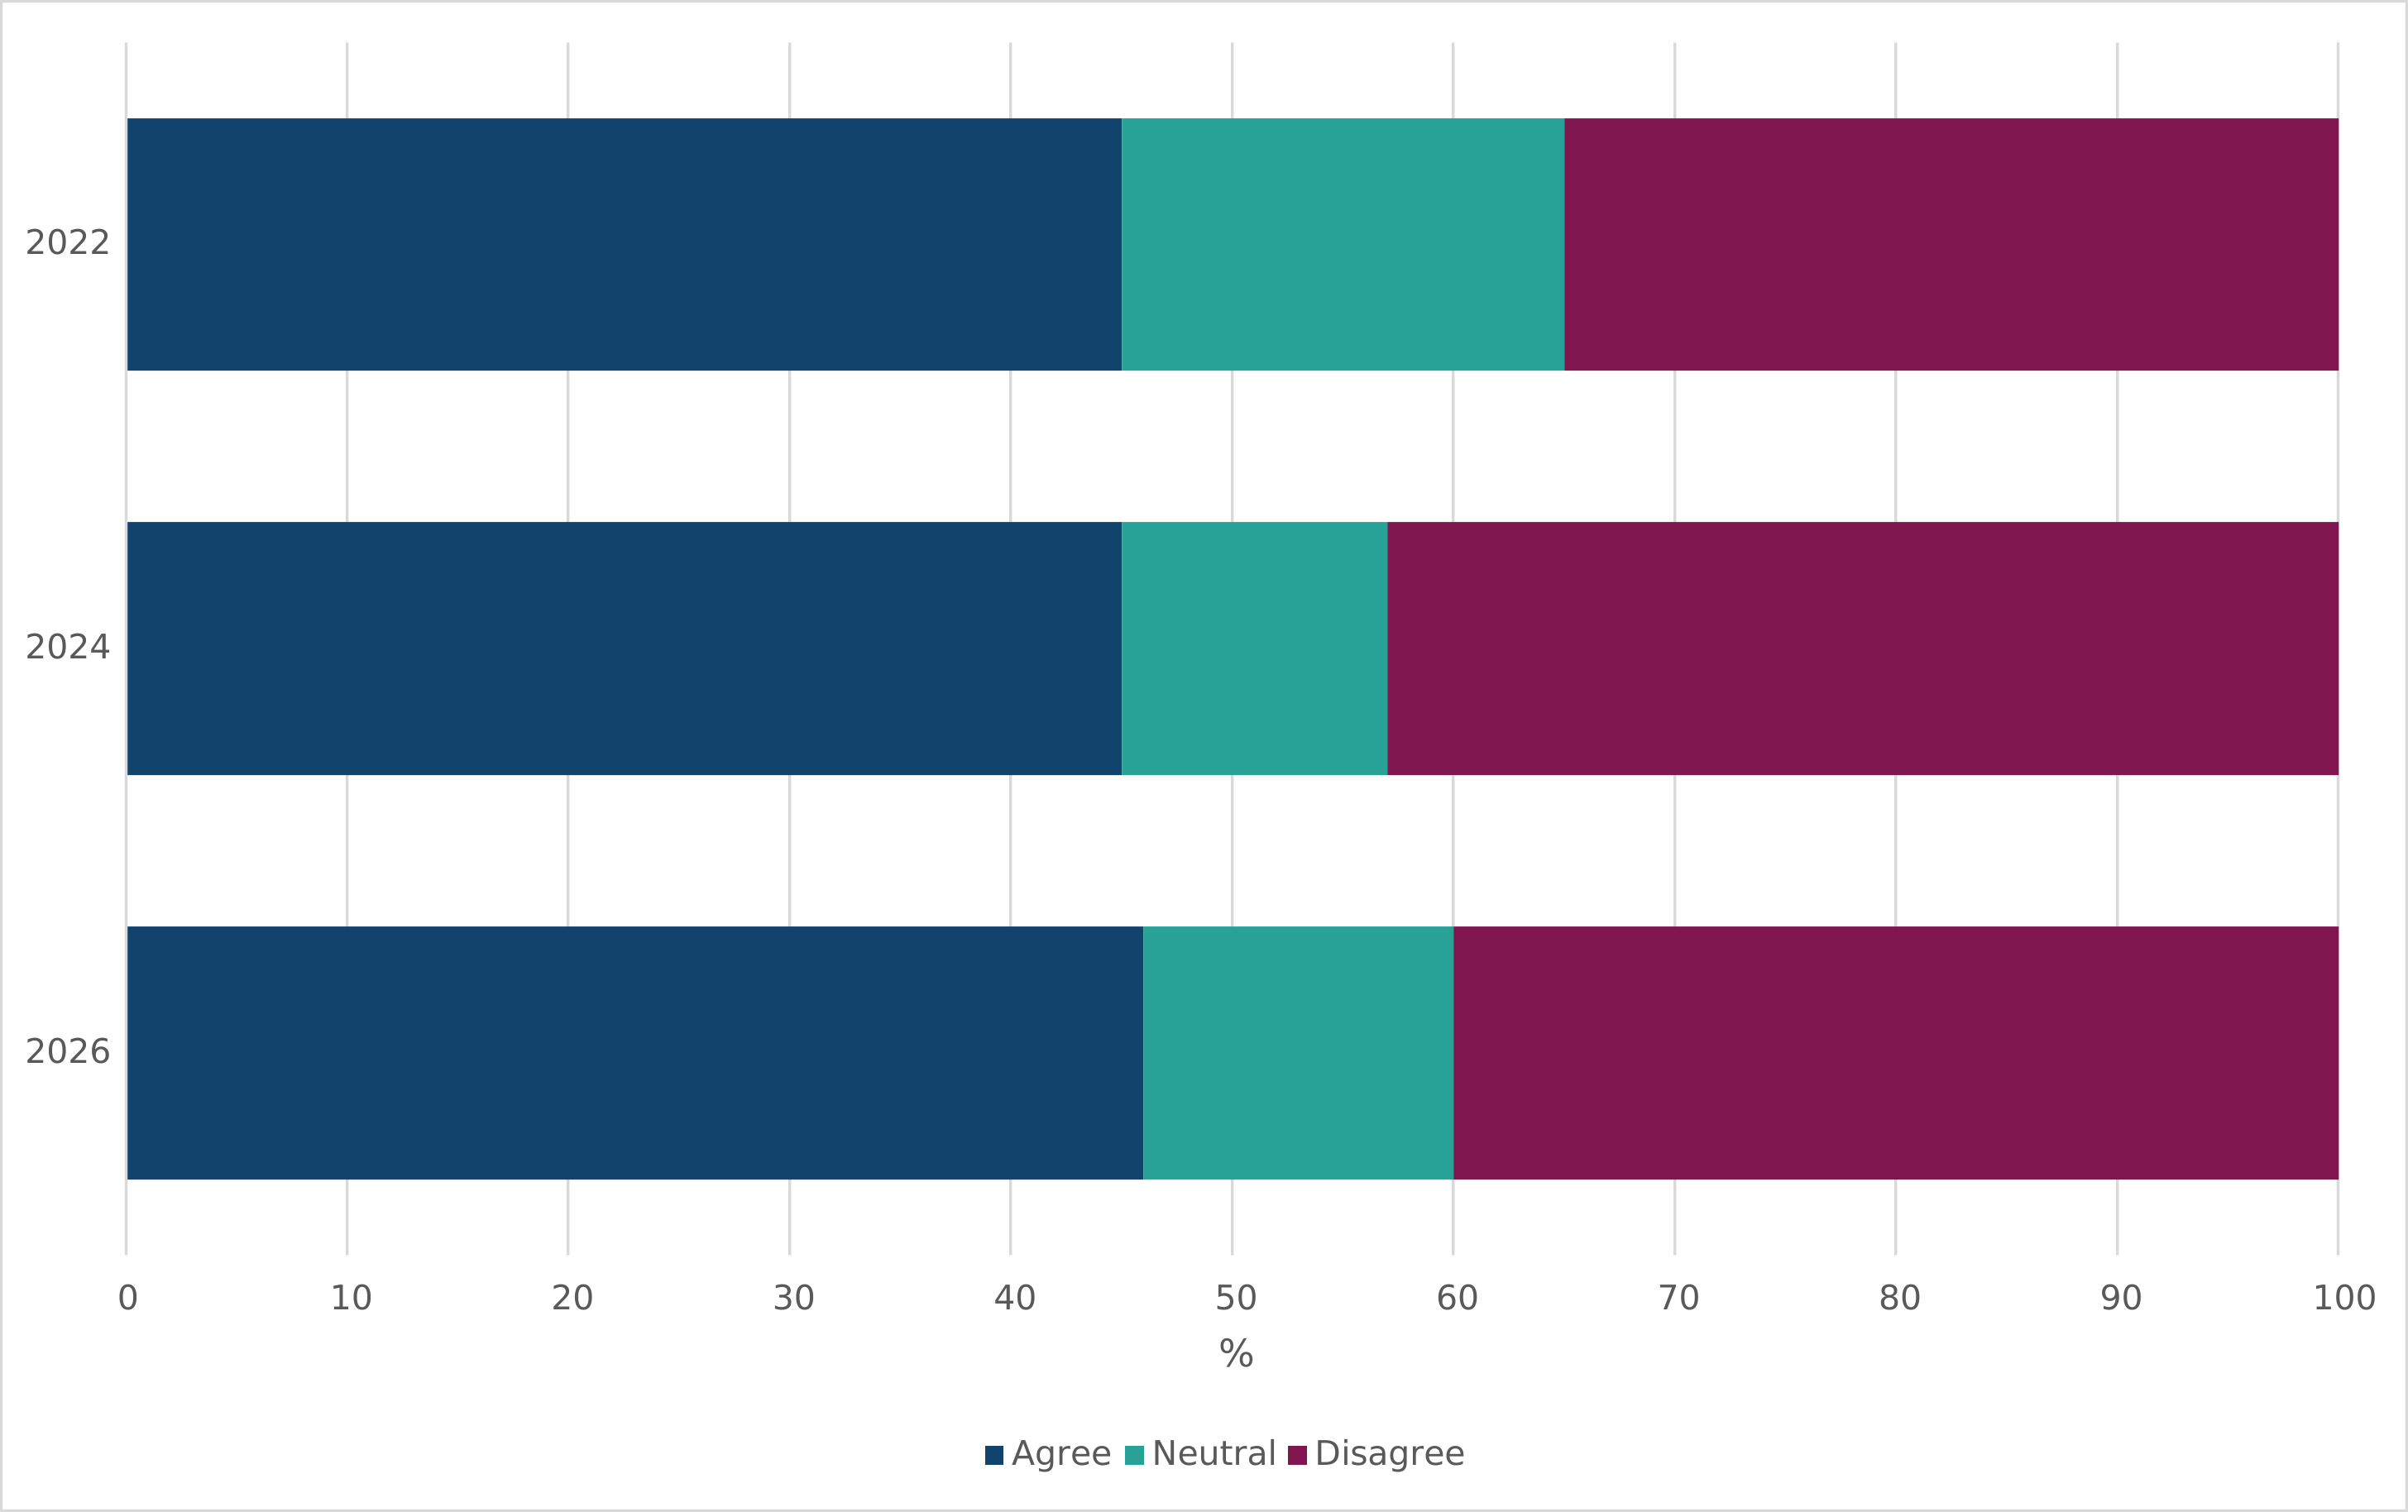
SP were asked whether they would be content to stay in a true mixed-rank block if SLA was offered on a temporary basis. Within a true mixed-rank block, Junior and Senior Ranks would share the same floor however bathrooms would not be shared. Figure 2 is a bar chart showing the proportion of SP who would be content (agree, disagree or neither agree nor disagree) in a true mixed-rank block in temporary SLA. The data in this chart is available in Table 14 of the reference tables.
46% of SP would be content to stay in a true mixed-rank block (similar to 2022 and 2024, both 45%). Other Ranks (50%) remain more likely to be content with staying in a true mixed-rank block than Officers (32%). The proportion of Officers who would not be content to stay in a true mixed-rank block has decreased since 2024 from 62% to 58% but increased since 2022 (52%).
4.2 Figure 3: Proportion of SP who would be content to stay in a mixed-rank block where Senior and Junior ranks are separated by floor if SLA was offered on a temporary basis.
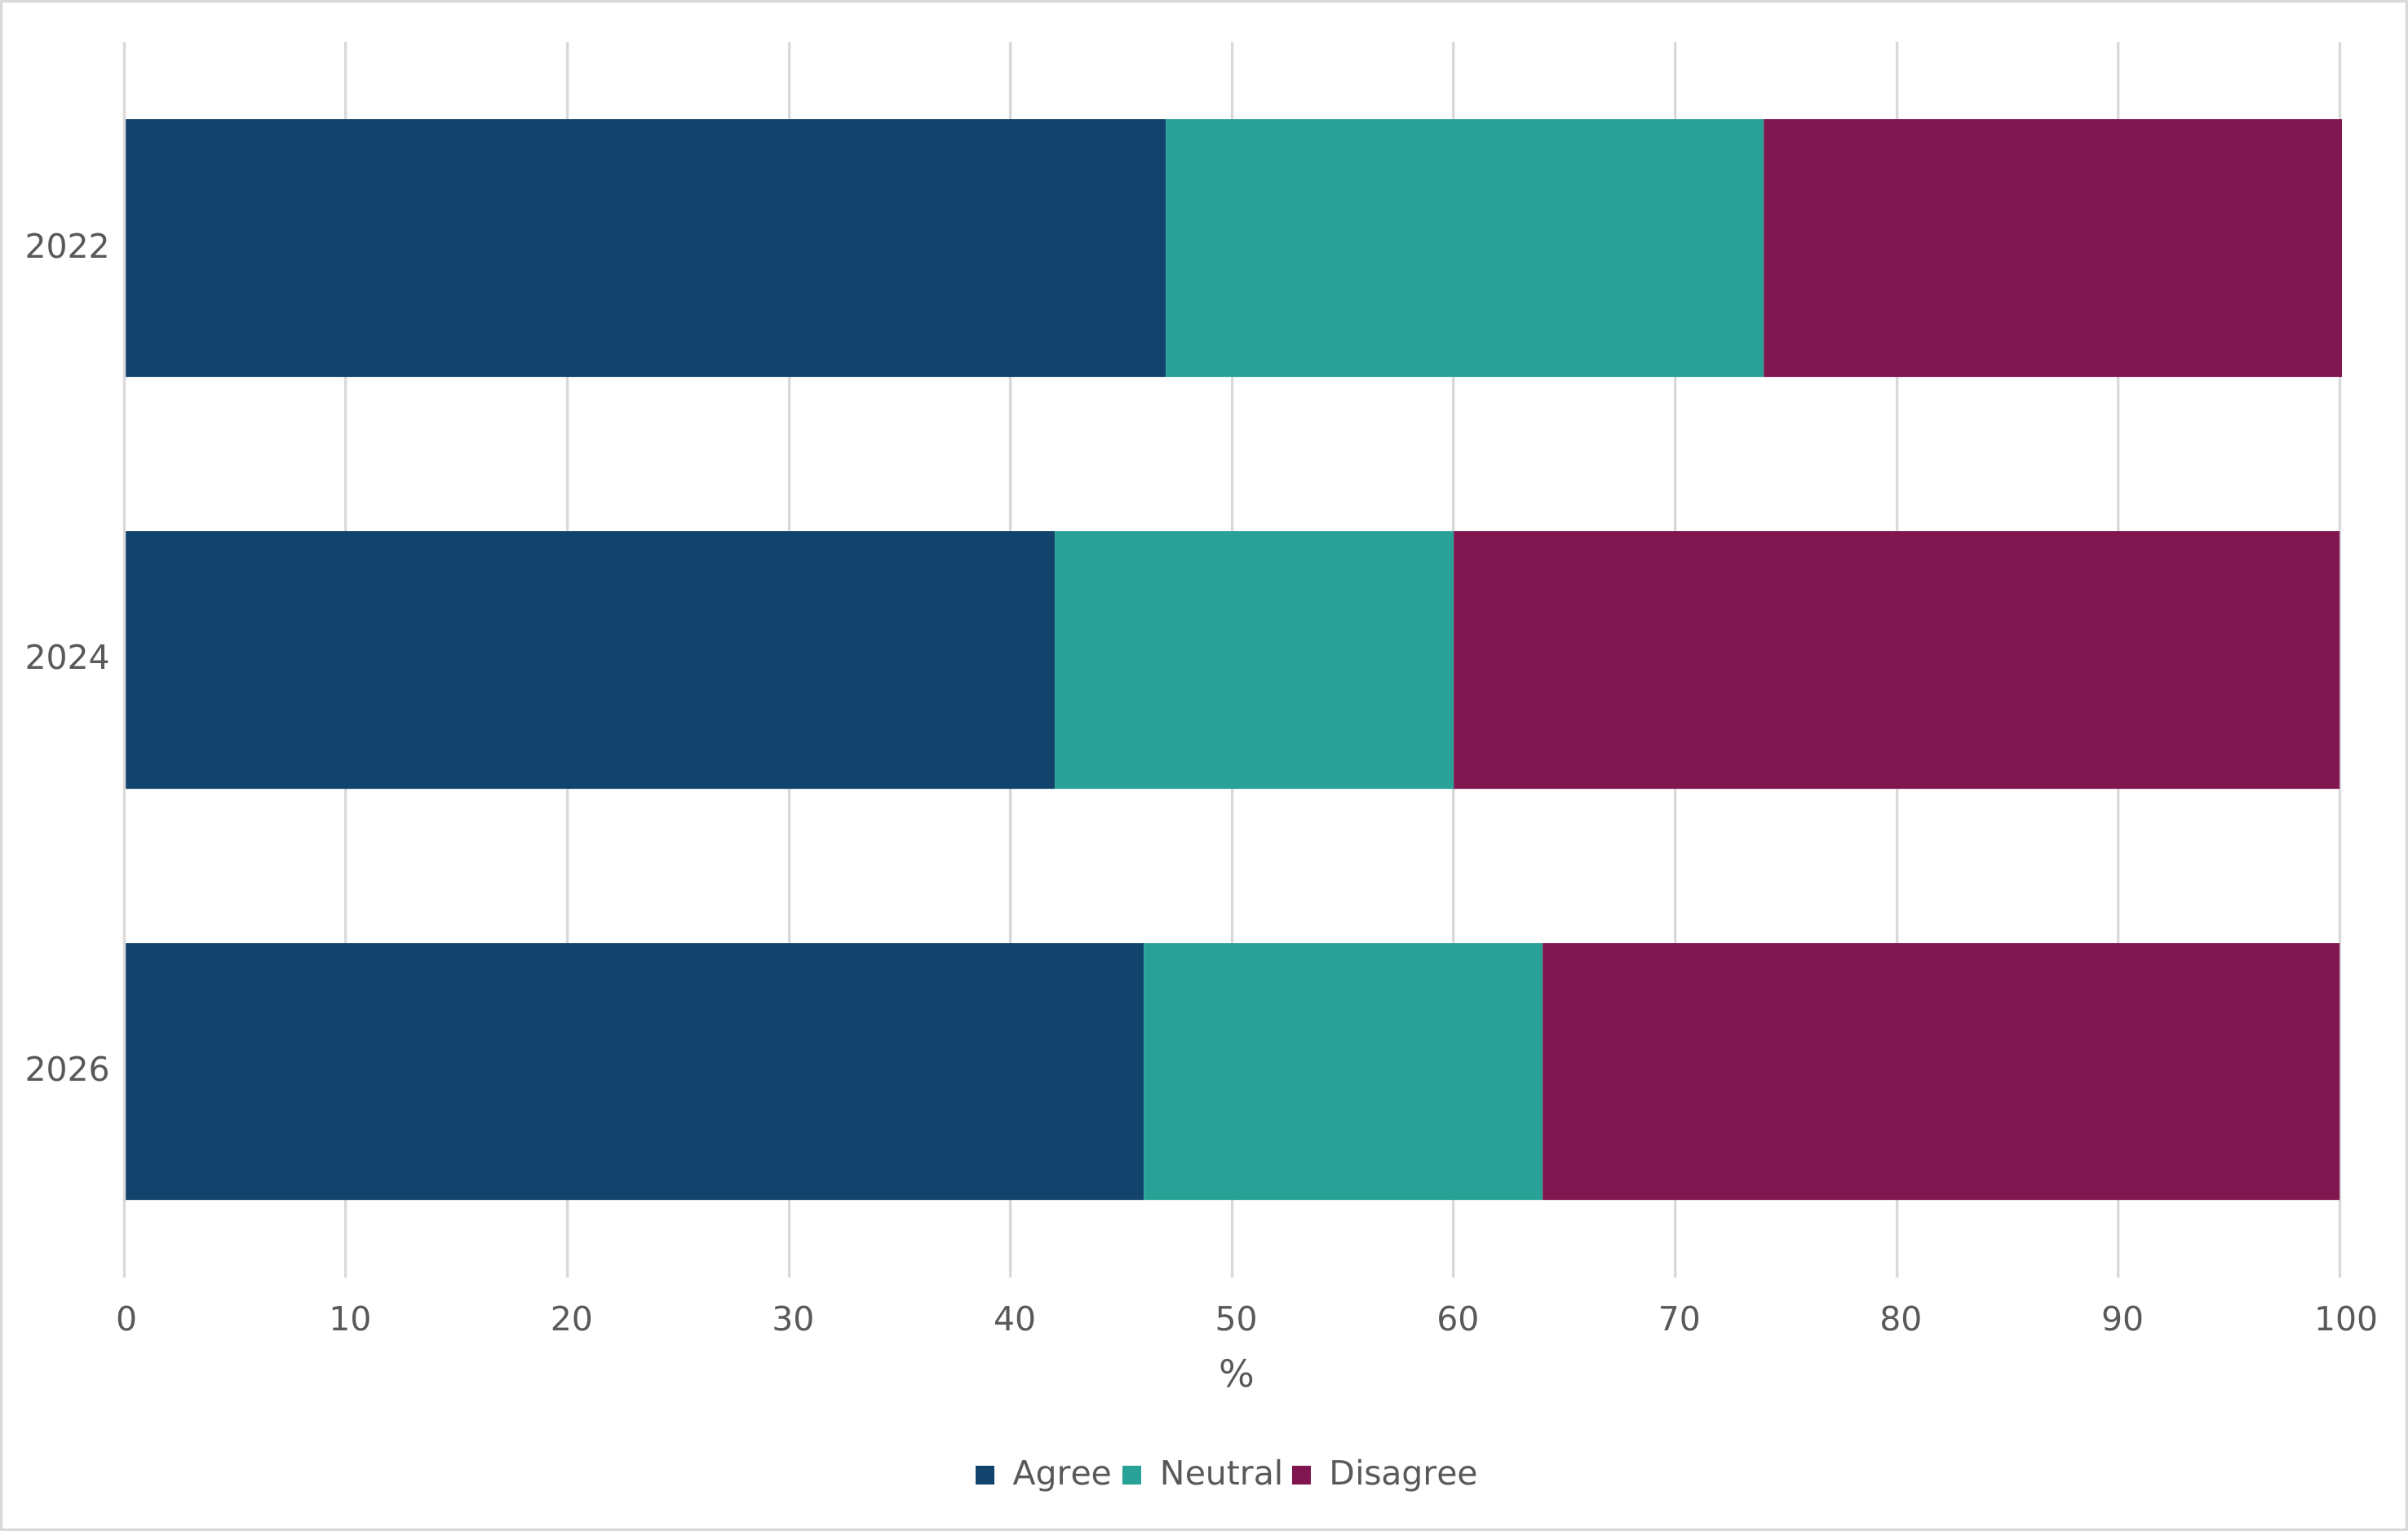
SP were also asked whether they would be content to stay in a mixed-rank block where Junior and Senior ranks were separated by floor if SLA was offered on a temporary basis. Figure 3 is a bar chart showing the proportion of all SP who agree, disagree or neither agree nor disagree that they would be content staying in a mixed-rank block where Junior and Senior ranks are separated by floor. The data in this chart is available in Table 15 of the reference tables.
The proportion of SP who would be content to stay in a mixed-rank block where Senior and Junior ranks were separated by floor has increased from 42% in 2024 to 46%, similar to 2022 (47%). The proportion of SP who would not be content with this has decreased from 40% to 36% but has risen from 27% since 2022. Officers (44%, decreased from 50% in 2024) are more likely to not be content with staying in a mixed-rank block than Other Ranks (33%, decreased from 36% in 2024).
If SLA was offered on a temporary basis, 55% of SP anticipated issues with storing kit and equipment. This has decreased since 2024 (62%), alongside an increase in the proportion not anticipating storage issues, from 21% to 26%.
SP were asked what level of storage they would need if using SLA temporarily. The proportion who thought their role would require extensive storage, such as multiple wardrobes’ worth, was 41%; this has decreased since 2022 (50%) and 2024 (47%). Around half of SP (50%) thought they would need some storage, such as one wardrobe’s worth, an increase from 42% in 2022 and 45% in 2024. All Services saw a decrease in the need for extensive storage compared to 2022 and 2024.
In 2026, 72% of SP agreed they would be content with a different level of provision, such as room size, if SLA was offered on a temporary basis similar to a hotel. This increased from 49% in 2022 and 52% in 2024. Agreement was higher among Officers (77%) than Other Ranks (70%). 12% of SP disagreed they would be content with a different level of provision; this is a decrease from 24% in 2022 and 27% in 2024.
4.3 Figure 4: Proportion of SP who selected each amenity they would expect to see if SLA was offered on a temporary basis for hybrid workers.
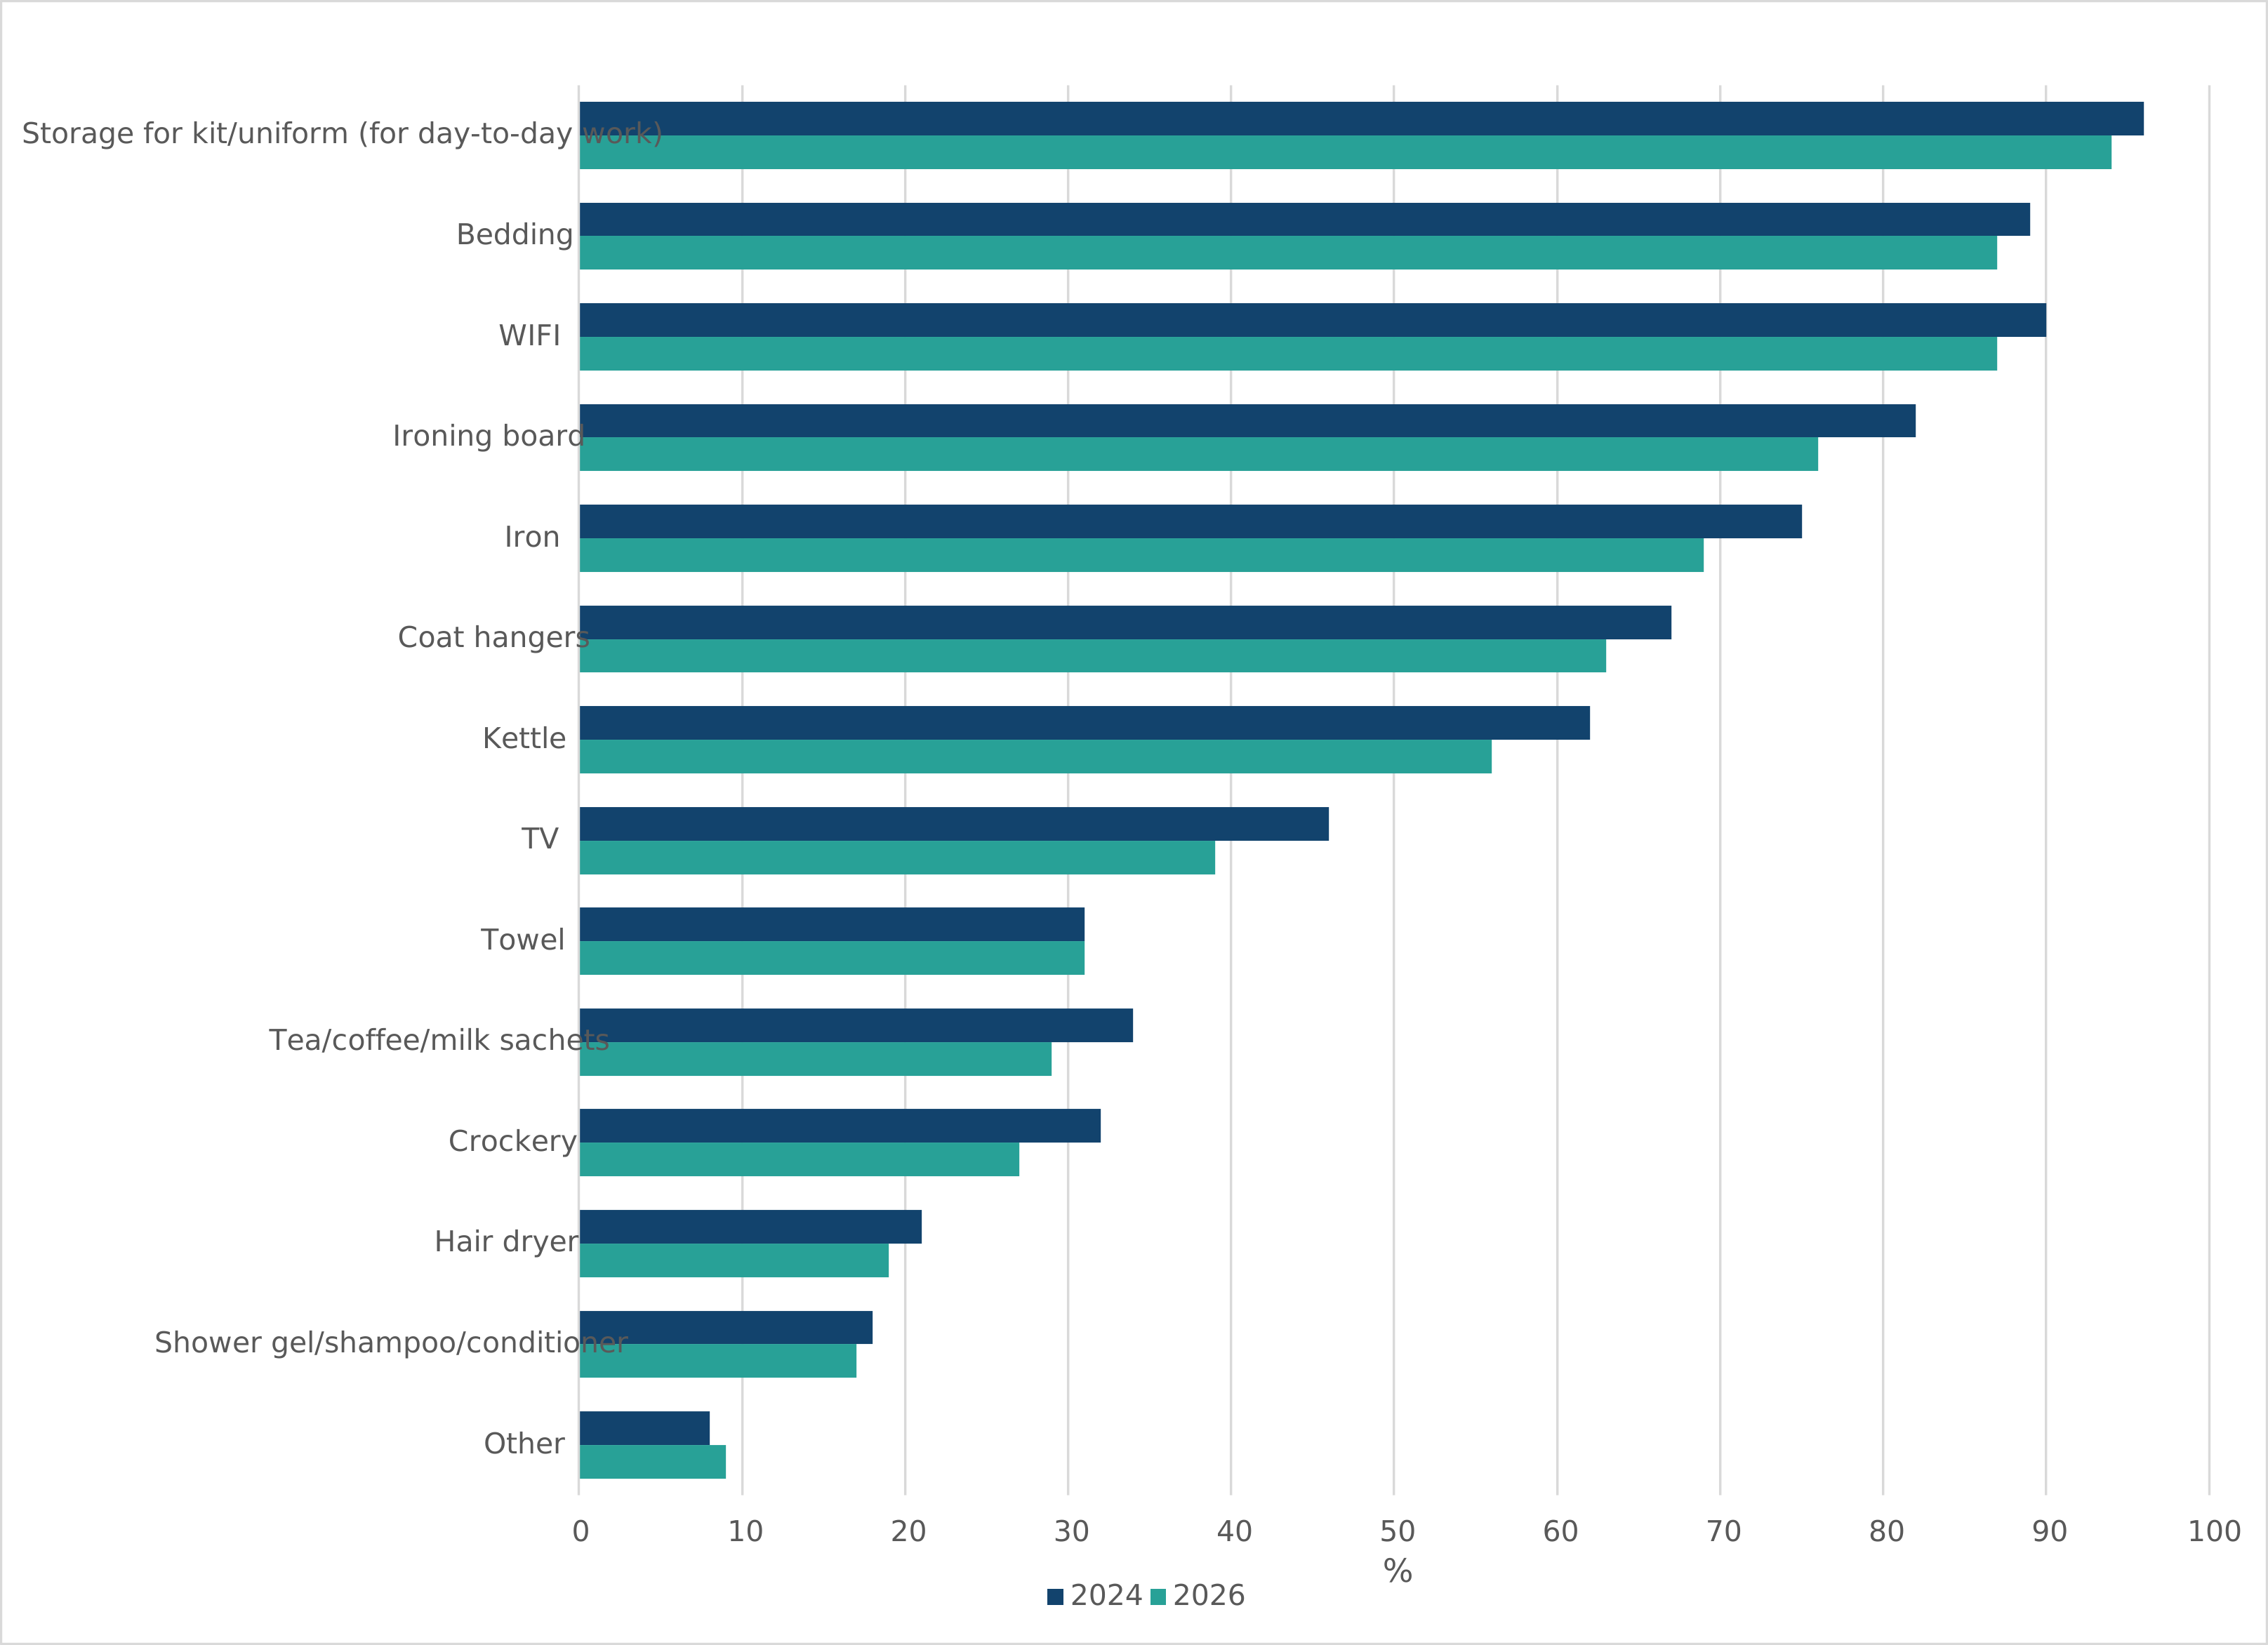
SP were asked to state which amenities they would expect to see if SLA was offered on a temporary basis for hybrid workers. Figure 4 is a bar chart showing the proportion of SP who selected each amenity they would expect to see if SLA was offered on a temporary basis for hybrid workers. The data in this chart is available in Table 19 of the reference tables.
Most SP would expect to see storage for kit/uniform (94%), bedding (87%), Wi-Fi (87%), an ironing board (76%) and an iron (69%) in temporary SLA. For most amenities, there has been a decrease in need since 2024. However, storage for kit/uniform, bedding and Wi-Fi have remained the top 3 amenities required for temporary SLA in 2026.
SP were asked whether permanent occupants of SLA should be allocated a better standard of SLA than temporary users, a new question this year. In 2026, 80% agreed, while 9% were neutral and 11% disagreed. Agreement was similar among Officers (78%) and Other Ranks (81%). By Service, agreement was highest among RAF personnel (84%) and Army personnel (82%), and lower among Royal Navy personnel (72%).
5. Satisfaction with Single Living Accommodation
This section covers SP’s satisfaction with SLA.
5.1 Figure 5: SP’s satisfaction with different aspects of SLA.
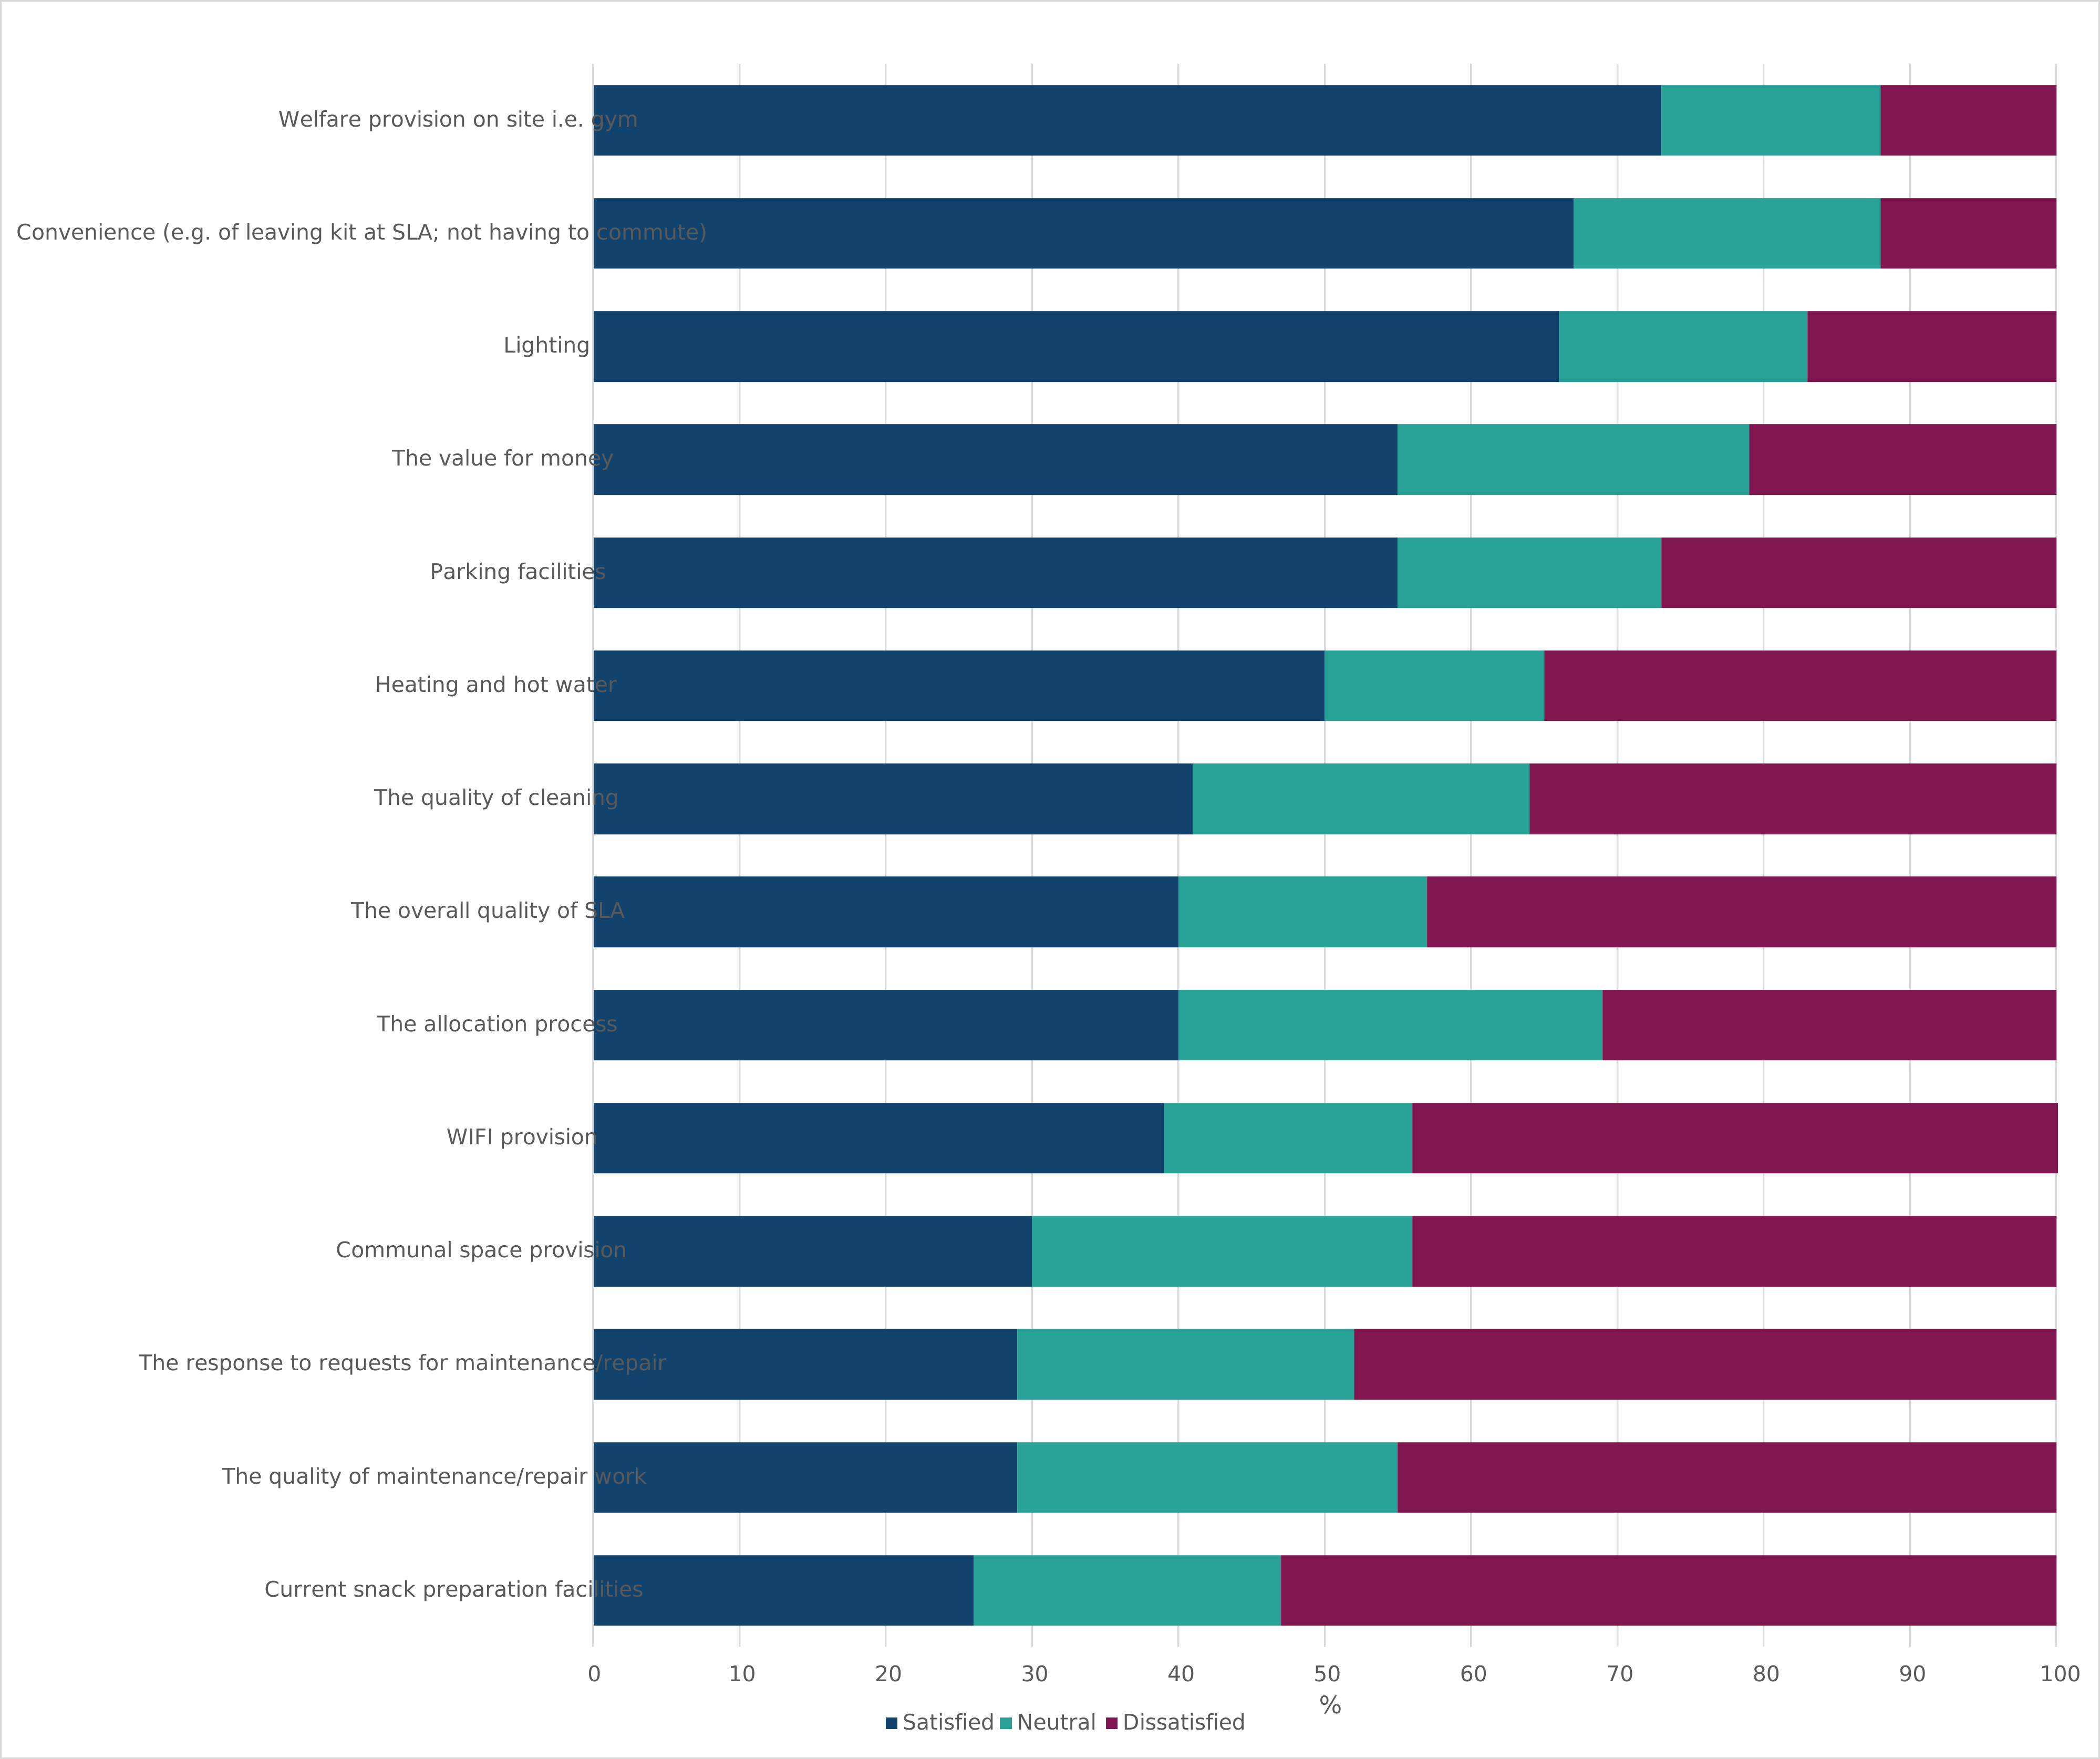
SP were asked to state how satisfied they were with different aspects of SLA. These questions were only asked to SP who currently live or had lived in SLA within the last five years. Figure 5 is a bar chart showing the proportion of SP who are satisfied, dissatisfied or neither satisfied nor dissatisfied with different aspects of SLA. The data in this chart is available in Tables 21 to 34 of the reference tables.
Overall, satisfaction with different aspects of SLA has increased or stayed the same since 2024 and dissatisfaction has decreased or stayed the same since 2024.
In 2026, SP were most satisfied with welfare provision on site (73%), convenience (67%) and lighting (66%). These have consistently been the top three aspects of SLA SP are most satisfied with since 2022. Levels of satisfaction have increased significantly or stayed the same with these three aspects since 2024.
SP are most dissatisfied with current snack preparation facilities (53%), response to requests for maintenance/repair (48%) and Wi-Fi provision (45%) and quality of maintenance/repair work (45%). These have consistently been the top four aspects of SLA SP are most dissatisfied with since 2022. However, levels of dissatisfaction have decreased significantly with these four aspects since 2022.
Officers were most satisfied with welfare provision on site (74%), convenience (73%) and parking (69%). Officers were most dissatisfied with current snack preparation facilities (56%), Wi-Fi provision (50%), response to requests for repair and maintenance (48%) and quality of maintenance (48%).
Other Ranks were most satisfied with welfare provision on site (72%), lighting (67%) and convenience (65%). Other Ranks were most dissatisfied with current snack preparation facilities (52%), response to requests for repair and maintenance (48%), communal space (46%).
SP were asked if their experience of SLA has any impact on their intention to stay or leave the Armed Forces. For 39% of SP, their experience of SLA has no impact on their intention to stay or leave the Armed Forces. 13% of SP say their experience of SLA increases their intention to stay in the Armed Forces, this has increased significantly from 10% in 2022 and 11% in 2024. However, for 39% of SP, their experience of SLA increases their intention to leave. This is similar to 2024 but has increased significantly from 34% in 2022. This is a consistent trend across all three services.
6. Value for Money
This section covers SP’s satisfaction with the value for money of SLA.
In 2026, 45% of SP were satisfied with the value for money of SLA, 27% were dissatisfied and 28% were neither satisfied nor dissatisfied. Satisfaction was similar to levels in 2022 (47%) and 2024 (45%). Dissatisfaction fell significantly from 30% in 2022 and 2024. Officers were more positive than Other Ranks, with 54% satisfied compared with 42% of Other Ranks.
Among SP satisfied with the value for money of SLA, 75% said they pay a fair amount for the quality of accommodation, broadly stable since 2022 (77%) and 2024 (76%). Among dissatisfied SP, 54% said accommodation quality is too low regardless of cost, while 29% said they pay too much. These reasons have remained broadly consistent since 2022.
In 2026, 47% of SP said they would pay more for better quality SLA, a significant increase from 43% in 2024. Other Ranks were more likely than Officers to say they would pay more for better quality SLA (52% vs 31%). 26% of SP would not pay more for better quality SLA, significantly down from 30% in 2024 but unchanged from 2022.
When asked whether they would prefer to pay less for lower quality SLA, most SP in 2026 said they would not (54%). This is stable compared with 2022 (52%) and 2024 (53%).
SP were asked which amenities they thought should be included in SLA to feel like they were getting good value for money. The amenities SP would most like are en-suite provision (75%), enhanced cooking facilities (69%), double beds (67%) and better-quality Wi-Fi (66%). The proportion of SP who would like these amenities is overall significantly lower than 2024, but higher than 2022. However, the top four amenities SP would like is the same as in 2024. The amenities SP were most willing to pay more for in 2026 was a larger room (43%), better-quality Wi-Fi (38%) and en-suite provision (36%) These are the same top three amenities as 2024.
6.1 Figure 6: SP’s awareness of the SLA Defence Minimum Standards (DMS).
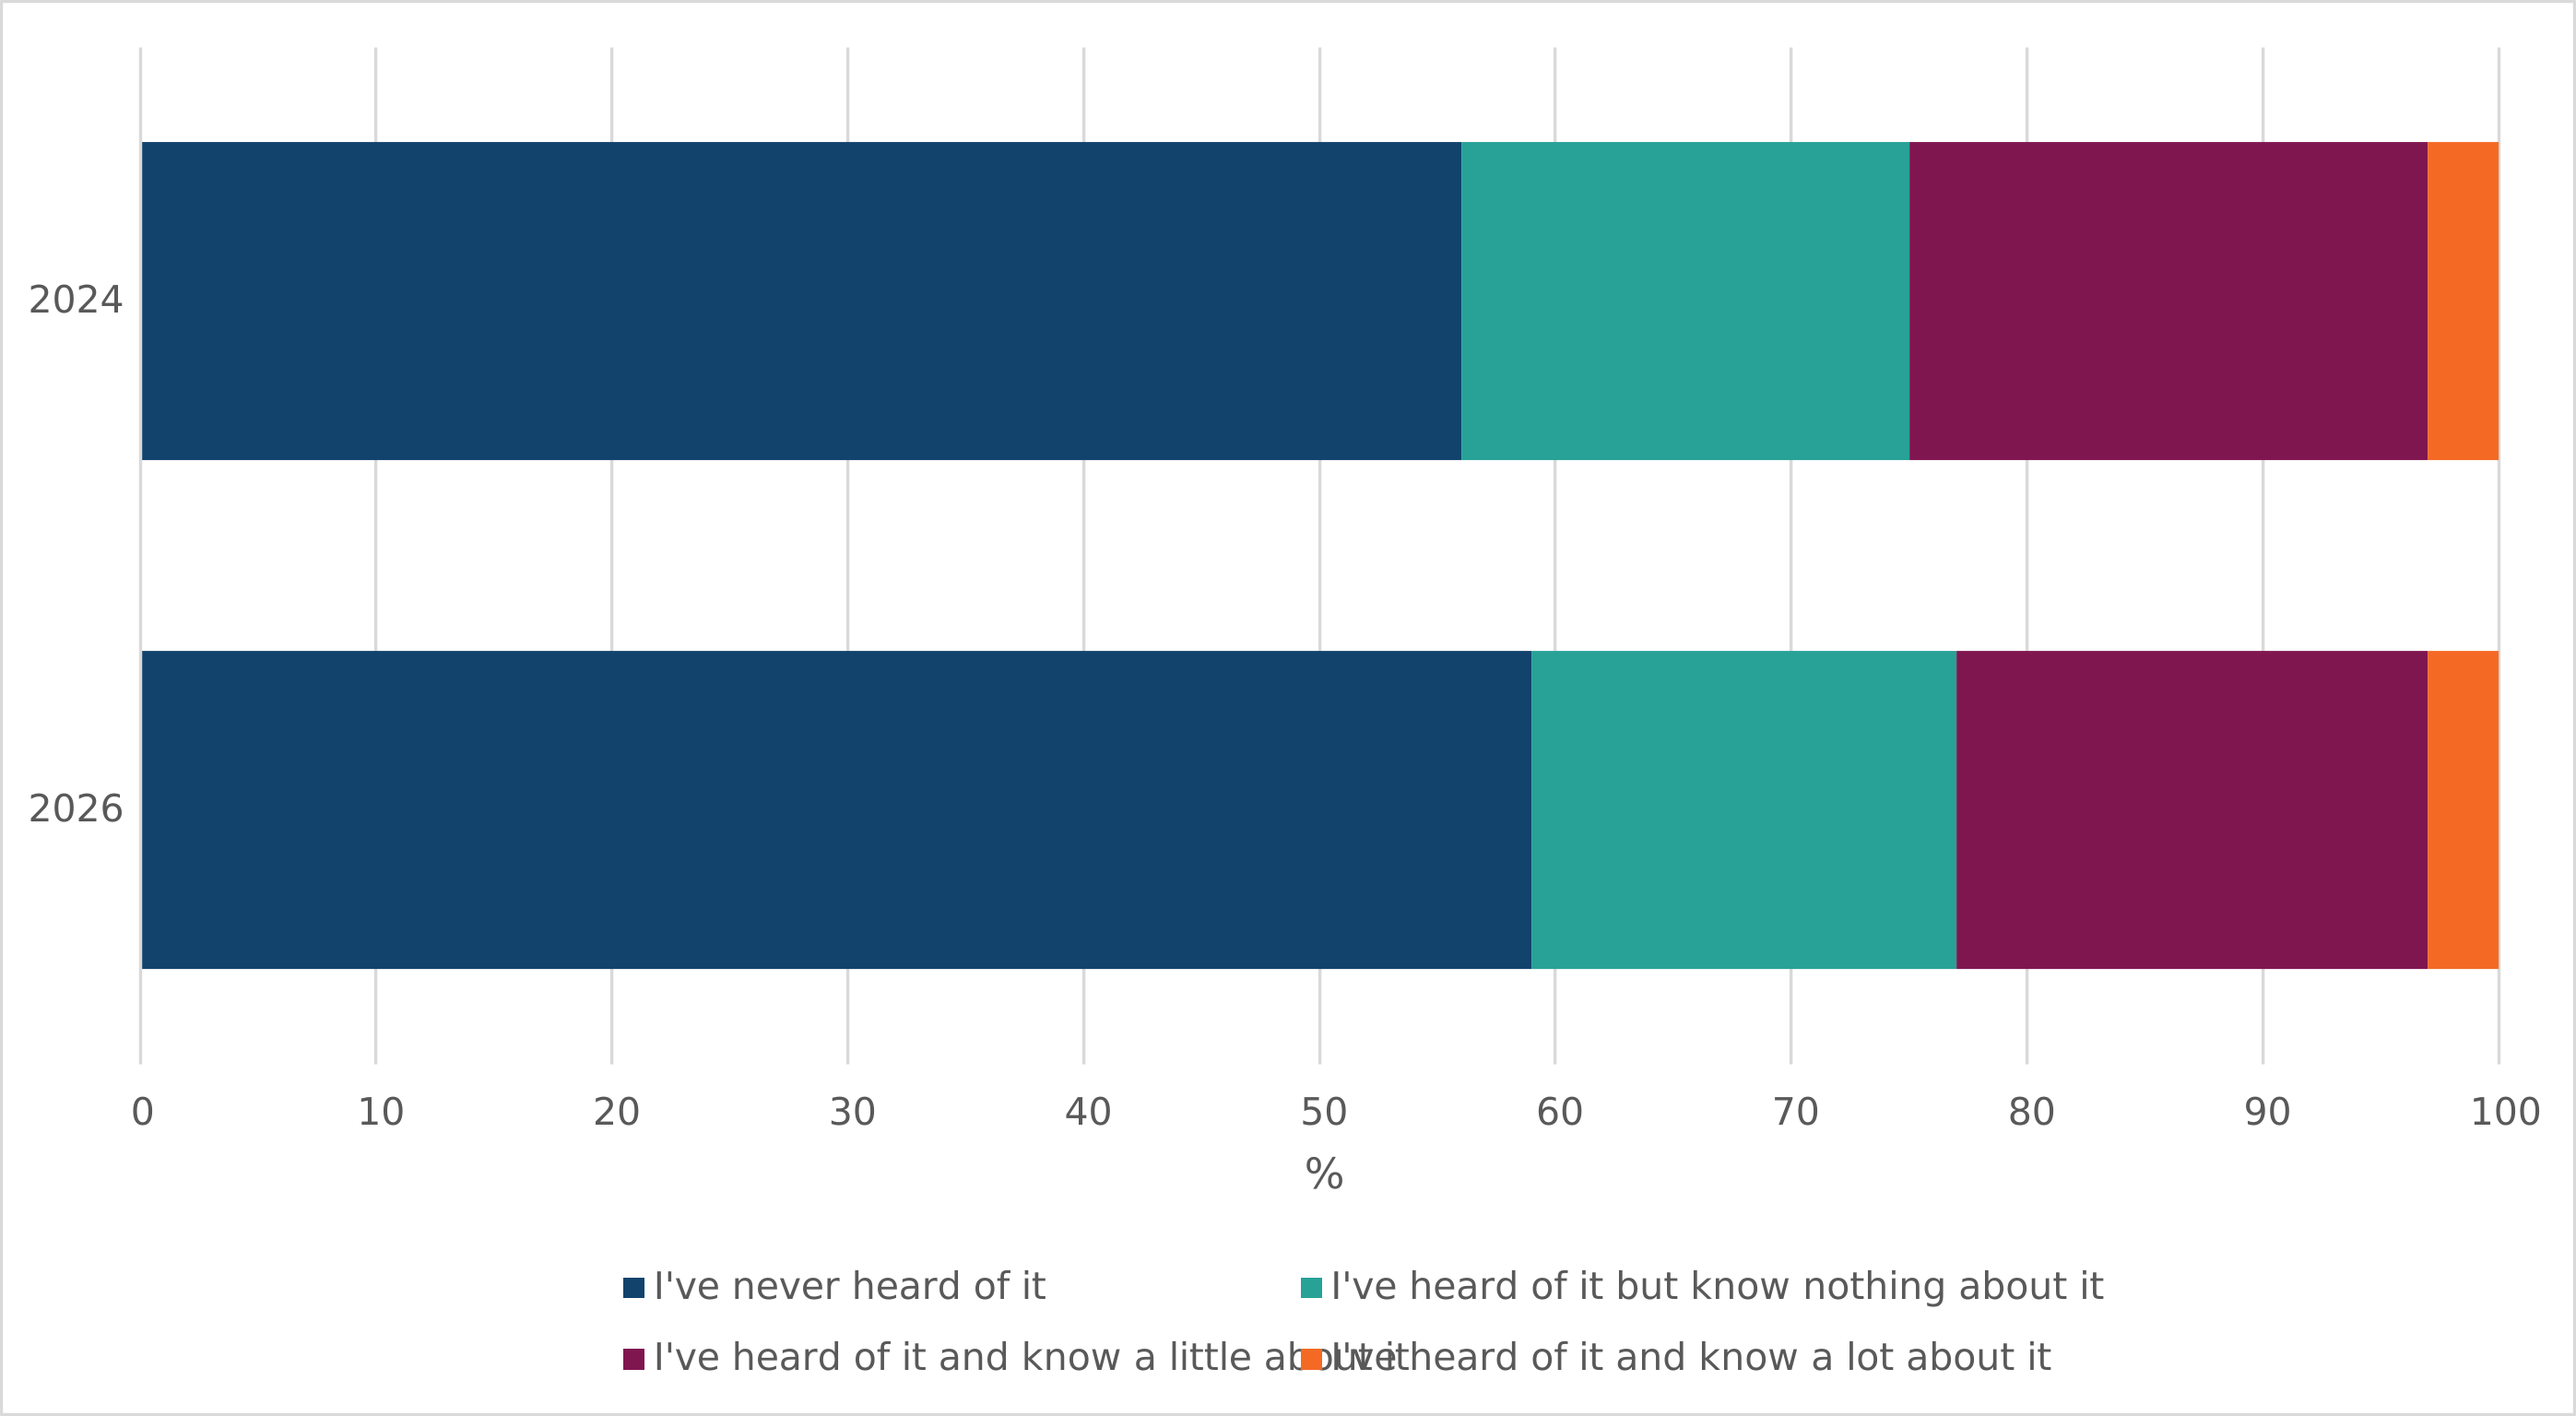
Figure 6 is a bar chart showing awareness of the DMS. The data in this chart is available in Table 48 of the reference tables.
46% of SP disagreed that SLA charges are comparable to private rental accommodation, significantly down from 48% in 2024. 23% of SP were unsure of the cost of renting in the private rental sector, significantly up from 21% in 2024. Awareness of Defence Minimum Standards (DMS) remained low as 59% of SP had never heard of it, significantly up from 56% in 2024. 18% of SP had heard of it but knew nothing about it. 20% had heard of it and knew a little, significantly down from 22% in 2024.
7. Future design of Single Living Accommodation
This section covers what SP would like to see in SLA in the future.
7.1 Figure 7: What facilities and/or services would you want/expect to see in SLA in the future?
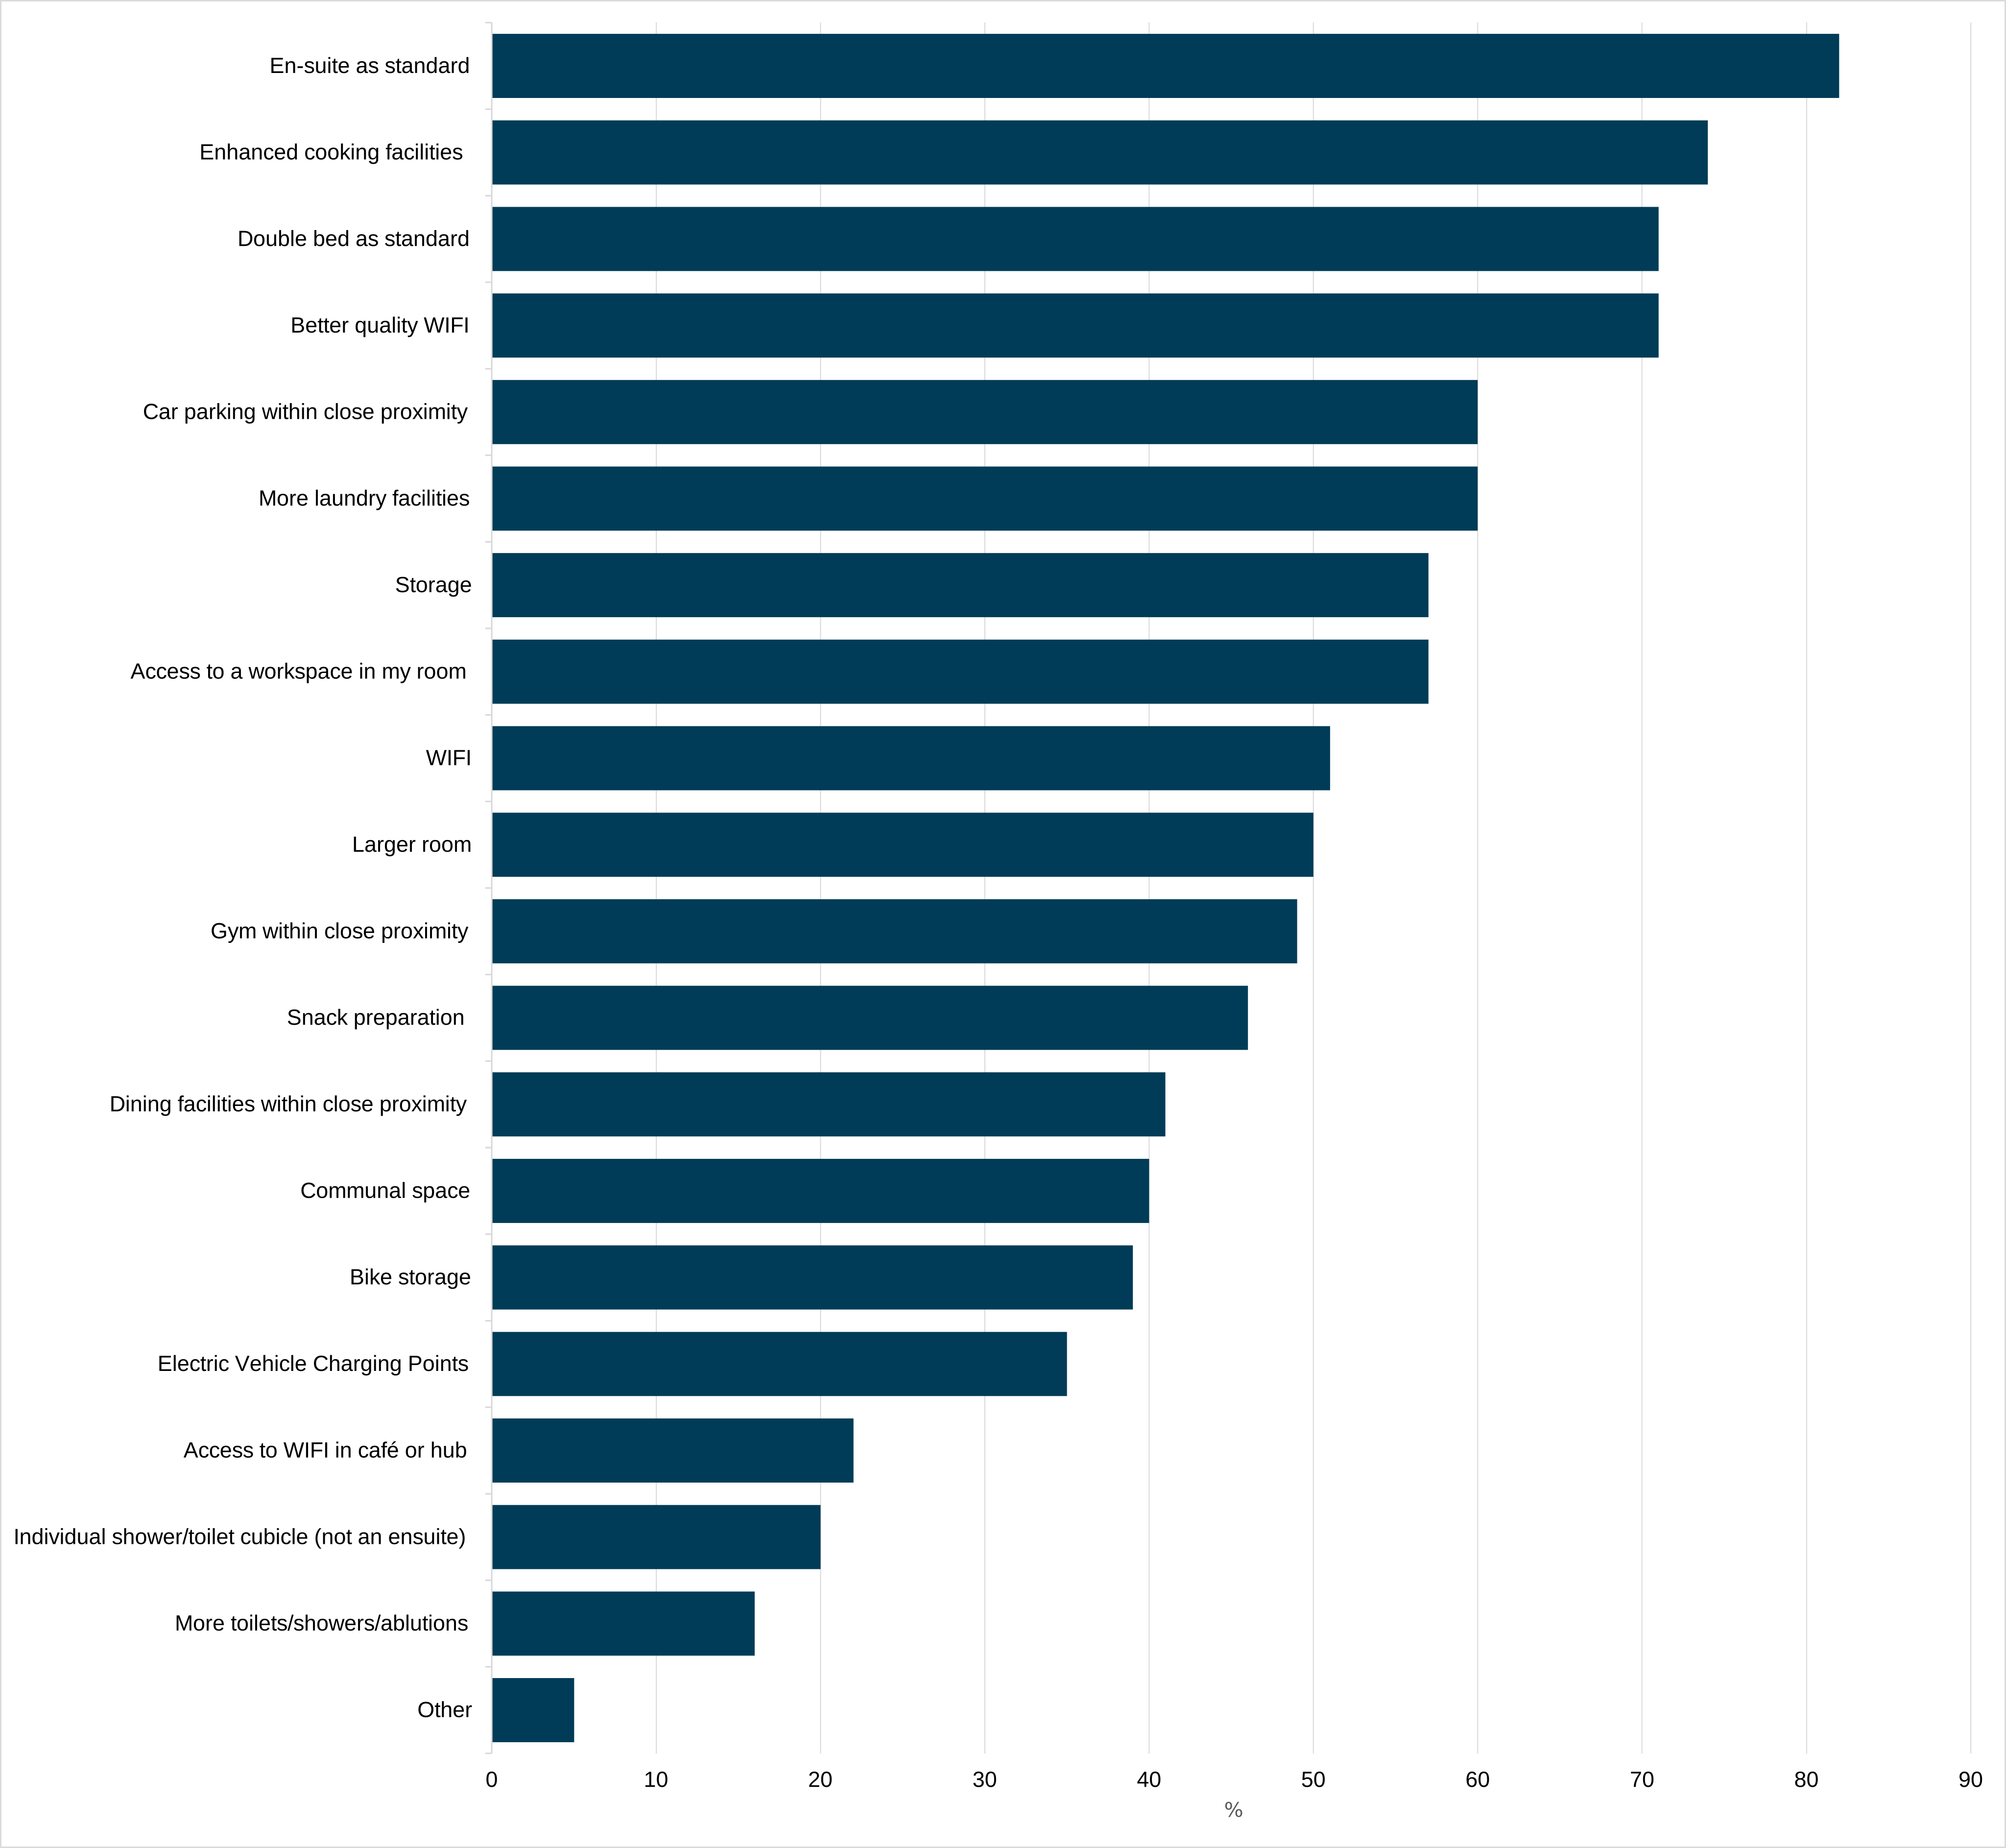
SP were asked what facilities and/or services they would want/expect to see in SLA in the future. Figure 7 is a bar chart of the proportion of SP who selected each facility/service. The data in this chart is available in Table 49 of the reference tables.
Levels of demand for many facilities and services remain higher than in 2022, although some have decreased since 2024. Comparisons with previous years should be treated with caution, as an additional response option, ‘Individual shower/toilet cubicle (not an en-suite)’, was introduced in 2026. This option may have attracted respondents who, in previous years, would have selected related options such as ‘En-suite as standard’ or ‘More toilets/showers/ablutions’. As a result, changes in the proportion selecting these existing options may partly reflect the introduction of the new category rather than a genuine shift in preferences.
The provision of an en-suite remains the facility most wanted or expected by SP (82%). This is followed by enhanced cooking facilities (74%), a double bed (71%) and better quality Wi-Fi (71%). Enhanced cooking facilities and a double bed have consistently ranked among the most selected facilities since 2022.
Compared with Officers, Other Ranks are more likely to want or expect a larger room (56% compared with 32%). In contrast, Officers are more likely than Other Ranks to want dining facilities within proximity (54% compared with 36%), although the proportion of Other Ranks selecting this option has increased by 21 percentage points since 2022.
7.2 Figure 8: Do you feel that SLA should follow a standard design for all or should there be different designs that Service Personnel can opt to pay more for?
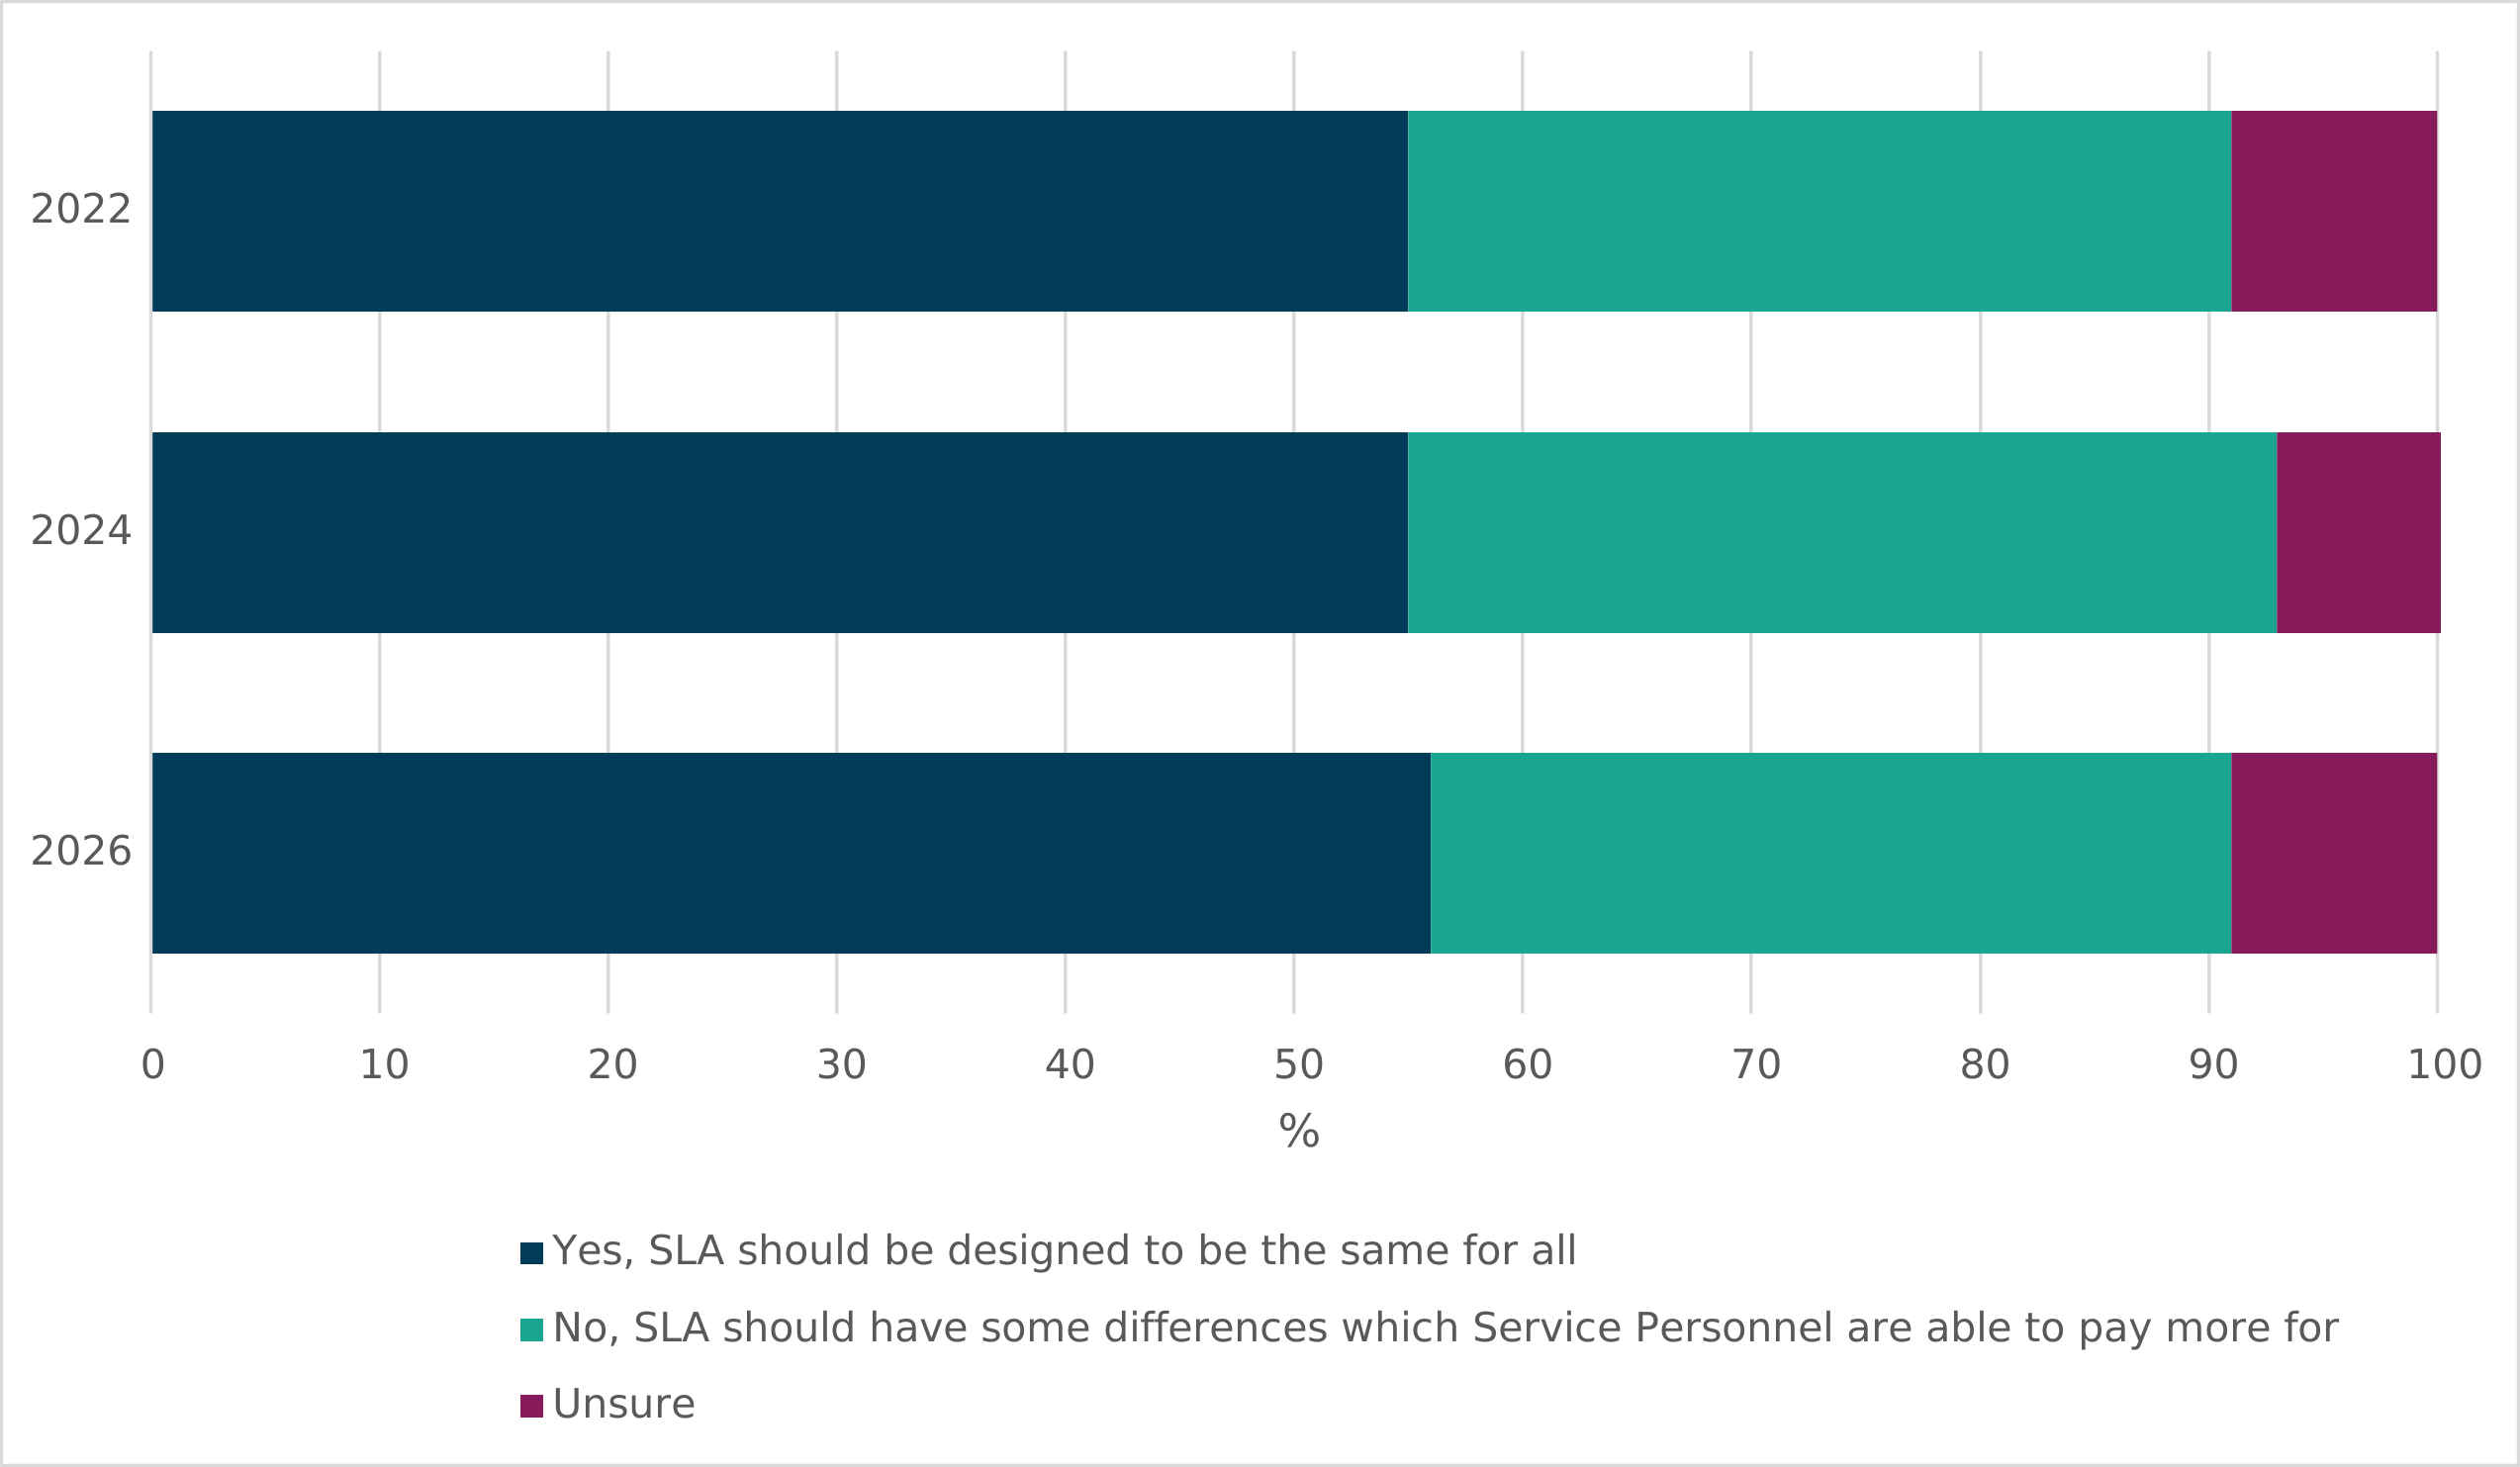
SP were asked if they feel that SLA should follow a standard design for all or whether there should be different designs which SP can opt to pay more for. Figure 8 is a bar chart showing responses to this question from all SP as well as a breakdown of Royal Navy, Army and RAF personnel. The data in this chart is available in Table 50 of the reference tables.
Overall, over half of SP (56%) think that SLA should follow a standard design for all. This has increased from 55% in 2022. 35% of SP think there should be different designs that SP can opt to pay more for. This has decreased from 36% in 2022 and 38% in 2024.
8. Dining
This section covers SP’s views on dining facilities in SLA. Most questions in this section were asked only to respondents who currently live in SLA or have lived in SLA within the last five years.
SP were asked what cooking amenities they have access to and what amenities they would have wanted access to in their current or most recent SLA. Due to changes in the response options and question formatting, comparisons prior to 2024 are not possible.
Ovens were the most requested amenity, with 76% of SP indicating they would like access to one, despite only 15% currently having access. Almost half of SP (48%) reported having access to a hob and 38% reported access to a freezer, 69% and 65% respectively would like access to these amenities.
8.1 Figure 9: SP preferences towards accessing dining facilities in SLA.
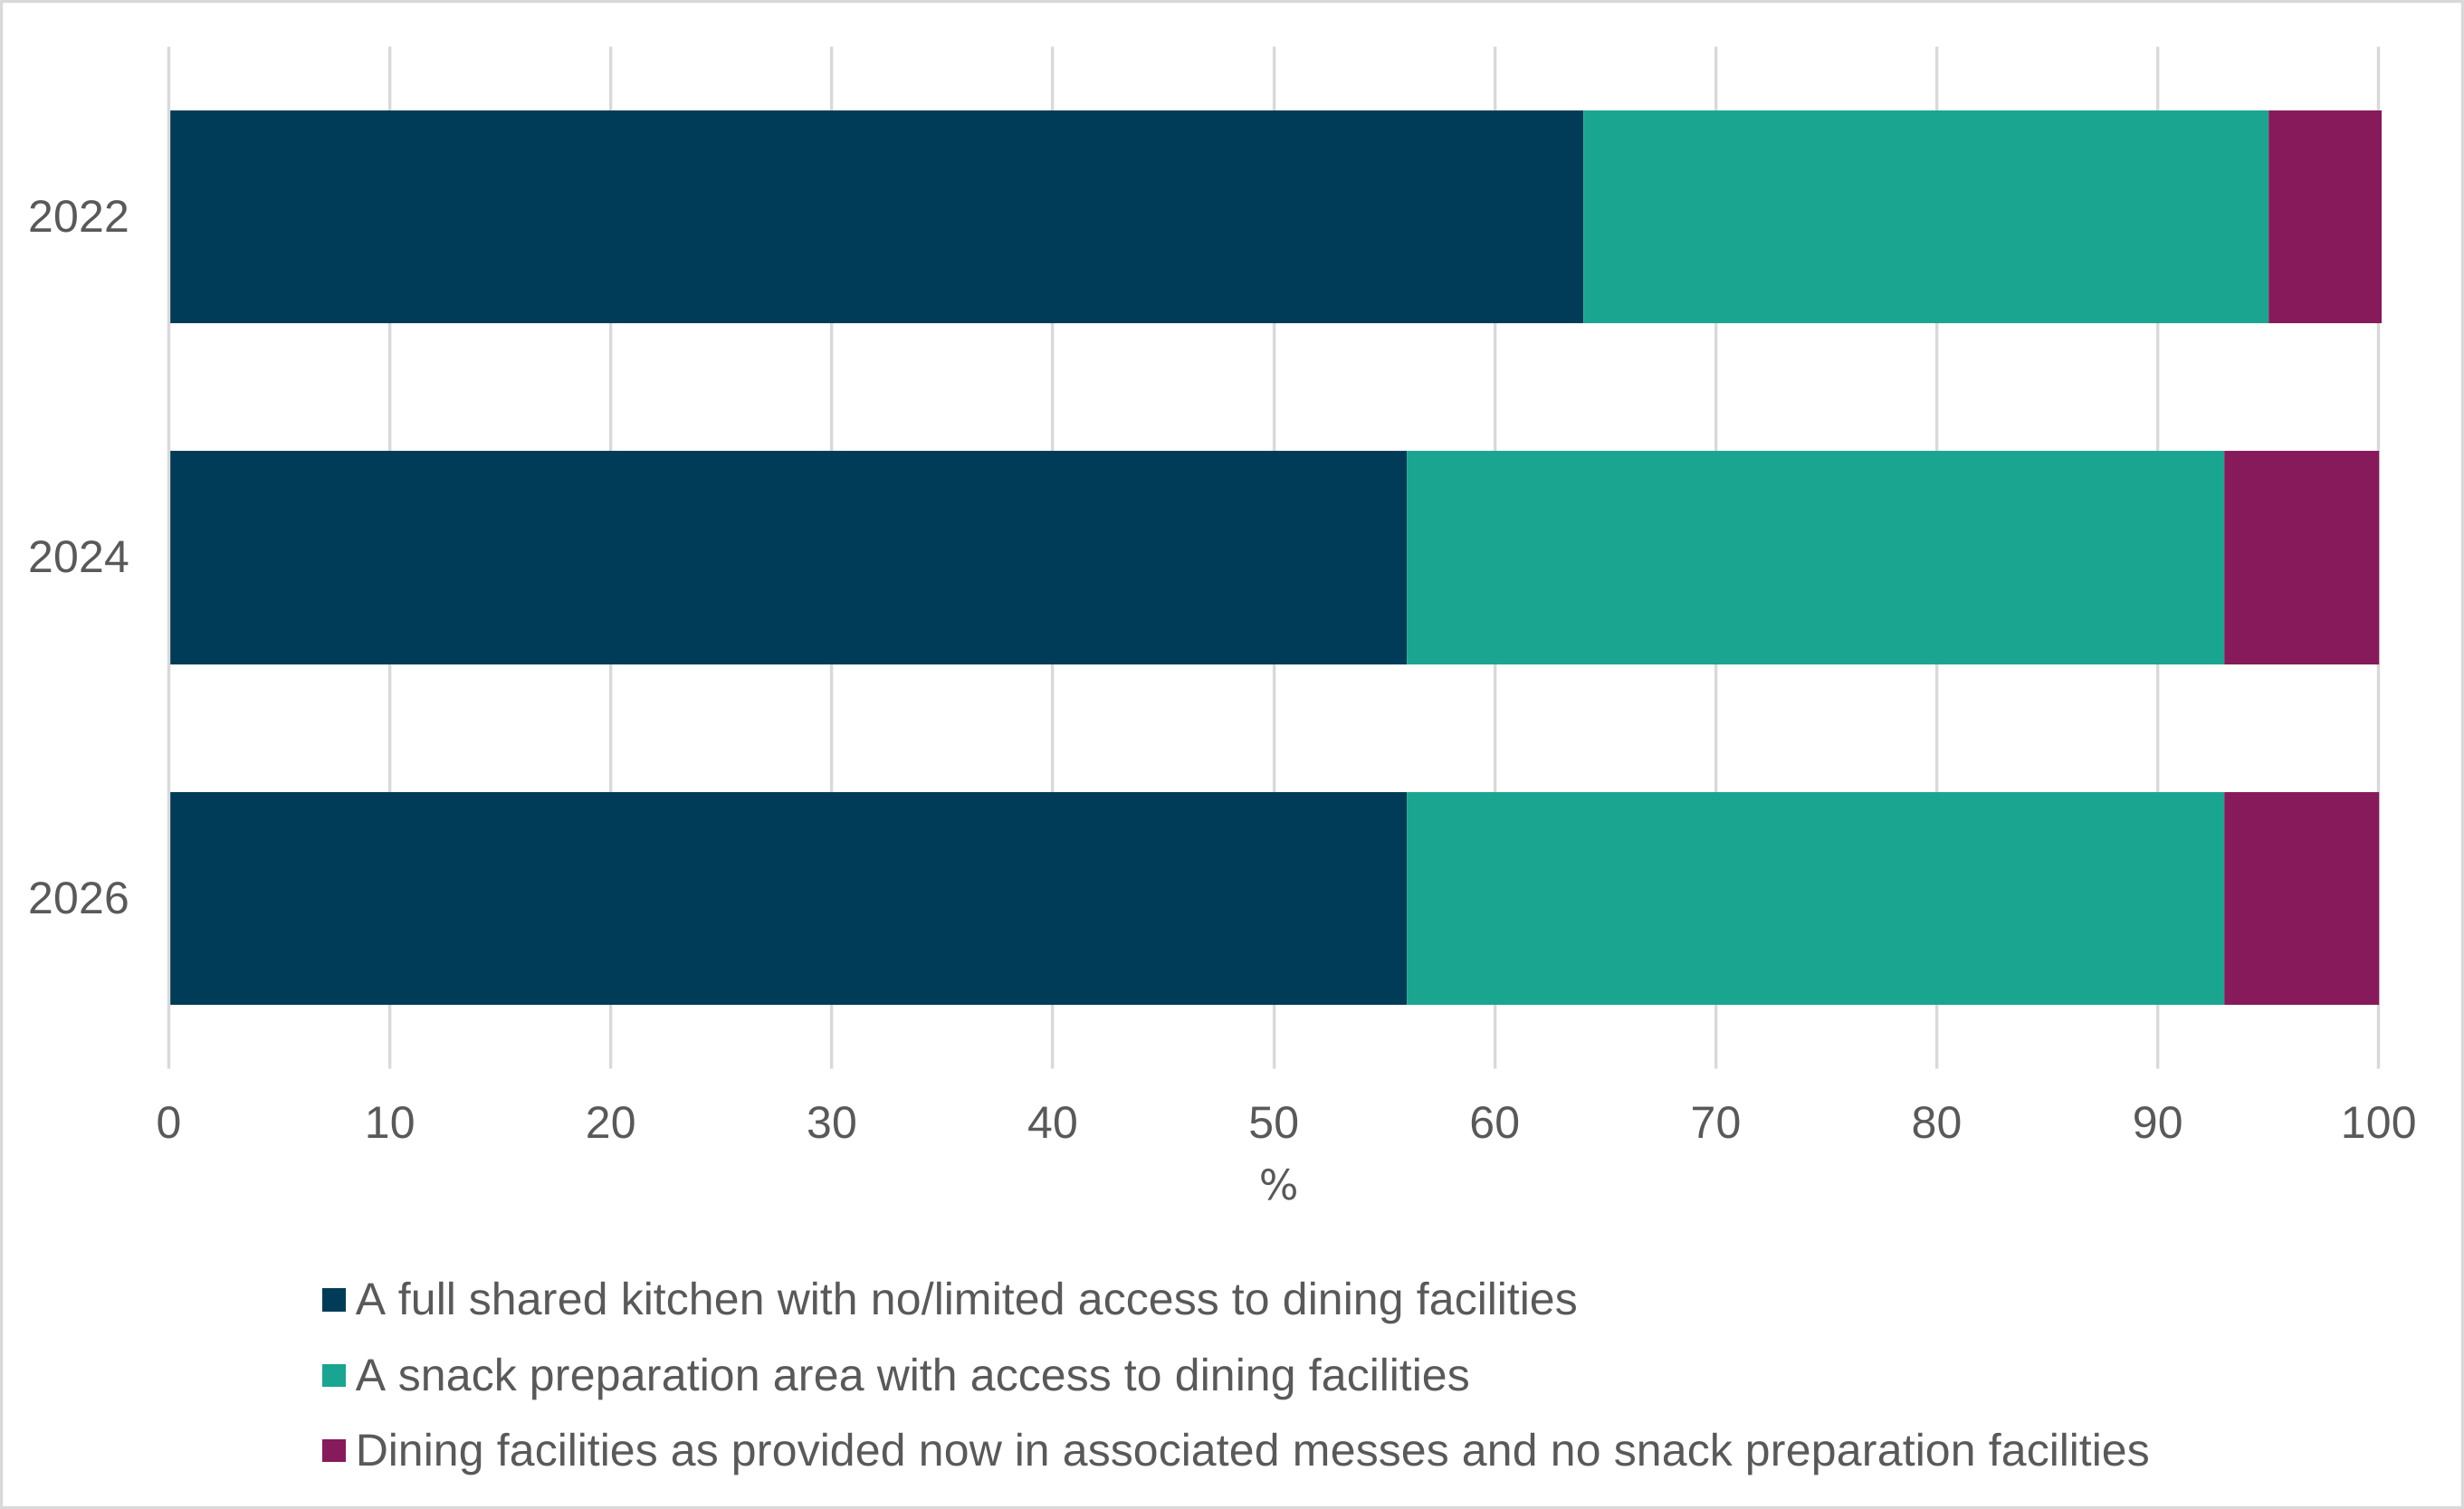
SP were asked if they would prefer a full shared kitchen with no/limited access to dining facilities, a snack preparation area with access to dining facilities, or dining facilities as provided now in associated messes and no snack preparation facilities. Figure 9 is a bar chart comparing responses from SP between 2022, 2024 and 2026. The data in this chart is available in Table 53 of the reference tables.
If given the choice, just over half of SP (55%) would prefer a full shared kitchen with no/limited access to dining facilities. Whilst this remains the most popular option, preference for a full shared kitchen has fallen significantly since 2022 (64%). Other Ranks (61%) are more likely than Officers (36%) to want a full shared kitchen. 37% of SP would prefer a snack preparation area with access to dining facilities, unchanged from 2024 but higher than in 2022 (31%). 7% of SP would choose to rely solely on dining facilities with no snack preparation area.
Among those who would prefer a full shared kitchen, ease of cooking was the most common reason (82%), followed by suitability for shift patterns 40% and the ability to accommodate a specialist diet (39%). Among those who would prefer a snack preparation area with access to dining facilities, ease of cooking was the most selected reason (60%), followed by hygiene issues associated with current shared facilities (41%) and suitability for shift patterns (40%). SP who would prefer dining facilities as currently provided, hygiene issues with current shared facilities were the most selected reason (54%).
The proportion of SP who think the provision of a full kitchen is important in temporary SLA has decreased significantly from 71% in 2022 to 67% in 2026. However, the proportion who think a full kitchen is not important remains unchanged from both 2022 and 2024 (15%). Other Ranks (71%) are more likely to view a full kitchen as important than Officers (55%). The proportion of SP who think that a snack preparation area is important in temporary SLA remains high at 83%, with no statistically significant change since 2024.
38% of SP currently make use of dining facilities available at their base to purchase and eat meals, broadly consistent with 2022 (36%) and 2024 (38%) levels, and the same proportion of SP sometimes use dining facilities (38%). 24% of SP do not currently make use of dining facilities available at their base to purchase and eat meals. The proportion of Other Ranks that make use of dining facilities in SLA has increased to 36% compared to 2022 (33%) and 2024 (34%). However, the proportion of Officers who make use of dining facilities has decreased from 49% in 2024 to 45% in 2026. This may not reflect actual usage of dining facilities.
Of the SP who make use of dining facilities, the majority (63%) do so because of convenience. This represents a statistically significant increase of 10 percentage points since 2022 but remains unchanged since 2024. It is slightly higher for Officers (68%) than Other Ranks (62%), this stayed consistent to 2024.
The quality of food is the most common reason why SP do not make use of dining facilities (79%), followed by choice of food (74%). More Other Ranks do not use dining facilities compared to Officers because of the quality of food (81% compared with 75%) and choice of food (75% compared with 70%). Officers are considerably more likely than Other Ranks to avoid using dining facilities because they prefer not to wear formal dress (61% compared with 22%) and do not want to have to book mealtimes in advance (46% compared with 24%). This remains consistent with 2024 levels.
9. Hosting Children in SLA
This section covers hosting child(ren) in SLA. Questions in this section were asked only to respondents who reported they had child(ren) who they shared parental responsibility for and whose main home was elsewhere. This was a new section for 2026.
20% of respondents reported they had child(ren) they shared parental responsibility for whose main home was elsewhere. This was slightly lower for Royal Air Force (16%) than Royal Navy (24%) and Army (20%) and broadly equivalent between Officers (22%) and Other Ranks (20%).
It should be noted that as only a small proportion of survey participants were eligible to answer some questions in this section, the number of responses for the following questions were very low (range is 439 to 581 responses). As such, caution is advised when interpreting the following results and users should note the level of uncertainty in the numbers published in the data tables.
Of the 20% of respondents with child(ren) they shared parental responsibility for, 22% had used SLA to host their child(ren) in the previous 12 months. This was slightly lower for Royal Navy (16%) than Army (24%) and Royal Air Force (24%). 56% of respondents stated their child(ren) did not visit them in SLA, 9% had used a local hotel to host their child(ren), 6% had been able to access a local welfare/contact house/flat provided by their Service or a charity and 15% stated they had another property elsewhere they could use.
9.1 Figure 10: On average, how many nights per month do you (or did you) host these children which you share parental responsibility for?
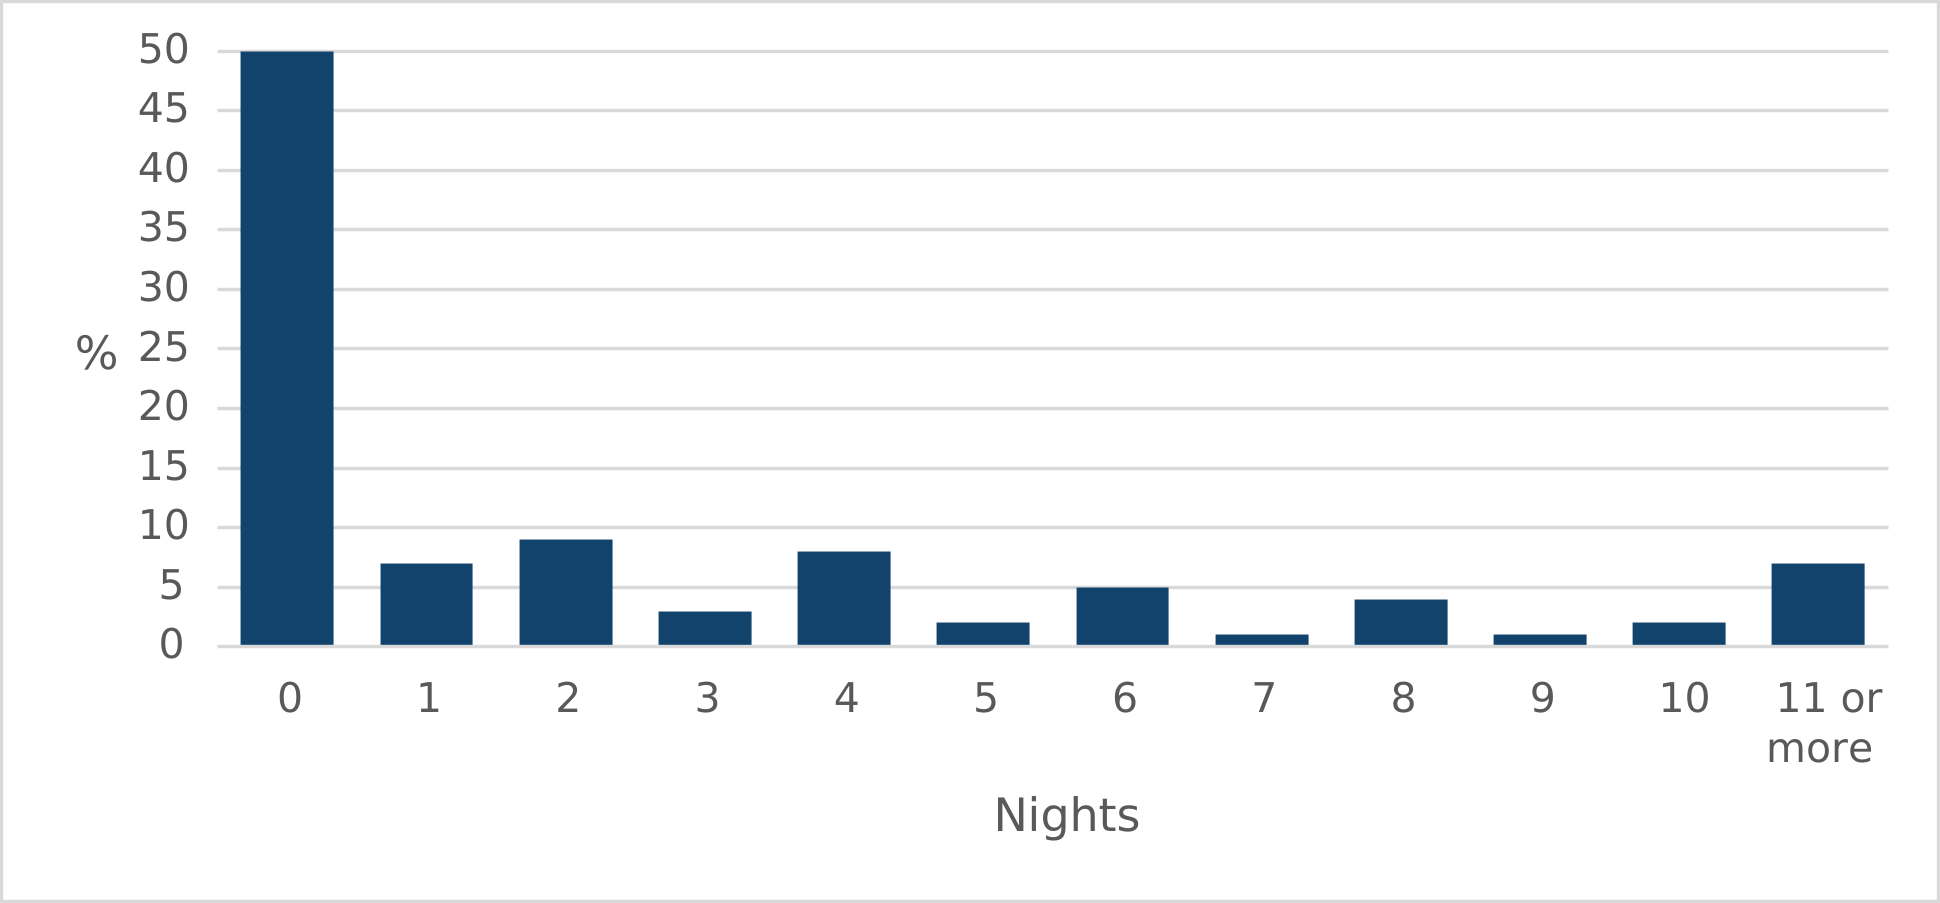
Figure 10 is a bar chart which shows on average, the number of nights per month SP hosted children in their SLA. Respondents reported that in an average month, they had hosted children in their SLA for the following a number of nights; 0 nights (50%), 1 night (7%), 2 nights (9%), 3 nights (3%), 4 nights (8%), 5 nights (2%), 6 nights (5%), 7 nights (1%), 8 nights (4%), 9 nights (1%), 10 nights (2%) and 11 or more nights (7%). The data in this chart is available in Table 66 of the reference tables.
11% of respondents stated they agreed their SLA was suitable to host child(ren). 77% disagreed that SLA was suitable (12% were neutral).
When asked why this was, the primary reasons provided were a lack of suitable sleeping facilities in SLA (86%), inappropriateness of a shared living environment in SLA (62%), lack of cooking/messing facilities in SLA (58%) and lack of child outdoor friendly spaces on military base (51%).
10. Safety
This section covers SP’s views on physical safety in SLA and whether respondents have ever made a complaint about their SLA. This was a new section for 2026.
In the survey question SF1, respondents were asked to select any fault or repair issues they had experienced but were also provided with an additional response option, “I have not experienced any faults/repair issues within my SLA”. During analysis it was noticed some respondents had selected both that they had not experienced faults/repair issues and any faults/repair issues they had experienced. In response to this, new tables were derived to calculate the percentage of respondents who had experienced at least one fault/repair and those who had not. Therefore, the percentage who selected they had not experienced a fault/repair may differ between the derived and non-derived tables.
A similar issue was found with questions SF2 and SF3 and estimates have been derived to calculate the percentage of personnel reporting at least one aspect related to the design of their bedroom/cabin that had made them feel unsafe in the last 12 months and the percentage of personnel reporting at least one aspect related to the design of the communal facilities in SLA that had made them feel unsafe in the last 12 months. Figures generated from the derived tables are indicated with an *.
SP were asked if they had experienced any faults or repair issues within their SLA in the last 12 months. 83%* reported they had experienced a fault or repair issue within their SLA. This figure was the similar across the Ranks (Officer, 82% and Other Ranks 83%) and three Services: (Royal Navy 85%, Army 81% and RAF 87%*).
10.1 Figure 11: In the last 12 months, have you experienced any of the following faults/repair issues within you SLA?
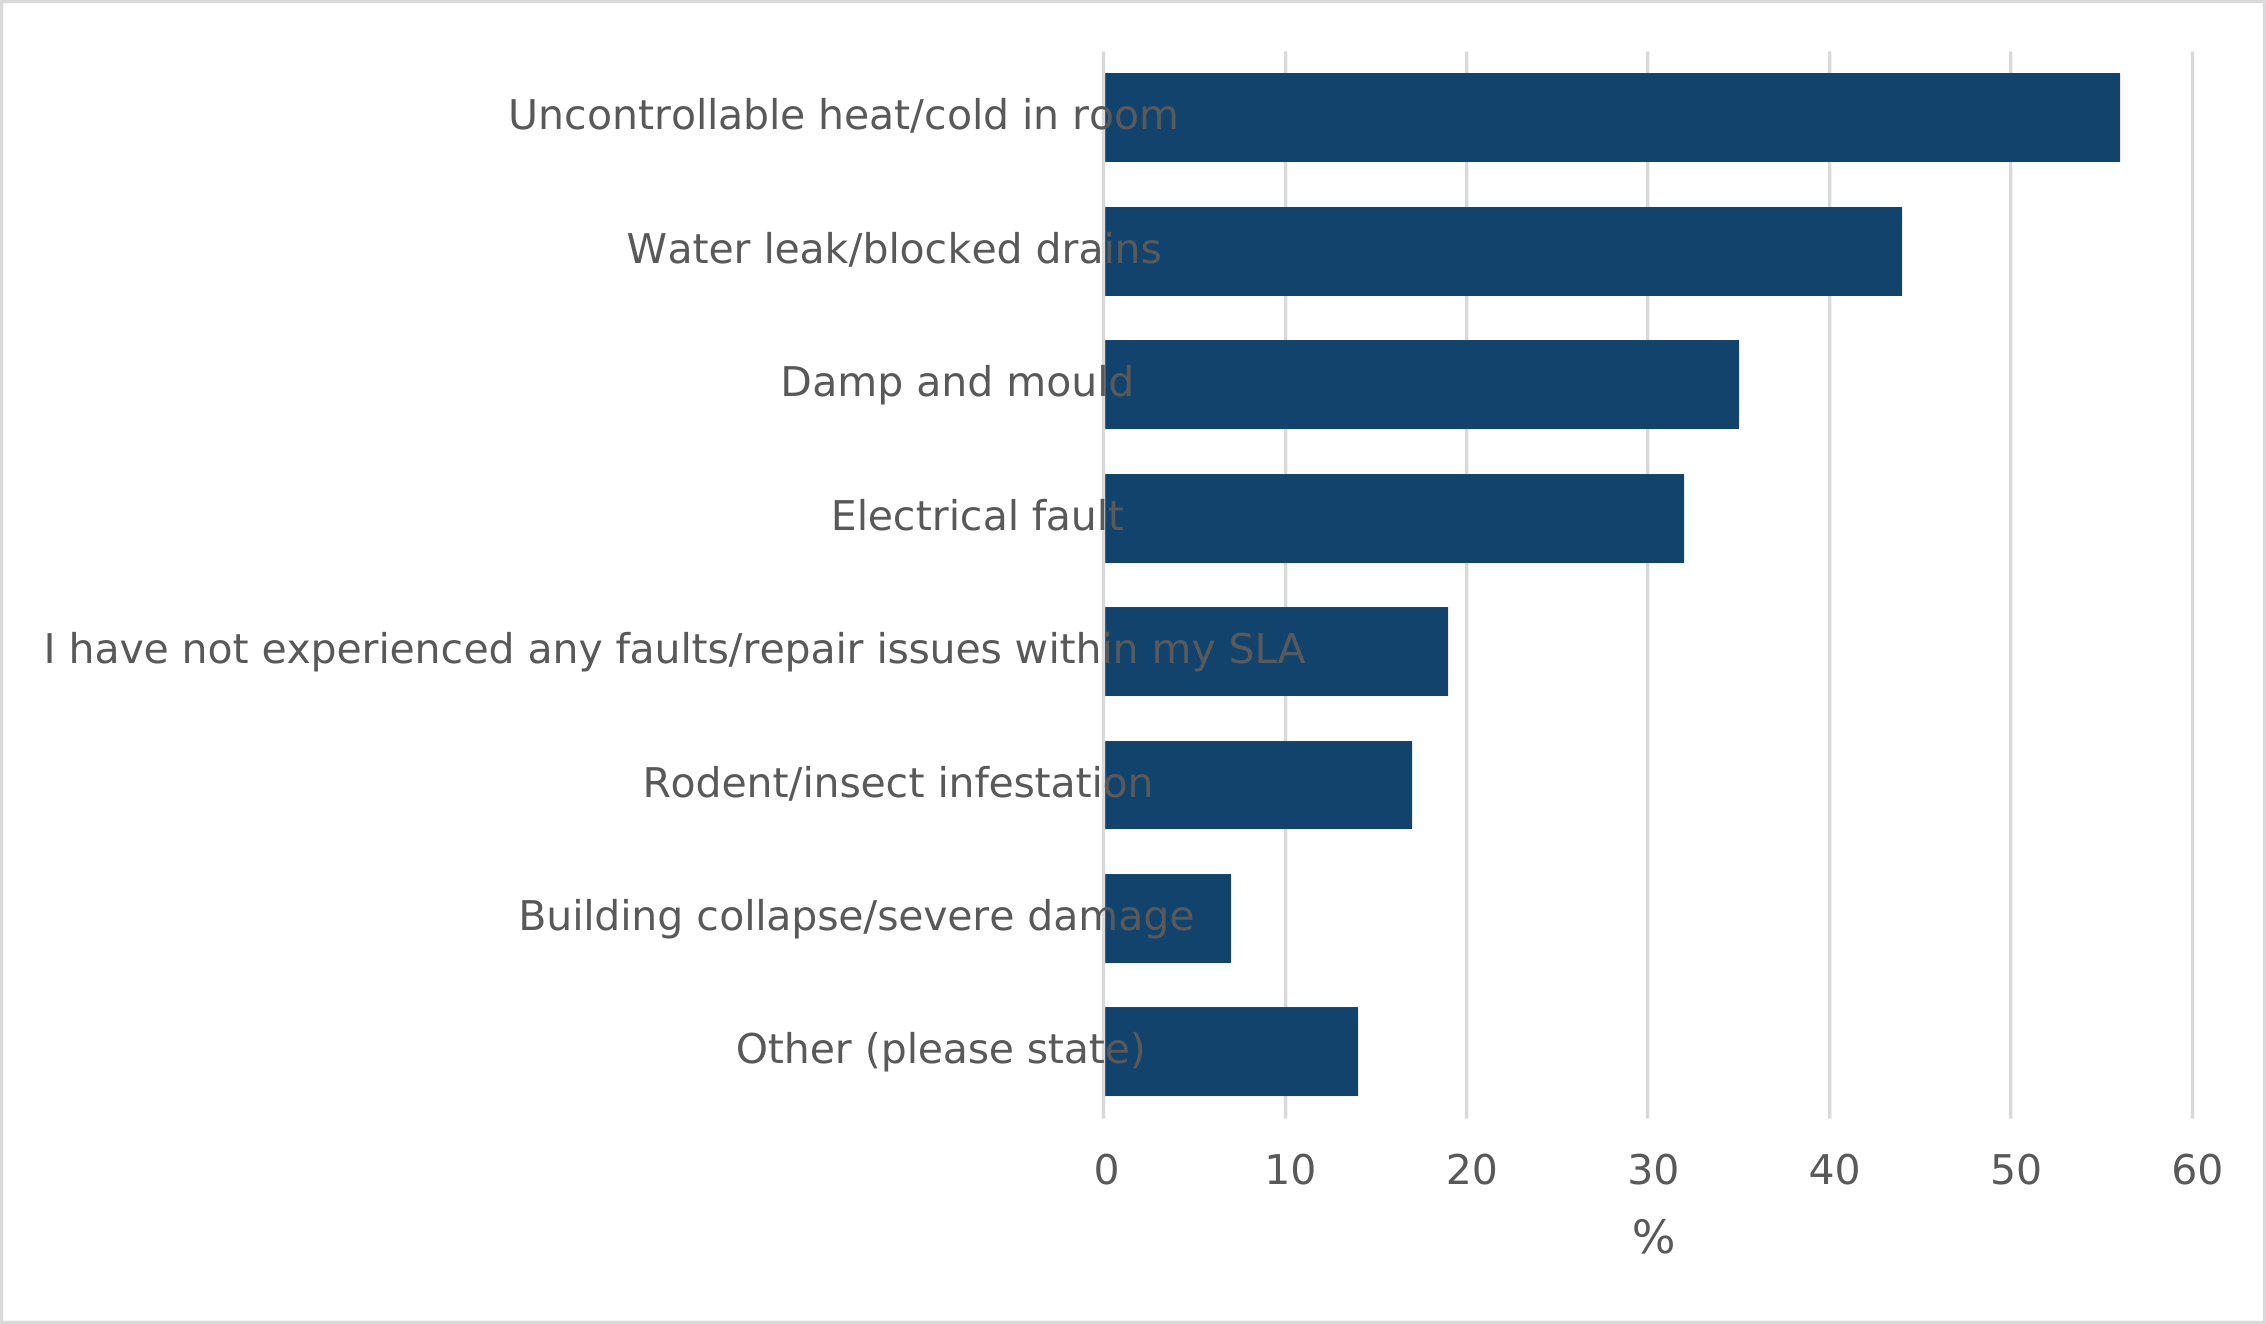
Figure 11 is a bar chart which shows the faults and repairs issues experienced by SP in their SLA. The primary faults or repairs experienced by respondents were uncontrollable heat/cold in a room (56%), water leak/blocked drains (44%), damp and mould (35%) and electrical fault (32%). These were the four most frequently cited faults/repairs amongst all three Services. The data in this chart is available in Table 69 of the reference tables.
SP were asked if they had ever felt unsafe due to aspects related to the design of their bedroom or cabin in SLA. Just under half of respondents (45%) reported that in the last 12 months they had felt unsafe due to aspects related to the design of their bedroom or cabin. This was slightly higher amongst Other Ranks (47%) than Officers (40%) and similar across Services (Royal Navy 43%, Army 45%* and RAF 48%*).
10.2 Figure 12: In the last 12 months, have you ever felt unsafe due to the following aspects related to the design of your bedroom/cabin in SLA?
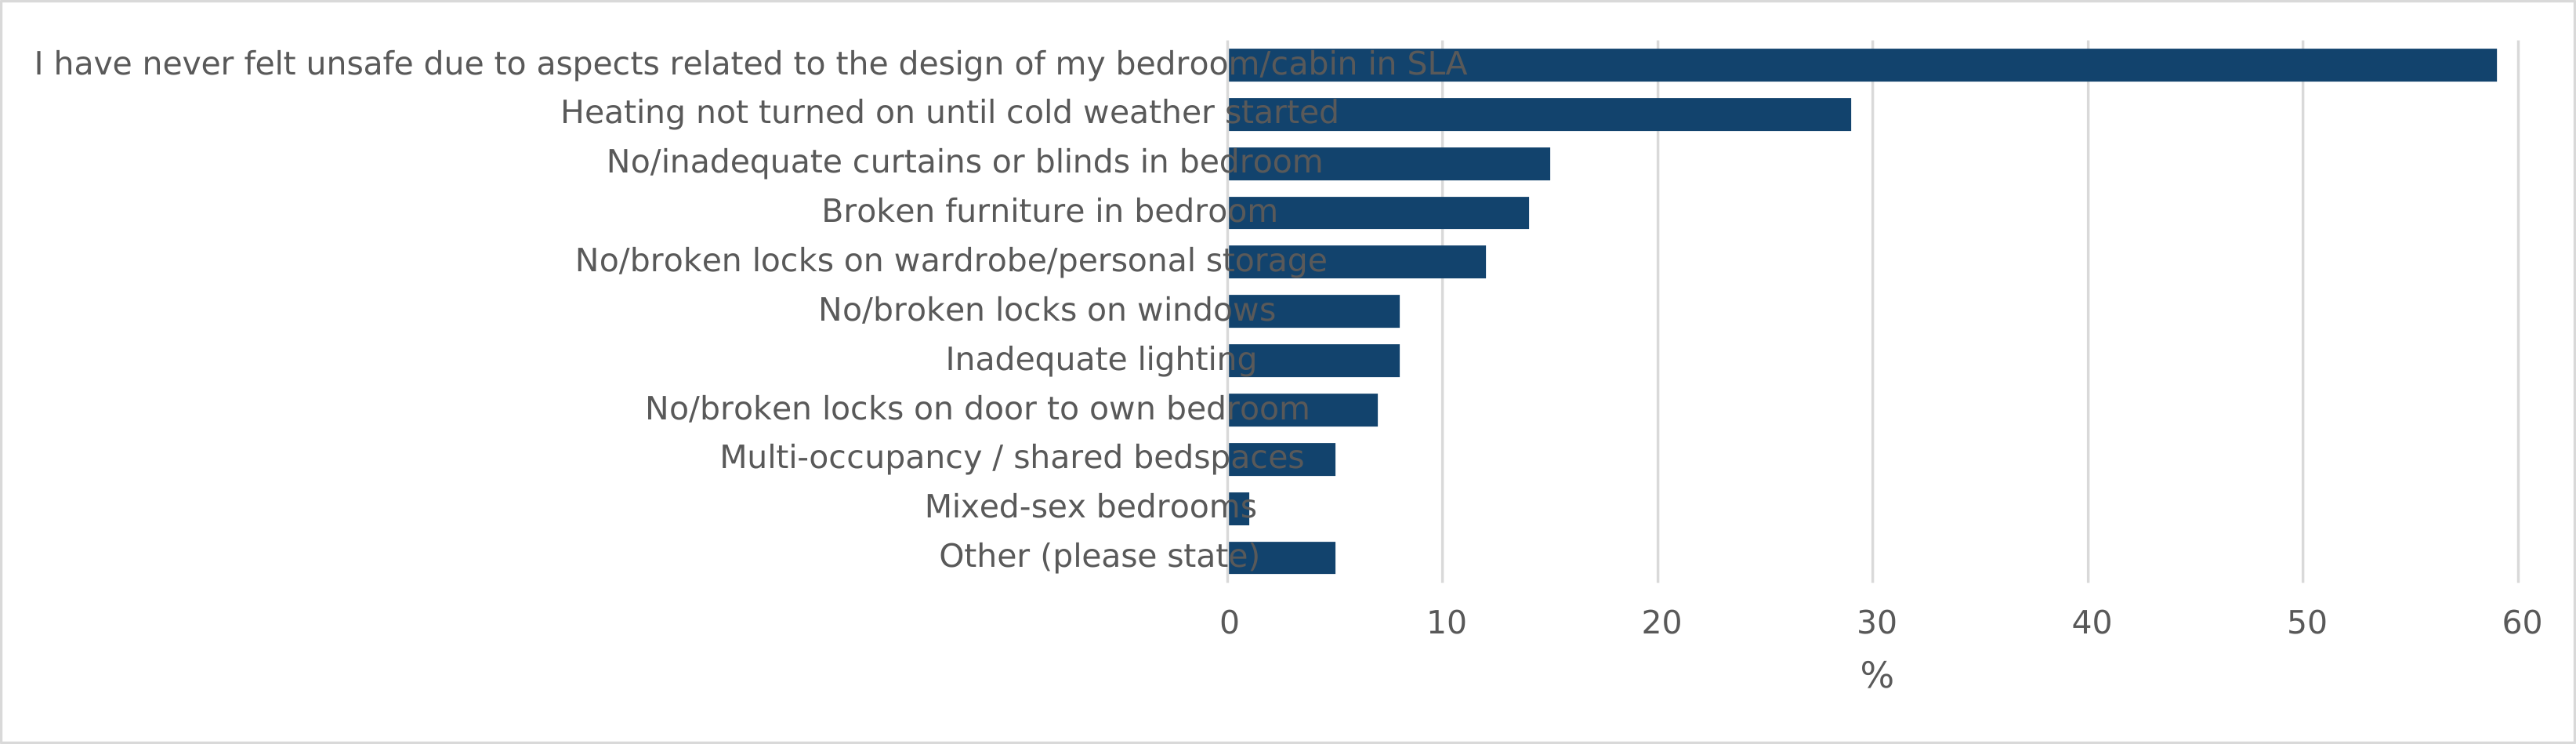
Figure 12 is a bar chart which shows reasons that SP have felt unsafe due to aspects related to the design of their bedroom or cabin in SLA. The most common reason listed for feeling unsafe was heating not turned on until cold weather started (29%). Other reasons listed included no/inadequate curtains or blinds in bedroom (15%), broken furniture in bedroom (14%) and no/broken locks on wardrobe/personal storage (12%). The data in this chart is available in Table 70 of the reference tables.
SP were asked whether they had ever felt unsafe due to aspects related to the design of the communal facilities in SLA. Around one third (30%) reported that in the last 12 months they had felt unsafe due to aspects related to the design of communal facilities, this was broadly the same across the ranks (Officer, 26% and Other Ranks 31%*). Reasons provided for feeling unsafe due to the design of communal facilities included, inadequate lighting in ablutions, communal spaces, stairwell and kitchen areas (9%), broken furniture in communal areas (9%), shared building access codes (8%) and no/broken locks on access to corridors/buildings (8%).
When asked in the last 12 months to what extent had respondents received prior notice of routine room inspections 12% reported “never”, 36% reported “sometimes” and 30% reported “always”. 23% stated they had not had a routine room inspection in the last 12 months.
When asked in the last 12 months to what extent they had received prior notice of routine maintenance or repairs being undertaken 23% reported “never”, 47% reported “sometimes” and 20% reported “always”. 9% stated they had not had any routine maintenance or repairs to their SLA in the last 12 months.
33% of respondents had made a complaint about their SLA in the last 12 months. Of those who had made a complaint, the main subject of these were general maintenance not completed (60%), unsatisfactory standard of repair to SLA (45%) and failure to achieve repair/works services in the contractual target time (36%).
Of those who reported they had not made a complaint the primary reason for this was they did not have an issue to complain about (64%). 20% of respondents reported that they did not expect the issue to be resolved in a timely manner and 10% reported that they did not know who to make the complaint to.
11. Unacceptable behaviours
This section covers SP’s experience of bullying, harassment and discrimination and unacceptable behaviours in SLA. These questions were included as no other surveys ask about unacceptable behaviour occurring specifically in SLA.
The MOD conducts the Armed Forces Sexualised Behaviours and Sexual Harassment Survey (SBSHS) and Armed Forces Continuous Attitude Survey (AFCAS) which ask questions about SP experiences and perceptions of unacceptable behaviour in the Armed Forces. It is not possible to draw a direct comparison between results from these surveys and this survey due to differences in questionnaire design, definitions used and sample frame. Further information can be found in the Background Quality Report.
In the survey question U1, respondents were asked to select any unacceptable behaviours that had caused them to feel unsafe but were also provided with an additional response option, “I have never felt unsafe in my SLA due to unacceptable behaviour”. As with questions SF1, SF2 and SF3 it was noticed during analysis that some respondents had selected both that they had never felt unsafe as the result of unacceptable behaviour and some unacceptable behaviours that had caused them to feel unsafe. In response to this a new table was derived to calculate the percentage of respondents who had selected at least one unacceptable behaviour from the list and those who had not. Therefore, the percentage who selected that had never felt unsafe due to unacceptable behaviour may differ from the derived and non-derived table. Figures generated from the derived tables are indicated with an *.
SP were asked whether in the last 12 months if they had felt unsafe in their SLA. 16%* of respondents reported they had felt unsafe in their SLA due to unacceptable behaviours. This was slightly higher for RAF (21%) than Army (15%) or Royal Navy (15%). Other Ranks were slightly more likely to have felt unsafe (18%) compared to Officers (12%). This difference was most apparent between Royal Navy Officers (9%) and Royal Navy Other Ranks (18%*).
The prevalence of experiencing unacceptable behaviours amongst all respondents who answered question U1 (n = 2805) were as follows: unannounced/forced entry of a contractor/industry Partner into their ro]om (8%), anti-social behaviour (7%), unannounced/forced entry of other Service person into their room (3%), bullying (1%), harassment of a non-sexual nature (1%), sexual harassment (1%), discrimination (1%) and unacceptable sexual behaviour (1%).
Of those who had experienced unacceptable behaviours in the last 12 months, 20% had made a formal complaint. Those in the Army were more likely to have made a formal complaint (21%) than RAF respondents (17%) or Royal Navy respondents (19%).
11.1 Figure 13: If you did not make a formal complaint, why was this?
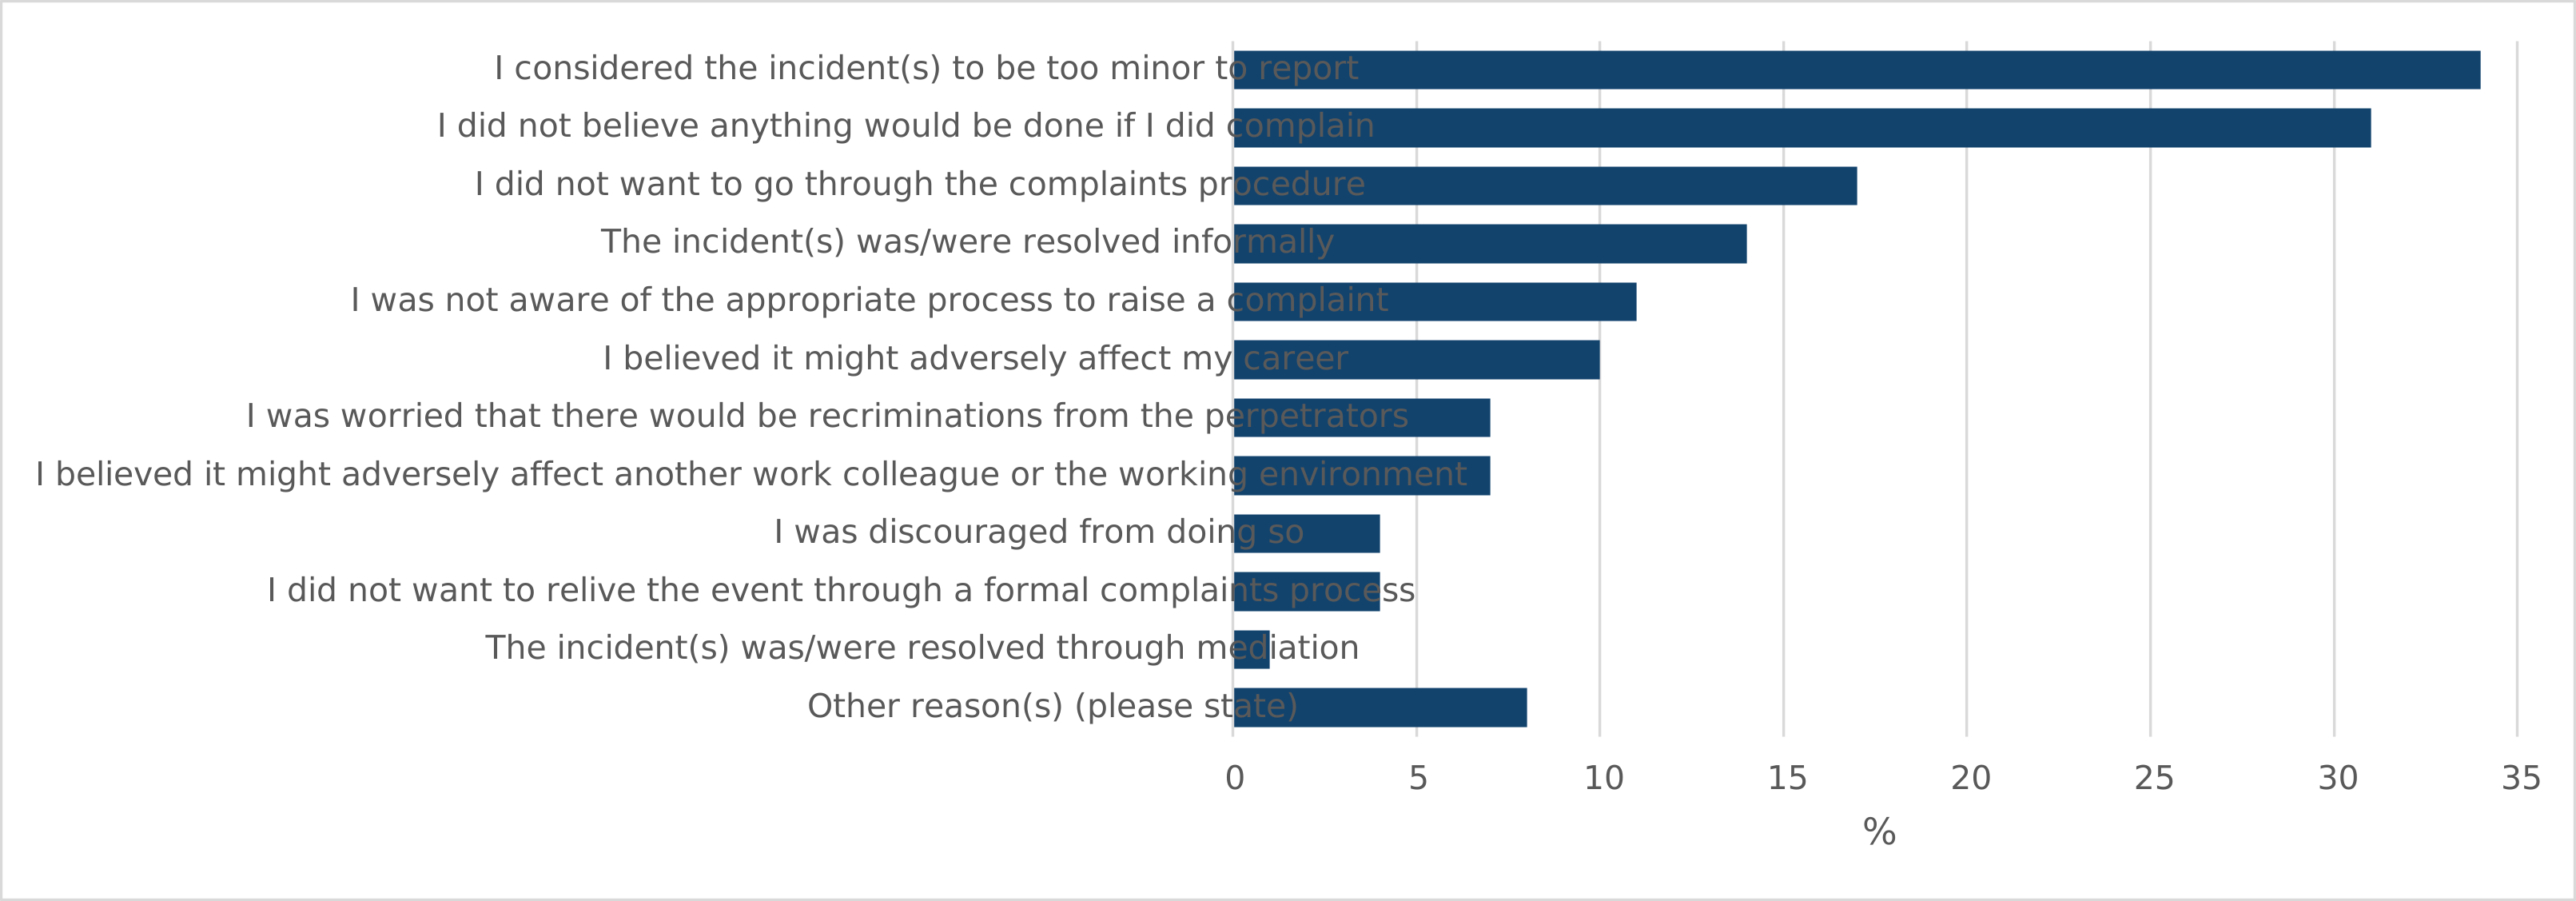
Figure 13 is a bar chart which shows the reasons why some Service Personnel had not made a formal complaint when they experienced unacceptable behaviours. Of those that did not make a formal complaint the primary reasons given were “I considered the incident too minor to report” (34%), I did not believe anything would be done if I did complain (31%), “I did not want to go through the complaints procedure” (17%) and “the incident(s) was/were resolved informally” (14%). The data in this chart is available in Table 79 of the reference tables.
These four reasons were the most common across Services but there was some variation in the percentage distribution of these responses. Of those that had not made a formal complaint, “I considered the incident too minor to report” was most common reason in the Royal Navy responses (42%) compared to Army (32%) and RAF (33%). 32% of Army respondents reported that they did not believe anything would be done if they did complain compared to Royal Navy (26%) and RAF (35%).
12. Overall assessment of Single Living Accommodation
12.1 Figure 14: Overall, which of the following would you consider to be most important to you regarding SLA?
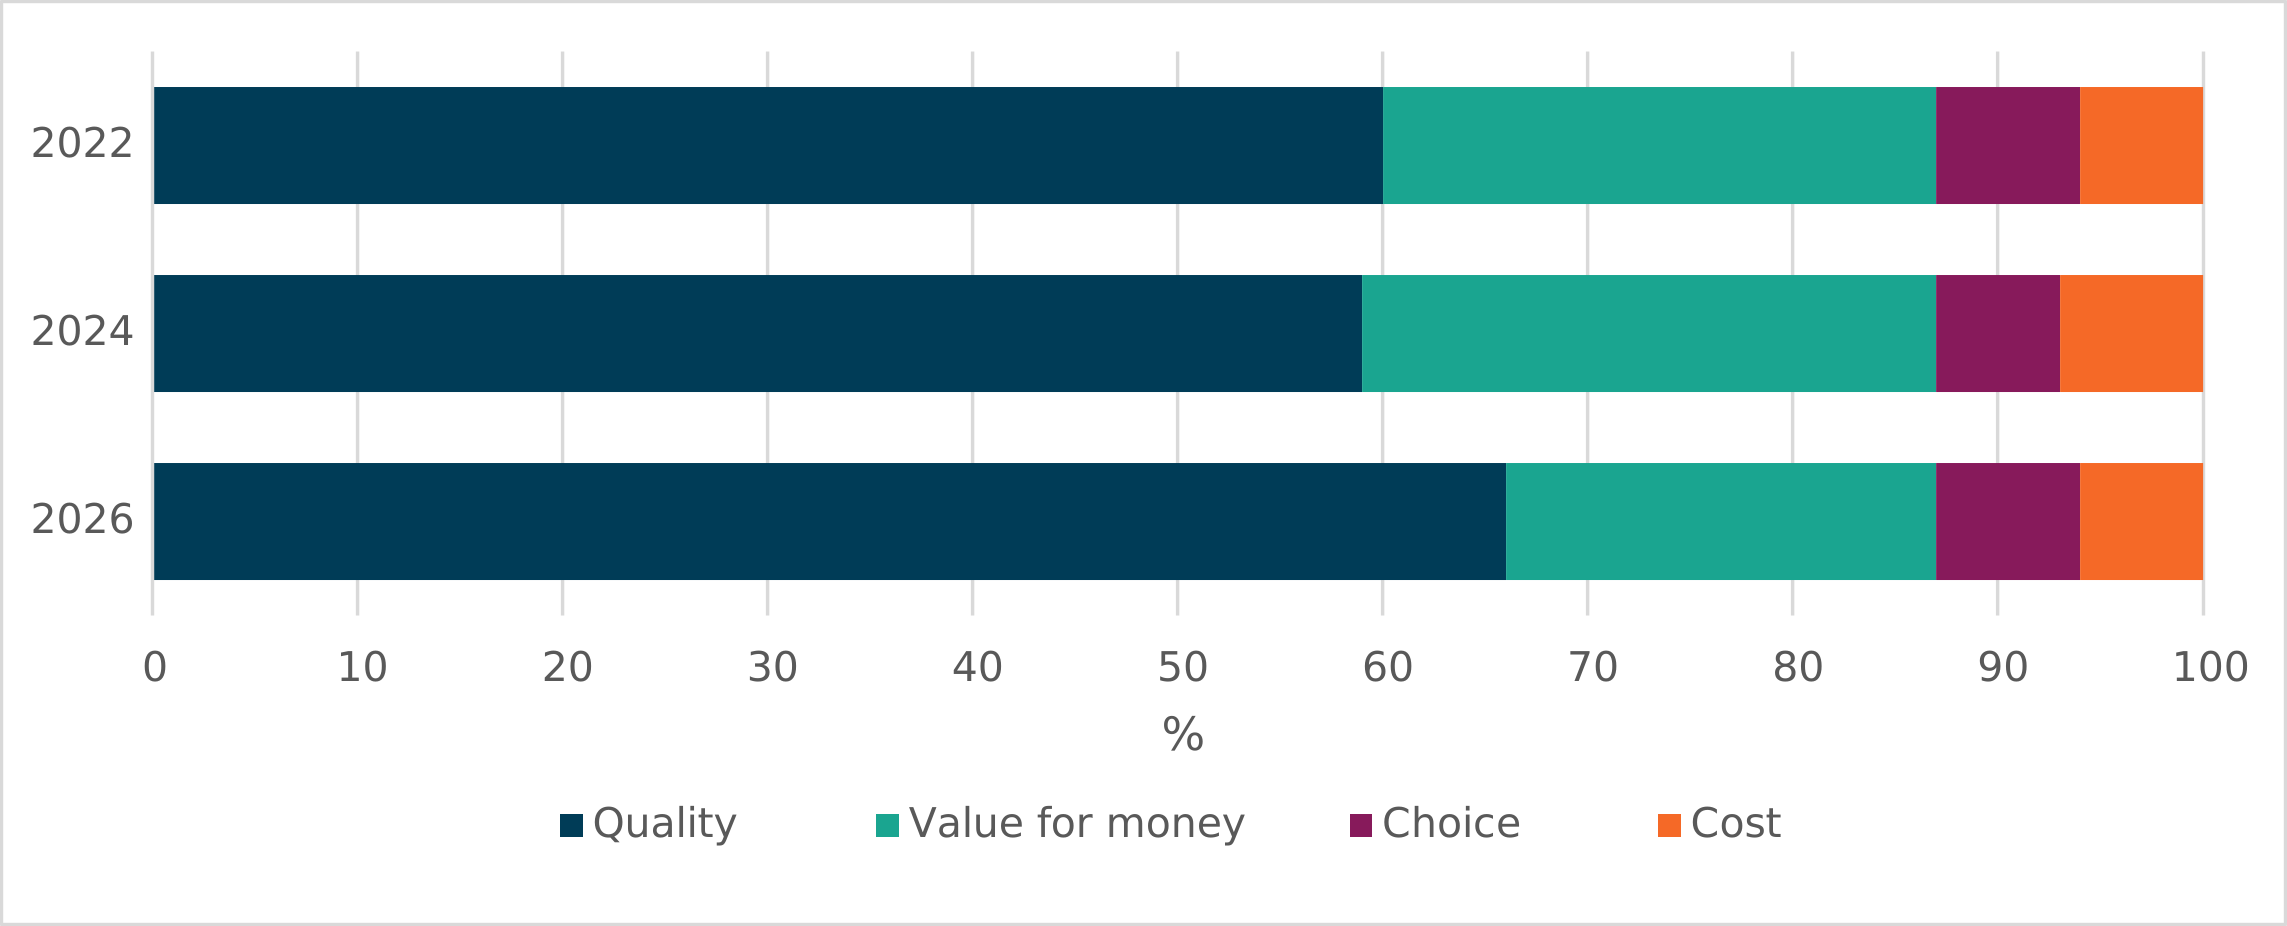
SP were asked whether quality, choice, cost, or value for money was most important to them regarding their SLA. Figure 14 is a bar chart showing the proportion of SP who selected each option to this question. The data in this chart is available in Table 80 of the reference tables.
Overall, quality is considered the most important factor regarding SLA (66%) of SP, while 21% identify value for money as most important. These findings are broadly consistent with those reported in 2024 (quality, 59% and value for money, 28%) and 2022 (quality, 60% and value for money, 27%).
Similarly, Other Ranks (69%) are more likely than Officers (58%) to prioritise quality. In contrast, Officers are more likely to place greater emphasis on value for money, although the proportion doing so has fallen from 37% in 2024 to 28% in 2026. Among Other Ranks, 19% selected value for money as their most important consideration.
13. Methodology
This section provides a summary of the methodology; more detailed information is available in the in the Background Quality Report.
13.1 Target population
The target population for the SLA Lived Experience Survey 2026 was all SP in the UK Armed Forces. This included UK Regulars and Reserves.
13.2 The survey
The survey was distributed as an online survey only. Survey participation was publicised internally to SP using a variety of established communications channels. For example weekly routine orders, Defence Connect and social media platforms were used to publicise the survey.
Data collection ran from 13th April 2026 to 15th May 2026. The survey was anonymous.
13.3 The sample and respondents
The survey was conducted as a census to ensure all SP had the opportunity to participate.
Overall, 5,722 survey responses were received. After data cleaning there were 4,721 valid survey responses used in the analysis giving a response rate of 2.2%.
The population figures for weighting were derived from MOD Quarterly SP statistics 2026.
13.4 Table 1: Response rates by Service and rank
| Service | Rank | Total Population | Surveys returned | Response rate (%) |
|---|---|---|---|---|
| Tri-Service | Officers | 51858 | 1239 | 2.4 |
| Tri-Service | Other Rank | 161485 | 3482 | 2.2 |
| Tri-Service | Total | 213343 | 4721 | 2.2 |
| Royal Navy | Officer | 13354 | 419 | 3.1 |
| Royal Navy | Other Rank | 32126 | 589 | 1.8 |
| Royal Navy | Total | 45480 | 1008 | 2.2 |
| Army | Officer | 28094 | 422 | 1.5 |
| Army | Other Rank | 97863 | 2093 | 2.1 |
| Army | Total | 125957 | 2515 | 2 |
| Royal Air Force | Officer | 10410 | 398 | 3.8 |
| Royal Air Force | Other Rank | 31496 | 800 | 2.5 |
| Royal Air Force | Total | 41906 | 1198 | 2.9 |
13.5 Weighting methodology and non-response
Due to the survey being conducted as a census and the differences in prevalence of non-response between the Service and rank strata, the distribution of characteristics amongst the respondents did not reflect the distribution in the whole Armed Forces population.
To account for the bias caused by over or under-representation of certain Services and Ranks, responses were weighted by Service and rank. Weighting in this way assumes missing data are missing at random only within weighting classes. This means we assume that within a single weighting class the views of non-respondents do not differ (on average) to the views of respondents.
To calculate the weighted proportion of combined classes (e.g., Army), the weighted proportions of each sub-class (e.g., Army Officers and Army Other Ranks) were summed. The weighted proportions for each sub class were calculated by multiplying the unweighted proportion of the sub-class with the weight (W) for that sub-class, such that:
W = Population for sub-class / Total class population
13.6 Analysis and statistical tests
Attitudinal questions in the questionnaire have been regrouped to assist in analysing results and to aid interpretation. For example, questions asked at a 5-point level (for example: Strongly Agree – Agree – Neither Agree nor Disagree – Disagree – Strongly Disagree) have been regrouped to a 3-point level (for example: Agree – Neutral – Disagree).
Missing values, where respondents have not provided a response/valid response, have not been included in the analysis. As a result, the unweighted counts (or ‘n’) will vary from question to question, and these are shown within the reference tables published alongside this report on the SLA Lived Experience Survey GOV.UK webpage.
Unless otherwise specified, “Don’t know” and “Not applicable” responses are ignored, and proportions are based only on the numbers of respondents who chose the remaining item response options.
Where applicable, Z-tests at a 5% alpha level were used to test whether observed estimated were significantly different to estimates from the previous survey. A statistically significant difference means there is enough evidence that the change observed is unlikely to be due to chance variation (less than 5% probability that the difference is the result of chance alone).
Proportions are calculated from unrounded data and presented as whole numbers. Charts have been produced from unrounded data.
13.7 Format of the reference tables
Reference tables are published separately to the report on the SLA Lived Experience Survey GOV.UK webpage. Each reference table refers to a question asked in the survey and includes estimates of the proportion of the population by category.
Tables are arranged in the order in which they were asked in the questionnaire, which may be different from the order of the sections in the Main Report.
14. Glossary
Defence Minimum Standard (DMS): A standard which all SLA must pass to be considered habitable for SP. To meet the DMS, the SLA building must meet the safety and compliance standards, achieve a Facilities Condition Management (FCM) grade 3 (Fair), and the bed space must achieve a pass in all statements of the living standards assessment.
Missing at Random (MAR): Statistical theory that states that those who did not respond to a question do not differ from those who did respond.
Missing Value(s): Refers to the situation where a respondent has not submitted an answer or a valid answer to a question.
Ministry of Defence (MOD): The United Kingdom government department and headquarters of the UK Armed Forces, responsible for the development and implementation of government defence policy. The principal objective of the MOD is to protect the security, independence and interests of the United Kingdom at home and abroad. The MOD also manages day to day running of the Armed Forces, contingency planning and defence procurement.
Officer: An Officer is a member of the UK Armed Forces holding the King’s Commission to lead and command elements of the forces. Officers form the middle and senior management of the Armed Forces. This includes ranks from Sub-Lt/2nd Lt/Pilot Officer up to Admiral of the Fleet/Field Marshal/Marshal of the Royal Air Force but excludes Non-Commissioned Officers.
Other Ranks: Other Ranks are members of the Royal Navy, Royal Marines, Army and Royal Air Force who are not Officers, but other ranks include Non-Commissioned Officers.
Royal Air Force (RAF): The Royal Air Force is the aerial defence force of the UK.
Reserves: Individuals who voluntarily accept an annual training commitment and are liable to be mobilised to deploy on operations. They can be utilised on a part-time or full-time basis to provide support to the Regular Forces at home and overseas.
Royal Marines (RM): Royal Marines are sea-going soldiers who are part of the Naval Service.
Royal Navy (RN): The sea-going defence forces of the UK but excludes the Royal Marines and the Royal Fleet Auxiliary Service (RFA).
Service(s): Royal Navy, Royal Marines, Army, and Royal Air Force
Service Families Accommodation (SFA): Houses for SP to live in with their families, which are typically on or near to military bases.
Service person: Member of the armed forces
Single Living Accommodation (SLA): SLA is normally provided in the form of accommodation blocks inside military bases. It is available to single and unaccompanied personnel who are married/in a civil partnership undertaking initial training or those serving on a regular engagement with the UK armed forces, including Full Time Reserve Service (Full Commitment). It can be used as a permanent residence for some SP or on an ad hoc basis by others, where they have an additional residence, for example their own home.
Substitute Service Family Accommodation (SSFA): Properties that are rented from the open/private rental market when no suitable Service Families Accommodation property is available within the required distance.
Substitute Service Single Accommodation (SSSA): Properties that are rented from the open/private rental market when no suitable Service Families Accommodation property is available within the required distance.
UK Regulars: Full-Time SP, including Nursing Services, excluding FTRS (Full Time Reserve Service) personnel, Gurkhas, mobilised Reservists, Military Provost Guarding Service (MPGS), Locally Engaged Personnel, and Non-Regular Permanent Service.
Unweighted count: Refers to the actual number who provided a valid response to a question in the survey.
Weighting class: Refers to those members of a specific Service or rank to whom a weighting factor is applied.
15. Further Information
15.1 Disclosure Control and Rounding
Where rounding has been used, totals and sub-totals have been rounded separately and so may not equal the sums of their rounded parts. Estimates for groups with fewer than 30 respondents are not presented in this report as groups of this size are considered too unreliable and may be disclosive.
15.2 Revisions
Corrections to the published statistics will be made if errors are found, or if figures change because of improvements to methodology or changes to definitions. All corrected figures are identified by the symbol “r”, and an explanation has been given for the reason for and size of the revision. Where revisions have been made to the data, the Defence Statistics revisions policy has been followed.
The following revision was made in 2026. During production of 2026 Reference tables, it was identified in Table 21 (both estimate and margin of error) the total number of responses (Tri-Service) was incorrect. There is no impact to the findings following this revision.
Any additional corrections will be released in updated reports and/or reference tables, along with the reasons for the corrections, on the GOV.UK website. Corrections which would have a significant impact on the utility of the statistics will be corrected as soon as possible, by reissuing the publication. Minor errors will also be corrected, but for efficient use of resource these corrections may be timed to coincide with the next release of this publication.
More information can be found in the Background Quality Report.
15.3 Contact us
We welcome feedback on our statistical products. If you have any comments or questions about this publication, you can contact us as follows:
Email: People-Accommodation-Research@mod.gov.uk
If you have any comments or questions about the statistics produced by Defence Statistics in general, you can contact us as follows:
Email: Analysis-Publications@mod.gov.uk
If you require information which is not available within this or other available publications, you may wish to submit a Request for Information under the Freedom of Information Act 2000 to the Ministry of Defence.
For general MOD enquiries, please call: 020 7218 9000
For press enquiries, please call MOD Press Office: 020 7218 3253