Section 70 Weights and Measures report 2025 to 2026
Updated 24 September 2026

© Crown copyright 2026
This publication is licensed under the terms of the Open Government Licence v3.0 except where otherwise stated. To view this licence, visit nationalarchives.gov.uk/doc/open-government-licence/version/3 or write to the Information Policy Team, The National Archives, Kew, London TW9 4DU, or email: psi@nationalarchives.gov.uk.
Where we have identified any third party copyright information you will need to obtain permission from the copyright holders concerned.
This publication is available at https://www.gov.uk/government/statistics/section-70-weights-and-measures-returns-and-reports/section-70-weights-and-measures-report-2025-to-2026
1) Introduction
Under Section 70 of the Weights & Measures Act 1985, Local Weights and Measures Authorities (LWMAs) in Great Britain have a statutory duty to report to the Secretary of State for Business, Innovation, Science and Trade on the level of enforcement activity undertaken over a twelve-month period.
This report presents data submitted by LWMAs relating to work carried out between 1 April 2025 and 31 March 2026, with comparative commentary back to the 2017–2018 reporting year. It outlines where the majority of regulatory activity took place and highlights key concerns raised by LWMAs. These insights are intended to support the prioritisation of weights and measures regulatory and enforcement work. The accompanying data tables also include a more limited set of historical data reaching as far back as 2012–2013.
The data provides an overview of inspection and enforcement activity across Great Britain. However, it should not be used to compare individual LWMAs, as differences in resourcing and prioritisation policies may influence the nature and volume of activity reported.
Inspections covered a range of weighing and measuring equipment types, including Automatic Weighing Instruments (AWI), Non-Automatic Weighing Instruments (NAWI), Liquid Fuel Measuring Instruments (LFMI), Liquid Fuel Tanker Meter Measuring Systems (LFTMMS), and Intoxicating Liquor Measuring Instruments (ILMI).
1.1) Returns received
A total of 188 returns were received for the reporting year 2025–2026, representing 100% of those requested.
View the ODS file containing the full dataset.
Some LWMAs submit combined returns, so the total number of returns requested may vary from year to year. To account for fluctuations in the return rate, averages or percentage-based figures have been used where possible. Notes on the data analysis methodology are provided in the Annexes.
1.2) Key points
1.2.1) Weights and measures activity
A total of 48,616 inspections were carried out in 2025–2026, compared with 68,904 in 2024–2025, representing a 29% decrease. This follows the higher level of inspection activity recorded in 2024–2025 and brings the overall number of inspections closer to the level recorded in 2023–2024. The largest year-on-year change was in ILMI inspections, which decreased from 50,990 in 2024–2025 to 31,125 in 2025–2026. Within the NAWI categories, the increase in NAWI>30kg<5T inspections, from 1,840 to 3,051, was partly offset by a decrease in NAWI<30kg inspections, from 6,375 to 5,154.
In 2025–2026, there were 740 local weights and measures inspectors, a 3% decrease from the previous year and a 17% decrease compared to 2017–2018.
1.2.2) Compliance of weighing and measuring equipment
The three equipment types with the highest rates of verification mark removal in 2025–2026 were weighbridges, NAWI>30kg<5T and NAWI<30kg.
1.2.3) Measuring metrological compliance in transactions
Between 2024–2025 and 2025–2026, the overall proportion of businesses found to be compliant at first inspection increased from 63% to 68%. Meanwhile, the proportion of businesses assisted into compliance decreased from 19% to 16%.
2) Compliance of weighing and measuring equipment
2.1) Number of inspections
Figure 1. Number of pieces of equipment inspected each year (between 2017–2018 and 2025–2026)
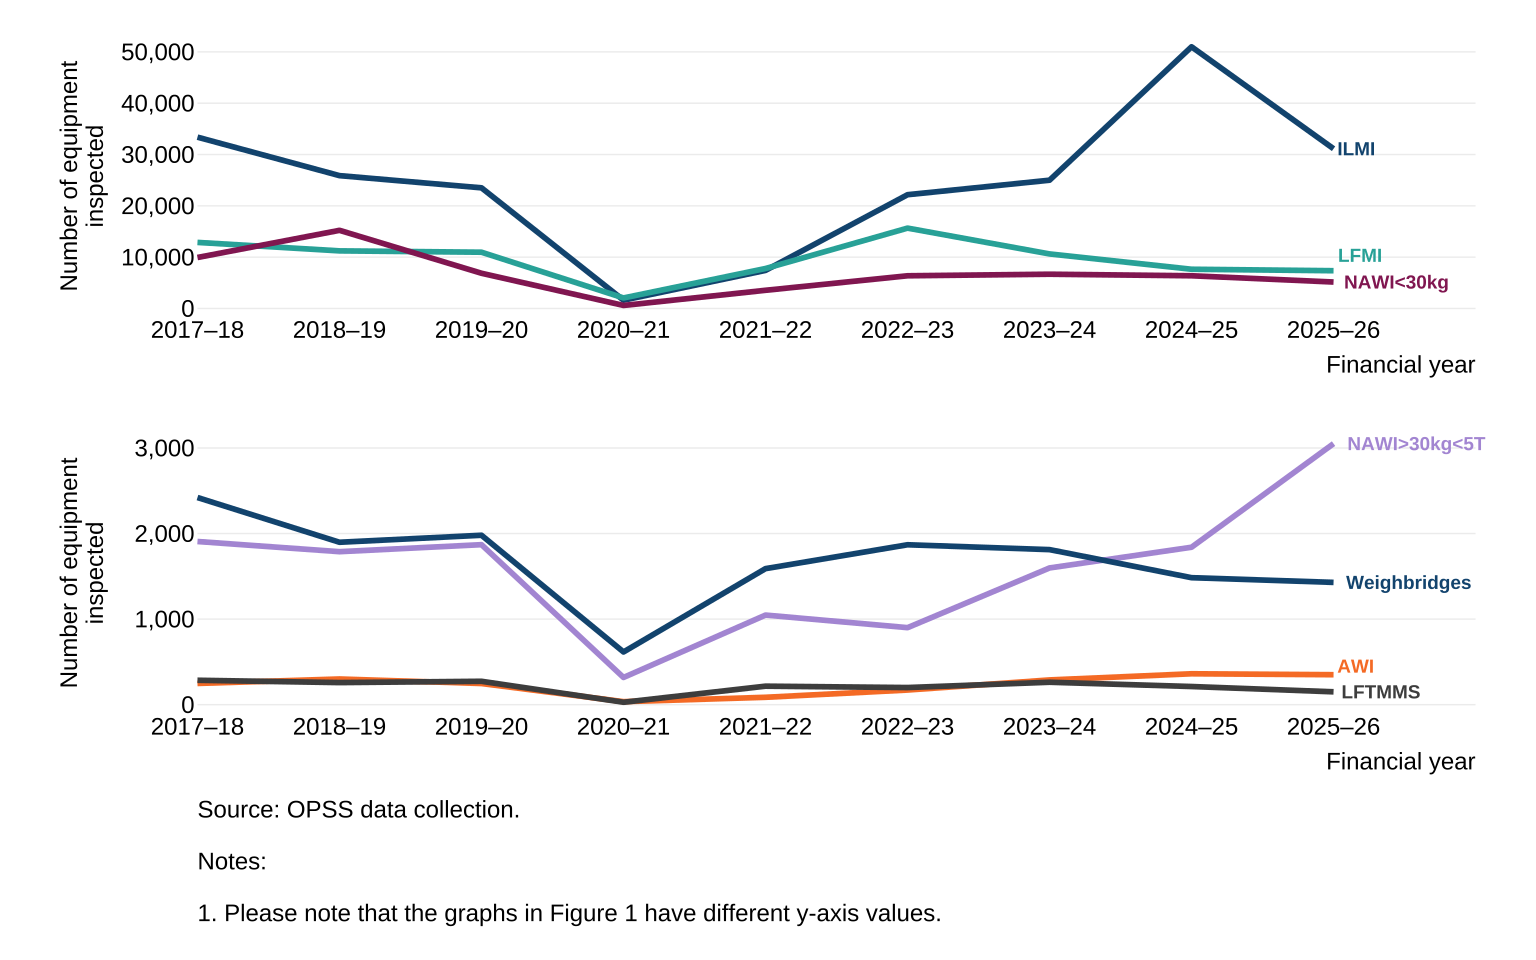
A total of 48,616 inspections were carried out in 2025–2026, compared with 68,904 in 2024–2025, representing a 29% decrease. This follows the higher level of inspection activity recorded in 2024–2025 and brings the overall number of inspections closer to the level recorded in 2023–2024. The largest year-on-year change was in ILMI inspections, which decreased from 50,990 in 2024–2025 to 31,125 in 2025–2026. Within the NAWI categories, the increase in NAWI>30kg<5T inspections, from 1,840 to 3,051, was partly offset by a decrease in NAWI<30kg inspections, from 6,375 to 5,154.
Equipment inspections for most groups remain below pre-pandemic figures, specifically those recorded in 2017–2018, with the exception of AWI and NAWI>30kg<5T, which have surpassed pre-pandemic figures.
Figure 1 shows that the number of inspections fell sharply in 2020–2021 and 2021–2022 due to the restrictions implemented during the COVID-19 pandemic. Since then, overall inspection activity has increased.
2.2) Outcomes of inspections
Figure 2 shows the percentage of reported non-compliant equipment for which a 28-day notice[footnote 1] was issued. Figure 3 shows the percentage of equipment for which the verification mark was removed.
It is important to note that a single piece of equipment may be subject to more than one enforcement outcome. For example, as outlined in the guidance accompanying the returns form, a piece of equipment may initially receive a 28-day notice and subsequently have its verification mark removed if the issue is not resolved.
Figure 2. Percentage of equipment inspected which had 28 days’ notice issued in 2024–2025 and 2025–2026
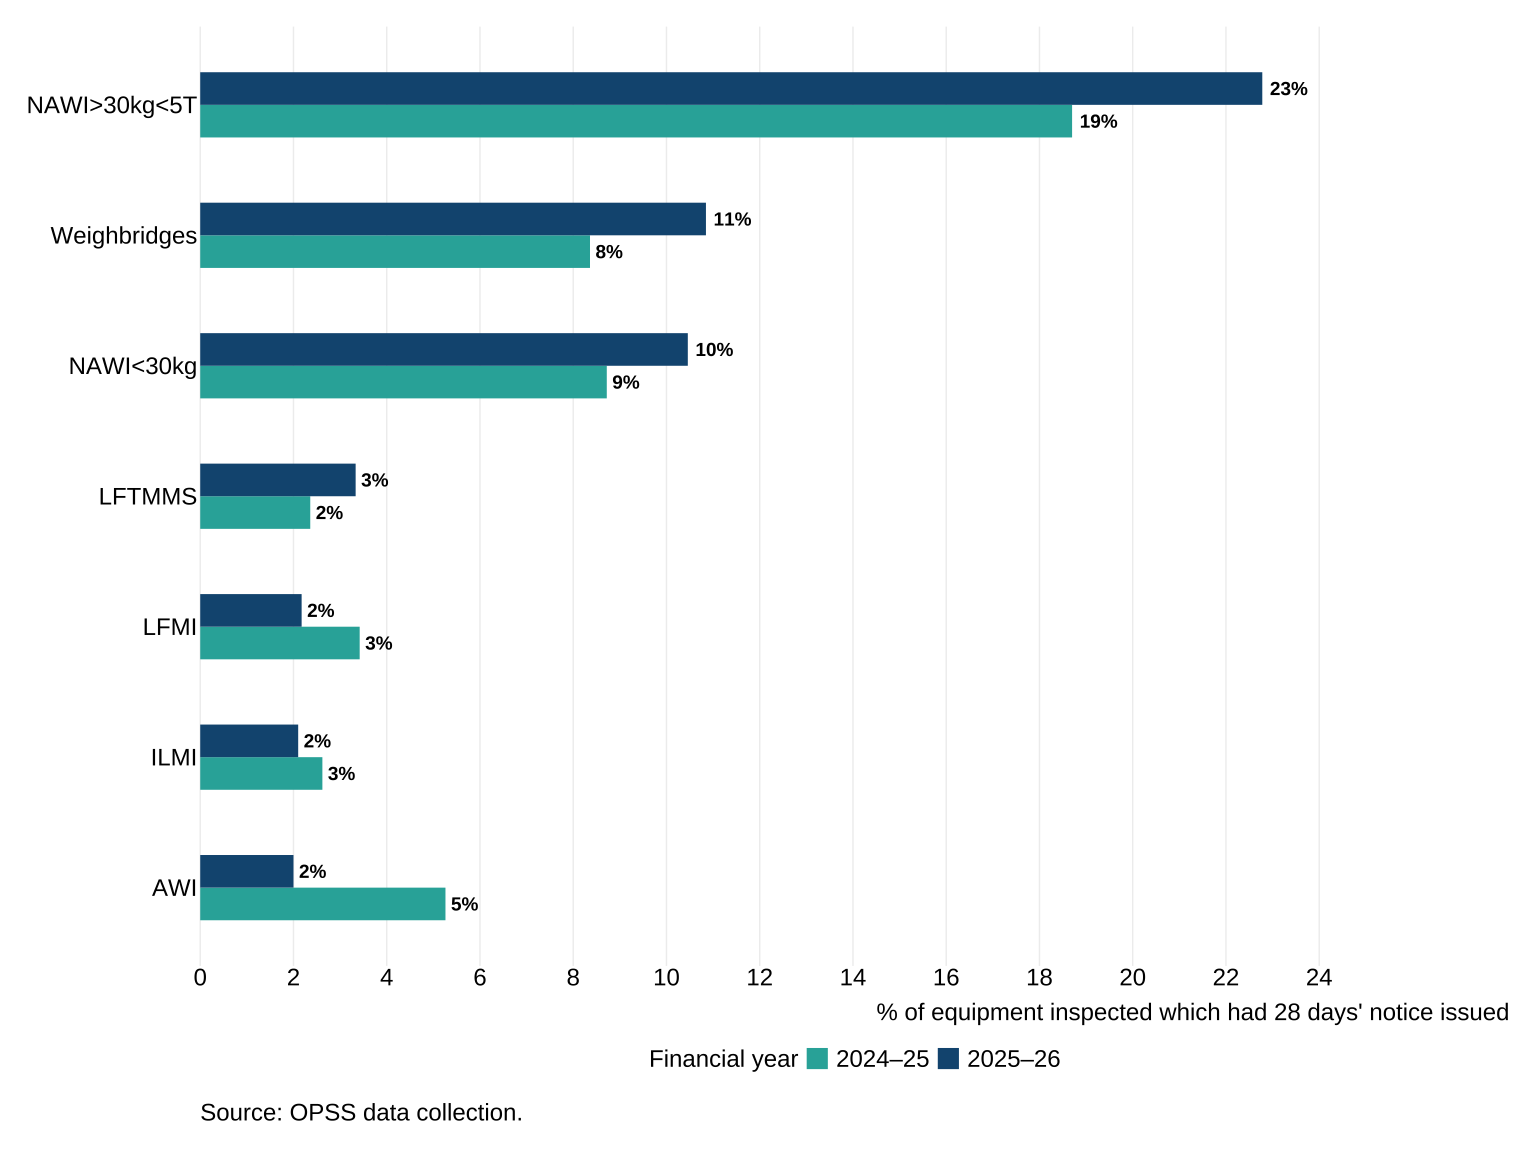
The percentage of inspected equipment issued with 28-day notices increased for both NAWI categories and for weighbridges in 2025–2026. These equipment groups also recorded increases in 2024–2025. The percentage decreased for LFMI, ILMI, and AWI.
It is important to note that certain equipment types, such as AWIs and LFTMMS, are more susceptible to fluctuations in these figures because of the relatively small number of instruments inspected.
Figure 3. Percentage of equipment inspected which had the verification mark removed in 2024–2025 and 2025–2026
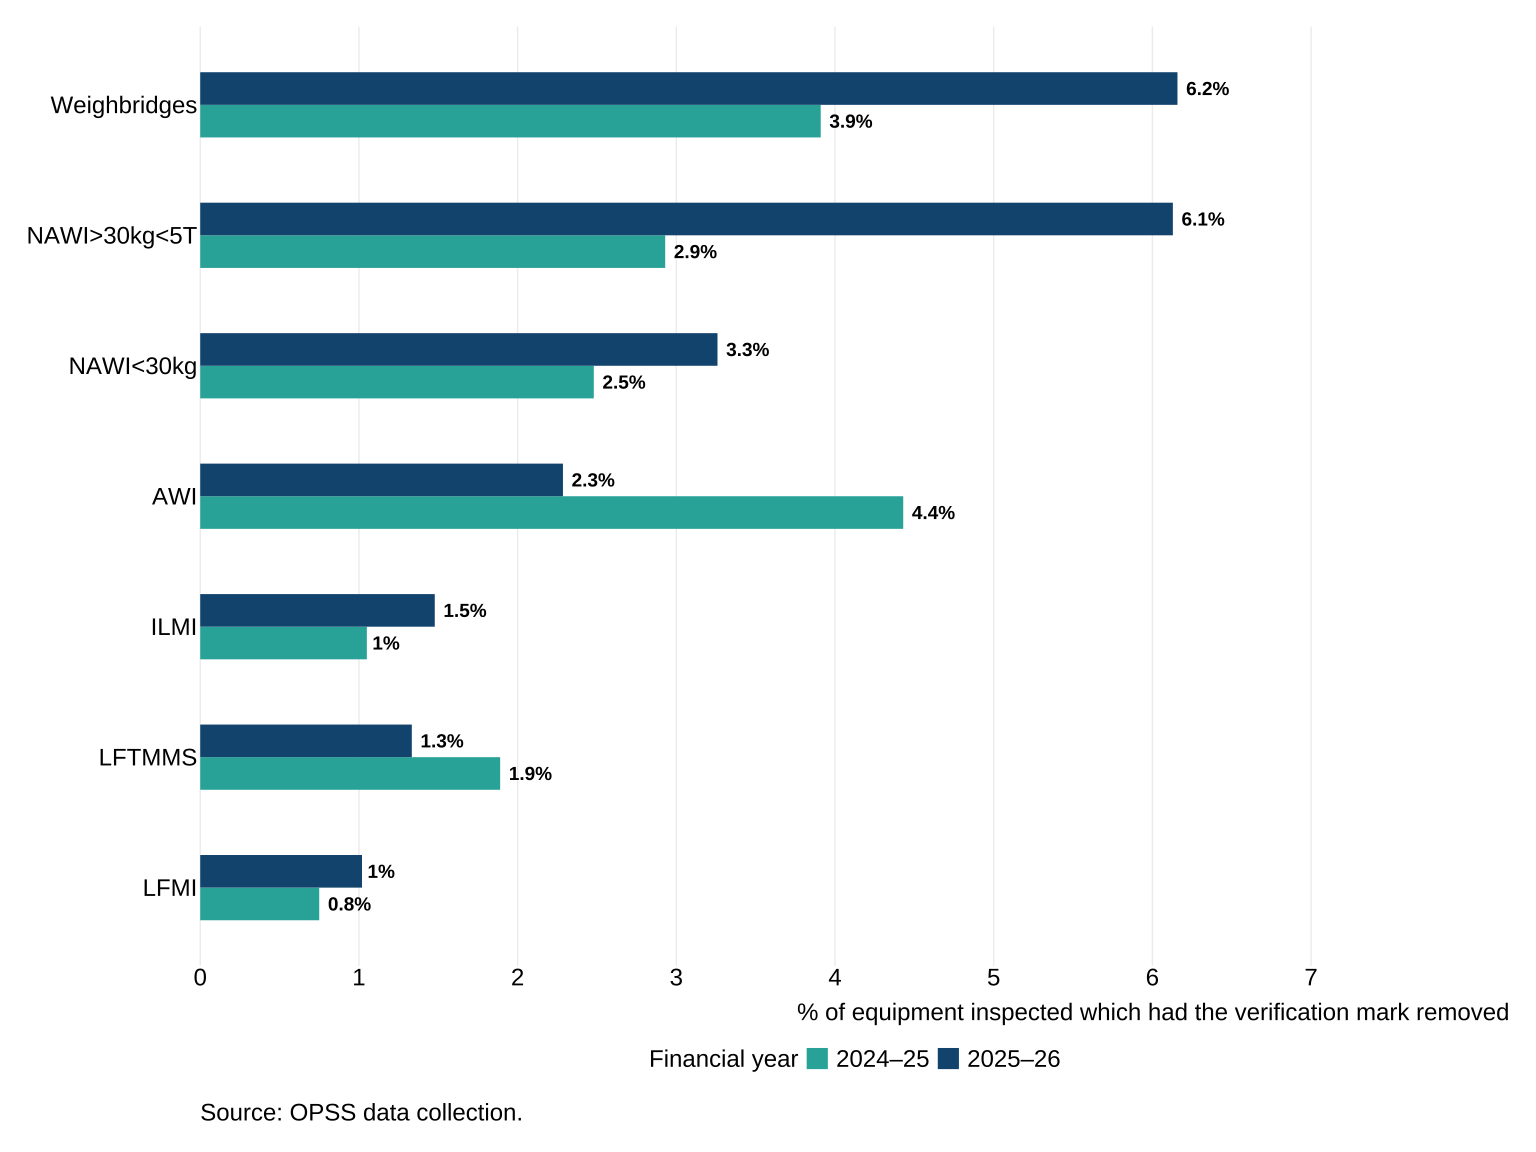
Figure 3 shows that weighbridges, NAWI>30kg<5T, and NAWI<30kg had the highest rates of verification mark removal in 2025–2026.
It is important to note that these rates may be influenced by the relatively low number of inspections conducted for some equipment types, which can make percentages more susceptible to fluctuation.
There were 21 inspections resulting in prosecutions or cautions in 2025–2026 (4 for LFMI, 14 for NAWI<30kg, 3 for NAWI>30kg<5T).
3) Measuring metrological compliance in transactions
Figure 4. Average number of businesses that were visited in a year across LWMAs in 2024–2025 and 2025–2026
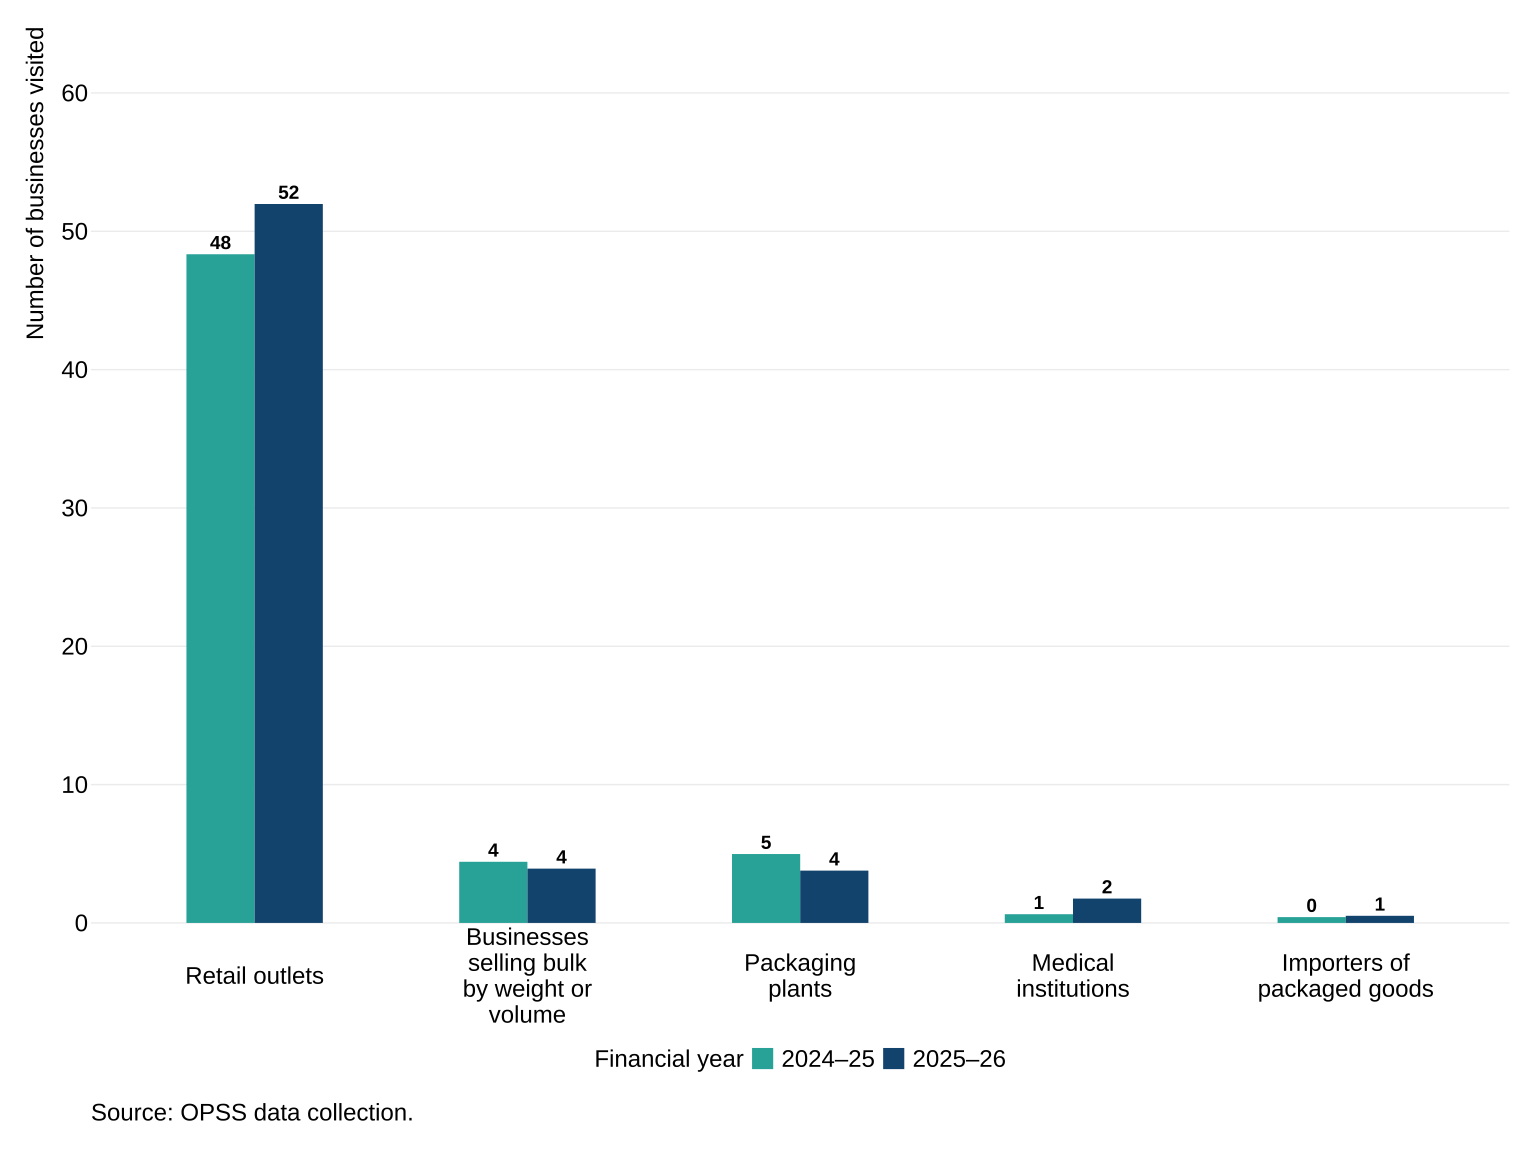
Retail outlets have consistently been the most frequently visited type of business in recent years. In 2025–2026, retail outlets accounted for 84% of all businesses visited. In contrast, importers of packaged goods and medical institutions were among the least visited business types and this similarly followed the trend of recent years.
Medical institutions saw an increase in average visits in 2025–2026 compared to 2024–2025. By contrast, activity among businesses selling bulk by weight or volume, packaging plants and importers of packaged goods remained relatively stable.
Figure 5. Business compliance (%) with proportion compliant without assistance and proportion assisted into compliance in 2025–2026
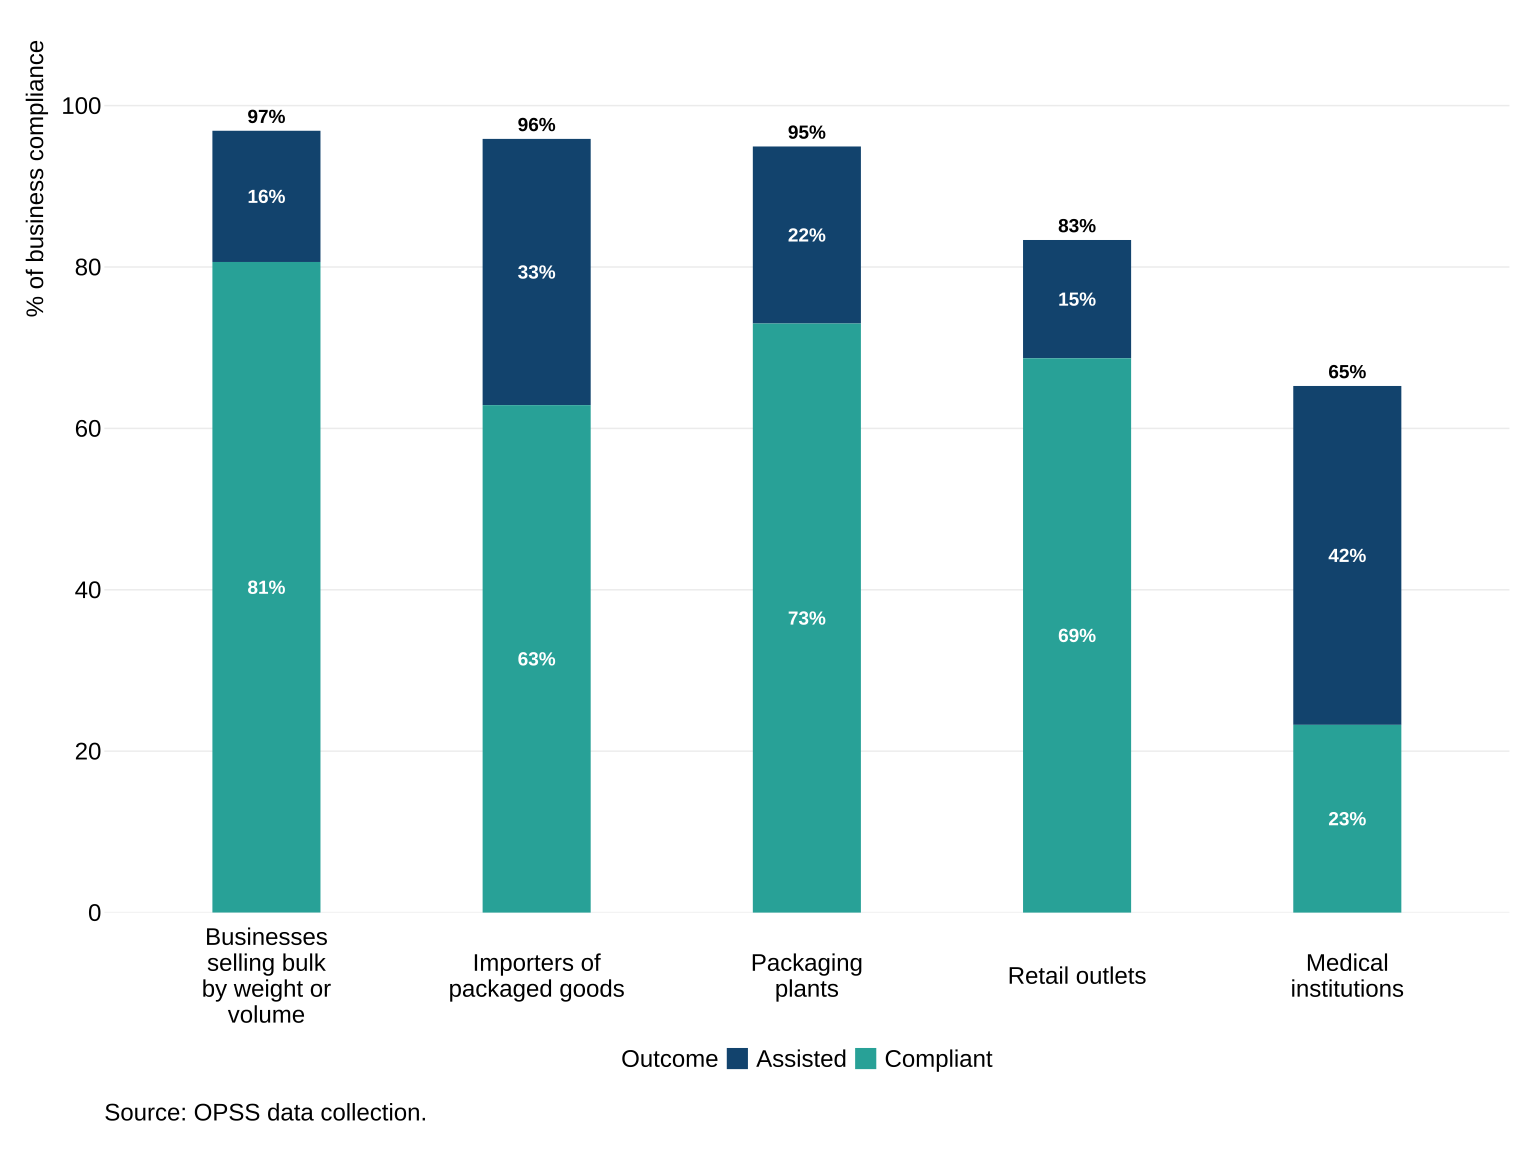
Figure 5 shows the total proportions of compliance[footnote 2] for each business type in 2025–2026. Each bar is divided into two segments. The lower segment represents businesses that were already compliant at the time of inspection. The upper segment shows those that were assisted into compliance[footnote 3].
Across all businesses, the total proportion of compliance, combining those found compliant at first inspection and those assisted into compliance, increased from 82% in 2024–2025 to 85% in 2025–2026.
Medical institutions showed the lowest proportion of compliance in both years (70% in 2024–2025, and 65% in 2025–2026). However, these figures should be interpreted with caution, as relatively low inspection numbers can result in greater year-on-year variation. Between 2024–2025 and 2025–2026, the proportion of compliance showed relatively small year-on-year movements across business types. An increase was observed for importers of packaged goods and retail outlets. Compliance remained broadly stable for businesses selling bulk by weight or volume and packaging plants. Decreases were observed for medical institutions.
Retail outlets had the second lowest proportion of compliance (83%). This corresponds with some of the technical concerns reported by LWMAs (see Section 5), which highlighted issues relating to equipment, compliance and operational challenges. A low level of compliance may reflect the intelligence-led model[footnote 4] that authorities are following.
The highest proportions of compliance were shown by businesses selling bulk by weight or volume (97%), importers of packaged goods (96%), and packaging plants (95%)[footnote 5].
4) Staffing
Figure 6. Total number of local weights and measures inspectors, number of FTE and number studying the CTSI Legal Metrology Module, 2017–2018 to 2025–2026
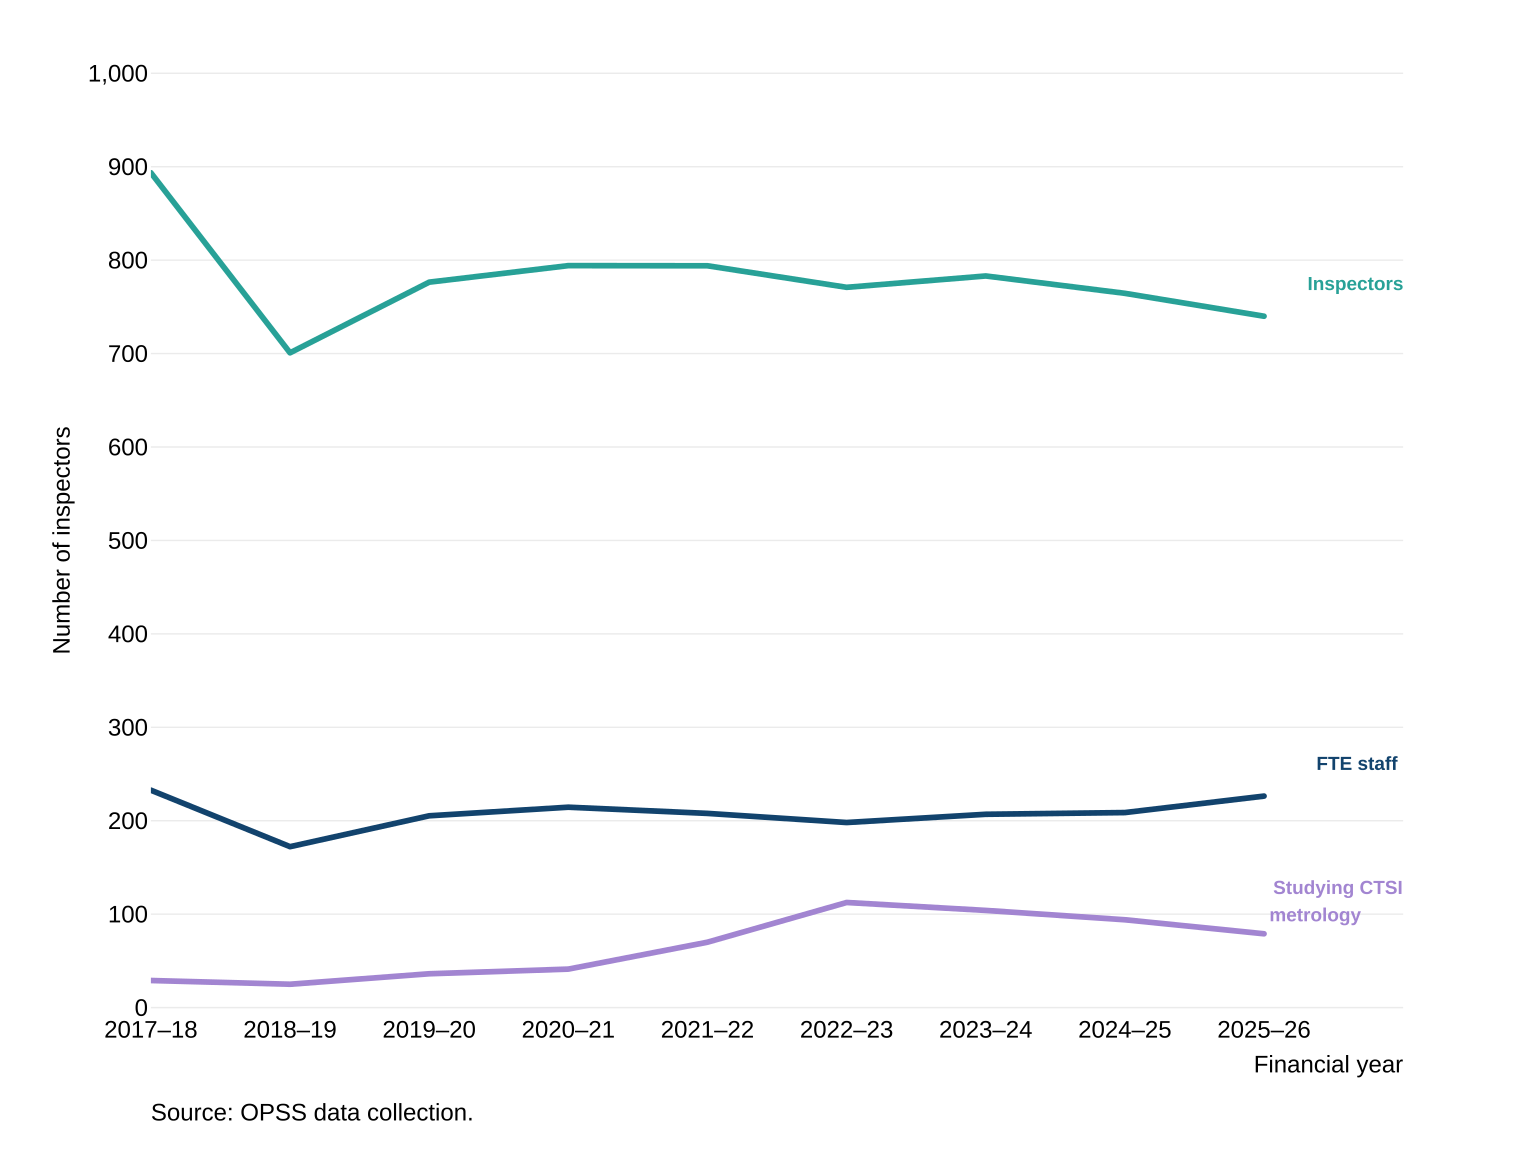
In 2025–2026 there were 740 local weights and measures inspectors and 226 FTE staff. The overall trend[footnote 6] since 2019–2020 has remained relatively stable. However, compared with 2017–2018, the total number of inspectors has decreased by 17%, while the number of FTE staff engaged in weights and measures work has decreased by 3%. Compared with 2024–2025, there was a decrease of 3% in the number of inspectors, but an increase of 8% in FTE staff.
It should be noted that the dip in staffing figures reported for 2018–2019 is attributed to a lower response rate that year, resulting in incomplete data from LWMAs.
In 2025–2026, 79 officers were studying for the Chartered Trading Standards Institute (CTSI) Legal Metrology Module. The number of officers studying for the CTSI Legal Metrology Module increased steadily up to 2022–2023 before declining gradually in subsequent years. Compared with 2024–2025, the number decreased from 94 to 79, representing a decrease of 16%.
View the ODS file containing the full dataset.
Table 1. Average number of local weights and measures inspectors and FTE staff by local authority type, 2021–2022 to 2025–2026
| Type | 2021–22 | 2022–23 | 2023–24 | 2024–25 | 2025–26 |
|---|---|---|---|---|---|
| County Council | 9.9 inspectors, 2.0 FTE | 8.8 inspectors, 1.6 FTE | 9.0 inspectors, 1.8 FTE | 7.6 inspectors, 1.6 FTE | 8.4 inspectors, 1.7 FTE |
| London Borough | 2.0 inspectors, 0.7 FTE | 1.9 inspectors, 0.8 FTE | 1.7 inspectors, 0.6 FTE | 1.7 inspectors, 0.5 FTE | 1.7 inspectors, 0.7 FTE |
| Metropolitan District | 3.3 inspectors, 0.5 FTE | 3.1 inspectors, 0.6 FTE | 3.1 inspectors, 0.6 FTE | 3.2 inspectors, 0.8 FTE | 3.3 inspectors, 0.8 FTE |
| Scottish Unitary | 4.1 inspectors, 1.7 FTE | 4.0 inspectors, 1.6 FTE | 4.2 inspectors, 2.0 FTE | 4.2 inspectors, 2.0 FTE | 4.2 inspectors, 2.0 FTE |
| Unitary Authority | 3.6 inspectors, 0.9 FTE | 3.9 inspectors, 0.8 FTE | 4.1 inspectors, 0.7 FTE | 3.4 inspectors, 0.7 FTE | 3.7 inspectors, 1.0 FTE |
| Welsh Unitary | 4.1 inspectors, 1.2 FTE | 3.9 inspectors, 1.1 FTE | 4.0 inspectors, 1.4 FTE | 4.6 inspectors, 1.5 FTE | 3.9 inspectors, 1.4 FTE |
Source: OPSS data collection.
Combined returns containing local authorities of different authority types have been assigned a single authority type for reporting purposes. Where a combined return includes a County Council, the return has been classified as a County Council, reflecting its status as the highest-tier local authority within the combined return. This approach is consistent with previous years and maintains comparability across the historic series.
Staffing levels vary across local authority types and may reflect differences in local priorities, funding arrangements and organisational structures. Table 1 provides additional context for understanding staffing capacity across Great Britain.
Staffing and resources are also discussed in the ‘Top 3 concerns’ section. Figure 6 and Table 1 may help contextualise the issues raised there.
5) Top three concerns
The majority of returns provided information in the optional concerns section, with 91% of responding LWMAs submitting at least one strategic or technical concern. The concerns reported for 2025–2026 are presented alongside previous years for comparison.
This year, local authorities were asked to report their technical and strategic concerns separately using predefined drop-down options. Previously, local authorities provided their top three concerns as open-text responses, which were categorised into technical and strategic categories during analysis. This change in the data collection approach may have contributed to the increase in reported concerns. Providing a predefined list may have made it easier for local authorities to identify and select relevant concerns, while also improving consistency in how concerns were categorised and analysed.
5.1) Top three strategic concerns
Table 2. Top three strategic concerns reported by LWMAs, 2021–2022 to 2025–2026
| 2021–22 | 2022–23 | 2023–24 | 2024–25 | 2025–26 |
|---|---|---|---|---|
| Staffing concerns (59%) | Staffing concerns (59%) | Staffing concerns (74%) | Staffing concerns (62%) | Staffing concerns (80%) |
| Legal metrology not prioritised (57%) | Legal metrology not prioritised (48%) | Legal metrology not prioritised (30%) | Legal metrology not prioritised (47%) | Legal metrology not prioritised (64%) |
| Targeting and intelligence limitations (17%) | Targeting and intelligence limitations (21%) | Targeting and intelligence limitations (13%) | Targeting and intelligence limitations (10%) | Targeting and intelligence limitations (48%) |
Source: OPSS data collection.
Staffing Concerns
Challenges raised by LWMAs in relation to Staffing concerns represent the most common cause of concern (80%). These concerns included:
- Staff shortages
- Recruitment and retention challenges, particularly for new inspectors
- Inadequate succession planning, with a growing number of experienced officers approaching retirement age
- Competency gaps, due to a growing mismatch between numbers and level of experience of joiners and leavers, and insufficient training
- Limited training available to trainees and new recruits, particularly due to financial constraints
Legal Metrology not Prioritised
64% of responding LWMAs raised concerns relating to the prioritisation of legal metrology work in 2025–2026. Responses referred to issues including resource pressures, budget constraints, competing priorities and the extent to which legal metrology activity is prioritised within local and central government.
‘Legal metrology not prioritised’ was raised in the context of both local authority capacity and wider organisational priorities. Some returns highlighted the limited number of suitably qualified officers available to undertake legal metrology work, suggesting that challenges relating to prioritisation, staffing and resources may overlap.
Targeting and Intelligence Limitations
48% of responding LWMAs signalled a lack of available data and intelligence about weights and measures contraventions and Legal Metrology related risks, which significantly limited their ability to take informed operational decisions and make an effective and efficient contribution in the legal metrology space. Also referenced was a lack of consumer reporting and intelligence.
Several authorities reported receiving very little intelligence in relation to weights and measures issues, including limited consumer reporting and a lack of intelligence products and analysis. This was seen as making it more difficult to target inspection activity and build an evidence base for identifying areas of non-compliance.
5.2) Top three technical concerns
Table 3. Top three technical concerns reported by LWMAs, 2021–2022 to 2025–2026
| 2021–22 | 2022–23 | 2023–24 | 2024–25 | 2025–26 |
|---|---|---|---|---|
| NAWI (14%) | NAWI (16%) | NAWI (6%) | Lack of equipment (21%) | Other technical concerns (50%) |
| Weighbridges (12%) | Weighbridges (13%) | Weighbridges (26%) | NAWI compliance (19%) | Lack of equipment (49%) |
| ILMI (10%) | ILMI (8%) | ILMI (6%) | Weighbridges (8%) | NAWI (35%) |
Source: OPSS data collection.
The top three technical concerns reported by LWMAs in 2025–2026 differed from those reported in previous years, reflecting both changes in the issues identified by authorities through the annual returns and the introduction of standardised concern categories in the updated collection method.
Other Technical Concerns
50% of responding LWMAs raised technical concerns that did not fall within the main equipment categories and reflected a range of operational and technical challenges associated with delivering legal metrology activities. Issues raised by authorities included access to suitable facilities and equipment, maintaining staff competency and specialist knowledge, and challenges associated with monitoring compliance across different measuring instrument types.
Lack of Equipment
49% of responding LWMAs raised concerns relating to the availability, suitability and maintenance of equipment required to undertake legal metrology work. Concerns raised by authorities included the cost of obtaining and maintaining specialist equipment, the use of outdated equipment, limited testing capacity and the impact these issues can have on inspection and enforcement activity.
Non-Automatic Weighing Instruments (NAWI)
35% of responding LWMAs reported concerns relating to non-automatic weighing instruments (NAWIs). Reported issues included the use of unstamped or non-approved equipment, concerns about NAWIs not intended for trade use being used in commercial settings, and instances of non-compliant instruments identified during inspection activity.
6) Annexes
Annex A: Section 70 process
The following information was requested from LWMAs:
Measuring compliance of weighing and measuring equipment
For the following types of equipment:
- Liquid fuel dispensers (LFMI)
- Liquid fuel tanker meter measuring systems (LFTMMS)
- Weighbridges and scales over 5 tonnes (Weighbridges)
- Non-automatic weighing instruments under 30 kg (NAWI <30 kg)
- Non-automatic weighing instruments over 30 kg and under 5 tonnes (NAWI >30 kg <5 t)
- Automatic weighing instruments (AWI)
- Intoxicating liquor measuring instruments (ILMI)
The data collected included:
- Number of pieces of equipment inspected
- Number of pieces of equipment verified
- Number found to be incorrect, with a 28-day notice issued
- Number found to be incorrect, with the verification mark removed
- Number resulting in prosecution or caution
- Number found outside the limits of error
Non-compliance of a weighing or measuring instrument may result from:
- Failure to follow the required conformity assessment procedures (e.g. the instrument bears incorrect conformity markings); or
- Failure to meet essential requirements relating to risk (e.g. the measurement error exceeds the permissible range).
Measuring metrological compliance in transactions
For each of the following types of businesses:
- Packaging plants
- Importers of packaged goods
- Businesses selling bulk products by weight or volume
- Retail outlets
- Medical institutions
The following data was collected:
- Number of businesses visited
- Number of businesses found to be compliant at initial inspection
- Number of businesses assisted into compliance by the LWMA
Staffing
The data collected included:
- Number of inspectors of weights and measures
- Number of full-time equivalent (FTE) staff engaged in weights and measures work
- Number of staff registered and actively studying for the Charted Trading Standards Institute (CTSI) Legal Metrology module
Top concerns
The data collected included:
- The top three areas of concern identified by each LWMA
Annex B: Notes on the data
The full dataset of individual returns submitted by LWMAs is published alongside this report as open data.
Caution should be exercised when comparing data in this report with previous years, due to changes in methodology and geographical definitions. Additionally, data from earlier years (particularly 2020–2022) may have been affected by the impacts of the COVID-19 pandemic.
Where numerical data is presented, the rate of returns may influence the figures. Returns received may reflect areas with greater resources and higher levels of activity, which could skew data. Please note that authorities may report multiple concerns. Percentages are based on the total number of mentions and therefore may exceed 100%.
Annex C: Acronyms and initialisms
- AWI: Automatic Weighing Instrument
- CTSI: Chartered Trading Standards Institute
- FTE: Full-time Equivalent
- ILMI: Intoxicating Liquor Measuring Instrument
- LFMI: Liquid Fuel Measuring Instrument
- LFTMMS: Liquid Fuel Tanker Meter Measuring System
- LWMA: Local Weights and Measures Authority
- NAWI: Non-automatic Weighing Instrument
- TSI: Trading Standards Institute
7) More about these statistics
More information about the Section 70 Weights and Measures report and revisions to these statistics can be found in the accompanying Methodology and Quality Report).
Our statistical practice is regulated by the Office for Statistics Regulation (OSR), which sets the standards of trustworthiness, quality, and value in the Code of Practice for Statistics that all producers of official statistics are expected to follow.
We welcome feedback on how we meet these standards. You can contact us directly, or reach out to OSR by emailing regulation@statistics.gov.uk or visiting the OSR website.
Responsible statistician: Hannah Palmer
Public enquiries: OPSSanalysis@businessandtrade.gov.uk
Footnotes
-
Where measuring equipment does not fully comply with the requirements of the Regulation, but the nature or extent of the non-compliance does not, in the inspector’s opinion, warrant immediate obliteration of the verification mark, the inspector shall issue a notice to the proprietor or person responsible for the equipment. This notice will require that the equipment be corrected within a specified period not exceeding 28 days. If the correction is not made within that period, the inspector shall then obliterate the verification mark. ↩
-
Rates of compliance are expressed as a percentage of businesses visited. While the figures presented can indicate where non-compliance may be occurring, they should not be interpreted as definitive non-compliance rates. ↩
-
Percentages may exceed 100 percent, as it is possible for a business to be assisted into compliance without being physically visited. For example, this may occur through a phone call. ↩
-
Trading Standards services operate using an intelligence-led approach, where enforcement decisions are informed by the analysis of data from multiple sources, including complaints and a business’s compliance history. In addition to targeted enforcement, Trading Standards officers may also conduct routine inspections, for example in line with an annual programme of inspections. ↩
-
Figures may exceed 100% due to rounding errors at the individual LMWA level. See Section 6.1 for more information. ↩
-
While Figure 6 is useful for monitoring year-on-year trends, it may not reflect differences in staffing structures between different types of local authorities. Table 1 has been included to provide additional context on this variation. ↩