Section 70 Weights and Measures report 2021 to 2022
Updated 14 August 2025

© Crown copyright 2025
This publication is licensed under the terms of the Open Government Licence v3.0 except where otherwise stated. To view this licence, visit nationalarchives.gov.uk/doc/open-government-licence/version/3 or write to the Information Policy Team, The National Archives, Kew, London TW9 4DU, or email: psi@nationalarchives.gov.uk.
Where we have identified any third party copyright information you will need to obtain permission from the copyright holders concerned.
This publication is available at https://www.gov.uk/government/statistics/section-70-weights-and-measures-returns-and-reports/section-70-report-2021-to-2022
1. Introduction
Under Section 70 of the Weights and Measures Act 1985, Local Weights and Measures Authorities (LWMAs) in Great Britain have a statutory duty to report to the Secretary of State the level of local Weights and Measures enforcement work conducted over a twelve-month period.
This report summarises data from 2021-22 with comparisons made to the previous year. It outlines where the majority of activity has taken place and highlights the main concerns which have been raised, to assist with prioritisation of weights and measures regulatory activity.
1.1 Section 70 process
The information requested from LWMAs was:
Measuring compliance of weighing and measuring equipment
For the following equipment:
- liquid fuel dispensers (LFMI)
- liquid fuel tanker meter measuring systems (LFTMMS)
- weighbridges and scales >5t (Weighbridges)
- non-automatic weighing instruments <30kg (NAWI<30kg)
- non-automatic weighing instruments >30kg - <5t (NAWI>30kg<5T)
- automatic weighing instruments (AWI)
- intoxicating liquor measuring instruments (ILMI).
the following information was collected:
- number of pieces of equipment inspected
- number of pieces of equipment verified
- number found incorrect and 28 days’ notice issued
- number found incorrect and verification mark removed
- number resulting in prosecution or caution
- number found outside limit of error
Non-compliance of a weighing or measuring instrument could be the result of:
- the required conformity assessment procedures were not followed e.g. the instrument bears the incorrect conformity marks; or
- the essential requirements relating to risk are not met e.g. the measurement error is outside the permissible range.
Measuring metrological compliance in transactions
For each of:
- packaging plants
- importers of packaged goods
- businesses selling bulk products by weight or volume
- retail outlets
- medical institutions
the following information was collected:
- number of businesses visited
- number of compliant businesses (on initial inspection)
- number of businesses Local Weights and Measures Authority assisted into compliance
Staffing
- number of inspectors of Weights and Measures
- number of full-time equivalents (FTE) staff engaged in Weights and Measures work
- number of staff registered and actively studying for the Charted Trading Standards Institute (CTSI) Legal Metrology module
Top concerns
- the top 3 areas of concern for a Local Weights and Measures Authority
1.2 Returns received
188 of a maximum 190 returns were received for the year 2021-22. This is up from 145 out of a maximum of 202 in 2018-19. It must be noted that some LWMAs sent combined returns, so one return might cover several authorities. To account for the fluctuation in return rate, averages or percentage rates have been used where possible. Notes on how the data has been analysed are available in Annex A.
2. Compliance of weighing and measuring equipment and pre-packages
2.1 Numbers of inspections
Figure 1. Numbers of equipment inspected each year (2017-18 to 2021-22)

Please note that the graphs in Figure 1 have different y-axis values.
Figure 1 demonstrates on average a 64% decrease in numbers inspected since 2017-18. ILMI have seen the greatest change (-78%), with LFTMMS showing the lowest percentage change (-24%). It should be noted that the numbers in 2020-21 and 2021-22 will be affected by the COVID-19 pandemic. Inspection numbers had generally risen after the COVID-19 dip, but not to the same extent for each type of equipment.
2.2 Outcomes of inspections
Figure 2 shows, from all reported non-compliance, the percentage of pieces of equipment that had 28 days’ notice issued. Figure 3 shows the percentage that had the verification mark removed. One piece of equipment may have more than one outcome. For example (noted in the guidance on the returns form), a piece of equipment may initially be subject to 28 days’ notice and subsequently have its verification mark removed if the problem is not rectified.
Figure 2. Percentage of equipment inspected which had 28 days’ notice issued (2020-21 and 2021-22)

Liquid fuel tanker meter measuring systems (LFTMMSs) and Automatic weighing instruments (AWIs) had a relatively high rate (compared with other types of equipment) of 28 days’ notices being issued in 2021-22, and LFTMMSs had the largest change in notices. However, it should be noted that LFTMMs and AWIs are more susceptible to fluctuations due to small numbers of instruments inspected.
Intoxicating liquor measuring instruments (ILMIs) saw both the percentage of 28 days’ notices being issued and the percentage of verification marks being removed fall in 2021-22 (see also Figure 3).
Figure 3. Percentage of equipment inspected which had the verification mark removed (2020-21 and 2021-22)
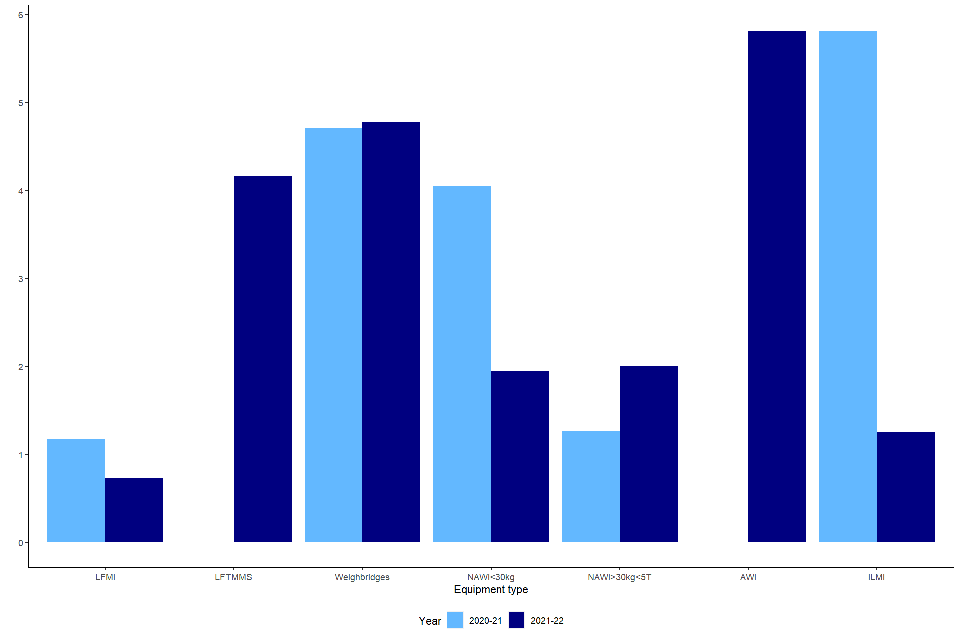
Figure 3 shows that AWIs had the highest rate of verification marks being removed in 2021-22; 6% of those inspected, although this is based on fewer than 100 inspections.
There were only two inspections relating to prosecutions or cautions in 2021-22 (one for an LFMI and one for an LFTMMS).
3. Measuring metrological compliance in transactions
Figure 4. Average number of businesses that were visited in a year across LWMAs (2020-21 and 2021-22)

Largely the same pattern of activity can be seen between the two years. On average LWMAs visited 5 fewer retail outlets than the previous year, while Medical Institutions were the least visited type of business in both years.
Figure 5 shows the total proportions of compliance for each business type, in 2020-21 and 2021-22. These are broken down into the proportion that were already compliant, and the proportion that were assisted into compliance (the lower section and upper section of each bar, respectively). The percentages may add up to more than 100% due to small inconsistencies in the data.
Rates of non-compliance (i.e. as a percentage of all businesses rather than of businesses visited) are not specifically requested on the Section 70 form. The figures below can indicate where non-compliance may be occurring, but it is not possible to infer exact non-compliance rates.
Figure 5. Business compliance (%) with proportion compliant without assistance and proportion assisted into compliance (2020-21 and 2021-22)
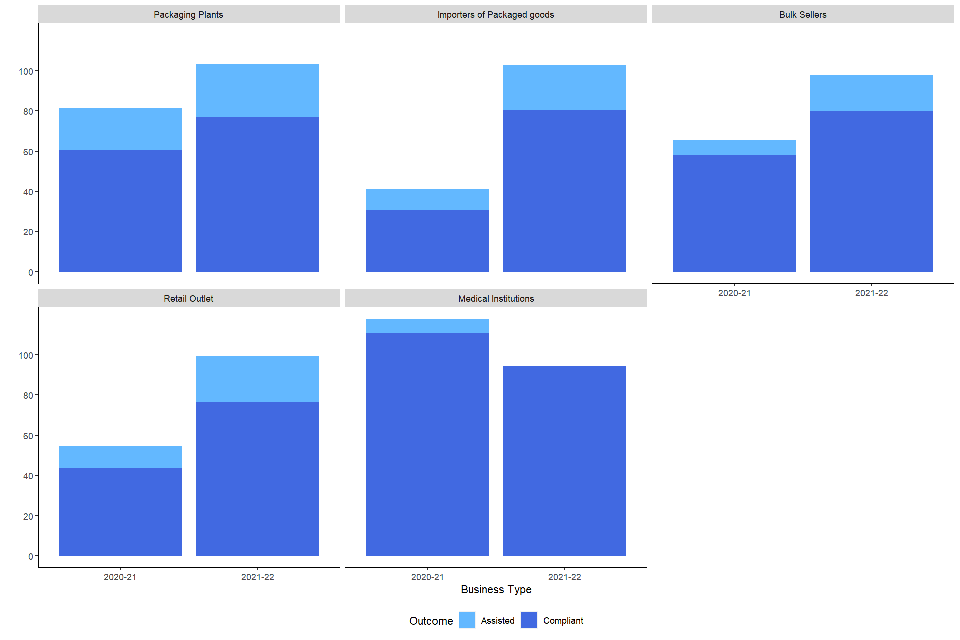
Importers of packaged goods showed the lowest proportion of compliance in 2020-21, at 41% overall but this had increased to 103% in 2021-22 see footnote 1. There was an increase in the proportion of compliance for all business types. The exception was Medical Institutions (due to low numbers distorting inconsistencies in the data) in 2021-22.
Both the overall proportion of businesses compliant on first inspection and the proportion of businesses assisted into compliance increased between 2020-21 and 2021-22 (by 69% and 99% respectively).
4. Staffing
Figure 6. Total number of local weights and measures inspectors, number of FTE and number studying the CTSI Legal Metrology Module (2012-13 to 2021-22)
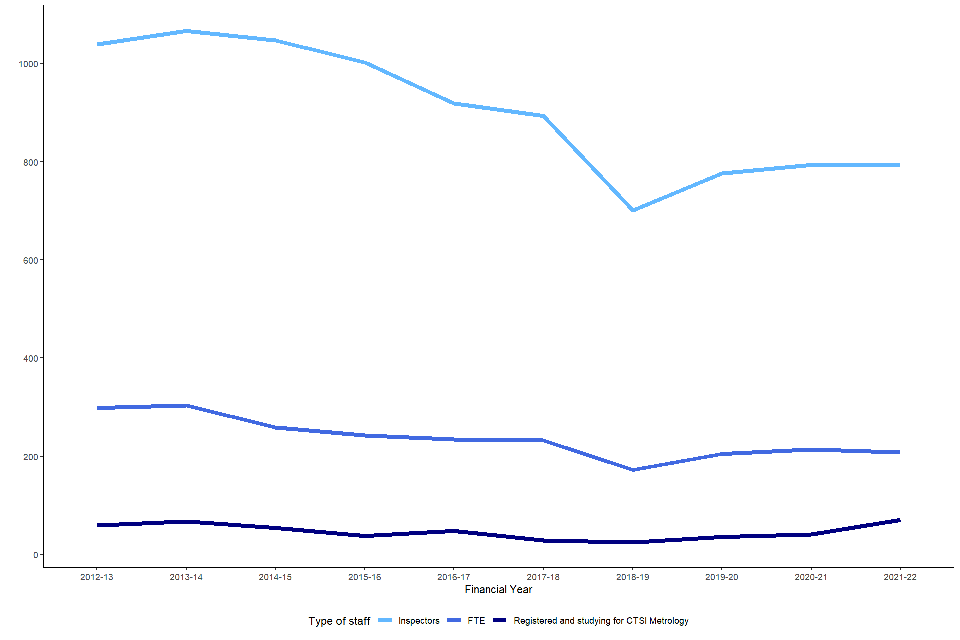
In 2021-22 there were 794 local weights and measures inspectors, equivalent to 207.8 FTEs. The overall trend shows a decrease in total numbers of inspectors (-24% since 2012-13). There has also been a change in the number of FTE staff engaged in Weights and Measures work (-30% since 2012-13). There has been a 19% increase in the number of officers studying for the CTSI Legal Metrology Module during 2021-22.
Whilst Figure 6 is useful for monitoring year-on-year trends, it may not account for differences in staffing between different types of LA. Table 1 has been included to reflect this difference.
Table 1. Average number of local weights and measures inspectors and FTE and by LA type (2019-20, 2020-21 and 2021-22)
| Geography type | 2019-20 | 2020-21 | 2021-22 |
|---|---|---|---|
| County councils | 8.9 / 1.7 FTE | 9.7 / 2.1 FTE | 9.9 / 2.0 FTE |
| London Borough | 1.8 / 0.5 FTE | 1.7 / 0.5 FTE | 2.0 / 0.7 FTE |
| Metropolitan districts | 3.4 / 0.7 FTE | 3.2 / 0.7 FTE | 3.3 / 0.5 FTE |
| Scottish Unitary | 3.9 / 1.6 FTE | 3.8 / 1.7 FTE | 4.1 / 1.7 FTE |
| Unitary authorities | 3.7 / 0.9 FTE | 3.9 / 0.9 FTE | 3.6 / 0.9 FTE |
| Welsh Unitary | 4.2 / 1.3 FTE | 4.2 / 1.3 FTE | 4.1 / 1.2 FTE |
This suggests that on average some types of Local Authorities (County Councils, for example) have seen a slight increase in the numbers of Inspectors over the last two years than other types of Local Authorities (Unitary authorities, for example).
Staffing and resource is also covered in the section on ‘Top 3 concerns’ and Figure 6 and Table 1 may be useful in contextualising concerns raised in that section.
5. Top three concerns
In 2021-22, 78% of returns provided information in this section. The 2021-22 concerns are presented alongside the concerns reported in 2018-19 and 2020-21 for comparison. The 2019-20 return is excluded as it was requested alongside the 2020-21 return and some LWMAs chose to report just one set of concerns. Not all concerns related specifically to pieces of equipment or inspections and so the most commonly raised concerns have been separated into strategic and technical concerns.
5.1 Top three strategic concerns
Table 2. Top three strategic concerns reported by LWMAs (2018-19, 2020-21 and 2021-22)
| 2018-19 | 2020-21 | 2021-22 |
|---|---|---|
| Staffing concerns (30%) | Staffing concerns (24%) | Staffing concerns (59%) |
| Lack of funding and resources (21%) | Covid 19 (20%) | Legal Metrology not prioritised (57%) |
| EU Exit (19%) | Legal Metrology not prioritised (9%) | Lack of targeting and intelligence (17%) |
Comments were categorised as ‘staffing concerns’ wherever staffing was directly mentioned, or where words or phrases such as ‘lack of new inspectors coming into profession’ or ‘inspectors leaving the profession and succession planning’ were mentioned. It also includes concerns about competency of staff, including lack of training for new or existing officers.
‘Legal metrology not prioritised’ was mentioned both within the context of LWMAs and wider, including Central Government. Some returns mentioned ‘legal metrology not prioritised’, or ‘lack of funding and resources’, with staffing being implied, so the top concerns may have overlapping themes.
Market surveillance and limited intelligence in relation to metrology related risks across Great Britain featured highly during 2021-22. Finite resources to undertake legal metrology proactive work and few complaints received were cited as having led to a reduction in intelligence received on weights and measures contraventions. Some authorities felt that a national enforcement and targeting strategy led by intelligence on known harms would help address some of these issues.
Other key concerns included a possible increase in use of imperial measures and the crown stamp symbol (13%), and the cost of living crisis (12%) potential impact on legal metrology work. The point was made that the cost of living increase has put a spotlight on how legal metrology inspection and enforcement can ensure that consumers are getting what they are paying for and that traders are competing fairly.
Some of the concerns raised about increased use of imperial measurements included new working standards and sourcing equipment for calibration.
The top strategic concern (staffing) has remained the same since 2018-19.
5.2 Top three technical concerns
Table 3. Top three technical concerns reported by LWMAs (2018-19, 2020-21 and 2021-22)
| 2018-19 | 2020-21 | 2021-22 |
|---|---|---|
| NAWI (25%) | NAWI (8%) | NAWI (14%) |
| Weighbridges (16%) | Weighbridges (6%) | Weighbridges (12%) |
| Intoxicating liquor measuring instruments (12%) | Liquid fuel dispensers (6%) | Liquid fuel dispensers (10%) |
Concerns for each of these categories were counted wherever the type of equipment was directly mentioned. Some comments mentioned unstamped or unapproved equipment being used but did not specify what type of equipment.
The reporting of technical concerns (as opposed to strategic concerns) for 2021-22 show a decrease from 2018-19, where NAWIs were mentioned in 25% of the reported concerns, and weighbridges in 16% of the concerns. This is likely to be because proactive inspections and enforcement activity has only recently re-started and also reflect the national project undertaken in 2018-19 on supermarket NAWI.
6. Conclusions
6.1 Weights and measures activity
The overall number of inspections has steadily increased following a decline during the COVID-19 pandemic. Conversely the number of inspectors active in legal metrology work has been relatively flat but the total number of inspectors has been declining since 2012-13. The main change since 2017-18 was in declining ILMI and NAWI inspections, but there was a spike in interest in this area in 2018-19 due to the NAWI supermarket project. Inspections of AWIs have been steadily declining since 2019-20.
6.2 Compliance of weighing and measuring equipment
Equipment failure rates are relatively low in comparison to business non-compliance rates. The equipment with the highest rates of having the verification mark removed includes both AWIs and Weighbridges followed by LFTMMSs. Only Weighbridges were in line with the equipment reported in the top three technical concerns for 2021-22. The high figure for LFTMMSs in 2021-22, and the low figure for LFMIs, in spite of its inclusion in the top three concerns, may be due to the small numbers involved, or could indicate that there are other concerns which make LFMIs a high priority for market surveillance activity at local level such as increasing fuel costs. The percentage of equipment inspected which had 28 days’ notice issued to bring into compliance and verification marks removed does not line up with the top three technical concerns reported. For example, LFTMMSs and AWIs in 2021-22 had the highest percentages rates, but this could also be attributed to the small number of these types of equipment inspected.
6.3 Measuring metrological compliance in transactions
In contrast to the equipment compliance rates, there are seemingly low levels of business compliance on first inspection across most sectors. The proportion of businesses assisted into compliance increased by 99% between 2020-21 and 2021-22. It may be that other problems were found within businesses aside from equipment compliance. A low level of compliance could also reflect the intelligence-led model that authorities are following. Packaging plants and importers of packaged goods showed the highest proportion of compliance (103% see footnote 1) during 2021-22. The high level of compliance found could be because of the intelligence-led model, or it could simply be due to the small number of businesses of this type visited. Retail outlets had the second lowest proportion of compliance, which does fit with top three concerns, as NAWIs are likely to be the main type of equipment to be found in these businesses.
7. Annexes
7.1 Annex A: Notes on the data
The full dataset of individual returns submitted by LWMAs is published alongside this report as open data.
Caution should be considered when comparing data in this report to previous years due to changes in the methodology and geographical definitions, as well as the effects of the COVID-19 pandemic.
Where proportions and percentages are used, the returns rate has potential to affect figures. Returns received may be reflective of areas with more resource and higher activity, which may skew data. Please note individual LWMA data submission anomalies can result in calculated percentages totalling more than 100%.
Section 70 Process: all LWMAs contacted responded to the data request, however two LWMAs were unable to submit a return in the timescale required.
7.2 Annex B: Acronyms and initialisms
- AWI: Automatic Weighing Instrument
- CTSI: Chartered Trading Standards Institute
- FTE: Full-time equivalent
- ILMI: Intoxicating Liquor Measuring Instrument
- LFD: Liquid Fuel Dispensers
- LFTMMS: Liquid Fuel Tanker Meter Measuring System
- LWMA: Local Weights and Measures Authority
- NAWI: Non-automatic Weighing Instrument
- TSI: Trading Standards Institute
7.3 Footnotes
1: Figures may add to more than 100% due to small errors at individual LWMA level - see Appendix A for more information