Section 70 Weights and Measures report 2019 to 2021
Updated 14 August 2025

© Crown copyright 2025
This publication is licensed under the terms of the Open Government Licence v3.0 except where otherwise stated. To view this licence, visit nationalarchives.gov.uk/doc/open-government-licence/version/3 or write to the Information Policy Team, The National Archives, Kew, London TW9 4DU, or email: psi@nationalarchives.gov.uk.
Where we have identified any third party copyright information you will need to obtain permission from the copyright holders concerned.
This publication is available at https://www.gov.uk/government/statistics/section-70-weights-and-measures-returns-and-reports/section-70-report-2019-to-2021
Introduction
Under Section 70 of the Weights and Measures Act 1985, Local Weights and Measures Authorities (LWMAs) have a statutory duty to report to the Secretary of State the level of local Weights and Measures enforcement work conducted over a twelve-month period.
This report summarises data from both 2019-20 and 2020-21. It outlines where the majority of activity has taken place and highlights the main concerns which have been raised. The report primarily considers the data as it relates to business and equipment compliance, to assist with prioritisation of weights and measures regulatory activity.
Section 70 process
The information requested from LWMAs in both years was as follows:
Measuring compliance of weighing and measuring equipment and pre-packages
For the following equipment:
- liquid fuel dispensers (LFMI)
- liquid fuel tanker meter measuring systems (LFTMMS)
- weighbridges and scales >5t (Weighbridges)
- non-automatic weighing instruments <30kg (NAWI<30kg)
- non-automatic weighing instruments >30kg - <5t (NAWI>30kg<5T)
- automatic weighing instruments (AWI)
- intoxicating liquor measuring instruments (ILMI)
Non-compliance of a weighing or measuring instrument could be the result of: the required conformity assessment procedures were not followed e.g. the instrument bears the incorrect conformity marks; or the essential requirements relating to risk are not met e.g. the measurement error is outside the permissible range. Non-compliance can lead to one of several outcomes. The statistics in this report cover:
- actual or estimated number of pieces of equipment
- number inspected
- number verified
- number found incorrect and 28 days’ notice issued
- number found incorrect and verification mark removed
- number related to prosecution or cautions
- approximate % found outside limit of error
- approximate % of equipment outside limit of error reading short measure
- approximate % of equipment outside limit of error reading excess measure
Measuring metrological compliance in transactions
For the following premises: Packaging plants; importers of packaged goods; businesses selling bulk products by weight or volume; retail outlets; medical institutions.
- number of businesses liable to inspection
- number of businesses due this year
- number of businesses visited
- number of businesses compliant
- number of businesses local council’s assisted into compliance
- estimated cost savings made by the business due to local council’s assistance
Medical weighing equipment
For classes I to IIII:
- How many machines were not stickered but should have been?
- How many machines were pre-2003?
- How many machines were accurate?
- How many machines were stickered?
Staffing
- number of inspectors of Weights and Measures
- number of full-time equivalents (FTE) staff engaged in Weights and Measures work
- number of staff registered and actively studying for the Charted Trading Standards Institute (TSI) Legal Metrology module (TSI is now known as CTSI and is referred to as such in the rest of this report)
Top concerns
- What are the top 3 areas of concern for your region?
- Evidence to support the top 3 areas of concern
- Any other issues to report
Returns received
168 of a possible 192 returns were received for the year 2020-21. This is up from 145 out of 202 in 2018-19. It must be noted that some Local Authorities sent combined returns, so one return might cover several authorities. To account for the fluctuation in return rate, averages or percentage rates have been used where possible. Notes on how the data has been analysed are available in Annex A.
Compliance of weighing and measuring equipment and pre-packages
Inspection rate
Figure 1. Number of equipment inspected each year
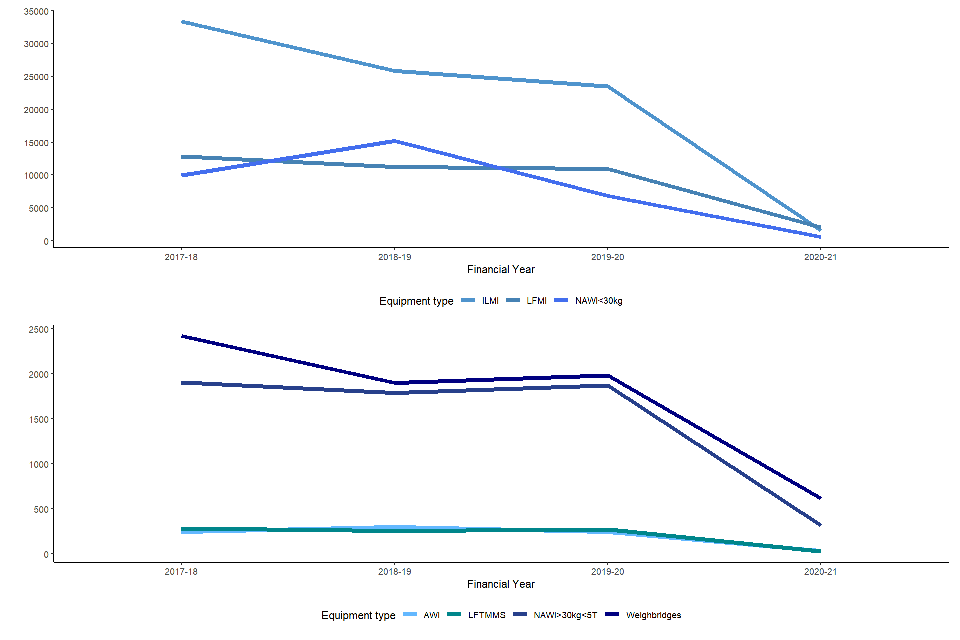
Please note that the graphs in Figure 1 have different y-axis values. Due to knock-on effects of the Covid 19 pandemic only affecting 2020-21, the percentage change in the number of inspections for this year compared with previous years has not been included.
Outcomes of inspections
Figure 2 demonstrates, from all reported non-compliance, the percentage of pieces of equipment that had 28 days’ notice issued. Figure 3 shows the percentage that had the verification mark removed. One piece of equipment may have more than one outcome. For example (noted in the guidance on the returns form), a piece of equipment may initially be subject to 28 days’ notice and subsequently have its verification mark removed if the problem is not rectified.
Figure 2. Percentage of equipment inspected which had 28 days’ notice issued (2019-20 and 2020-21)
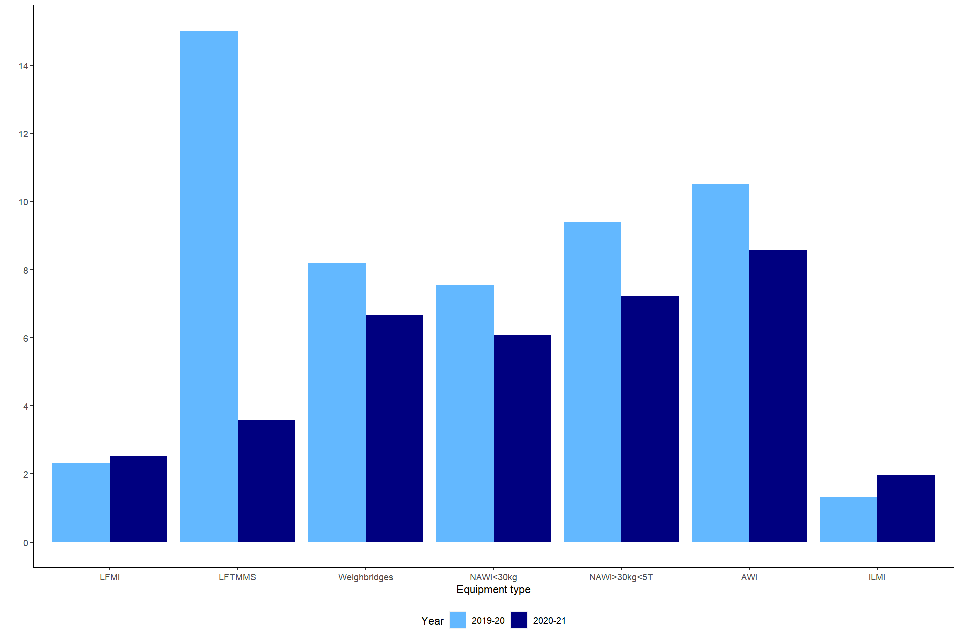
Liquid fuel tanker meter measuring systems (LFTMMS) had a relatively high rate of 28 days’ notice being issued in 2019-20, however this saw the largest change in notices in 2020-21. Due to small numbers, LFTMMS and AWI’s are more susceptible to fluctuations.
Weighbridges and scales saw the percentage of 28 days’ notice being issued fall marginally, although the rate of verification marks being removed increased in 2020-21 (see Figure 3).
Comparatively, intoxicating liquor measuring instruments (ILMI), Liquid fuel dispensers (LFMI) and LFTMMS (which has the highest rates in 2019-20) had low rates of 28 days’ notice being issued, with minor changes for ILMI’s and LFMI’s between 2019-20 and 2020-21.
Figure 3. Percentage of equipment inspected which had the verification mark removed (2019-20 and 2020-21)

Figure 3 shows that ILMI’s had the highest rate of verification marks being removed in 2020-21; 6% of those inspected. This is up from 1% in 2019-20.
The rate of LFTMMS verification marks being removed decreased significantly from 2019-20, changing from having second highest rate to having the joint lowest 2020-21.
There were no inspections relating to prosecutions or cautions in either 2019-20 or 2020-21.
Measuring metrological compliance in transactions
Figure 4: Average number of businesses that were visited on average in 2019-20 and 2020-21
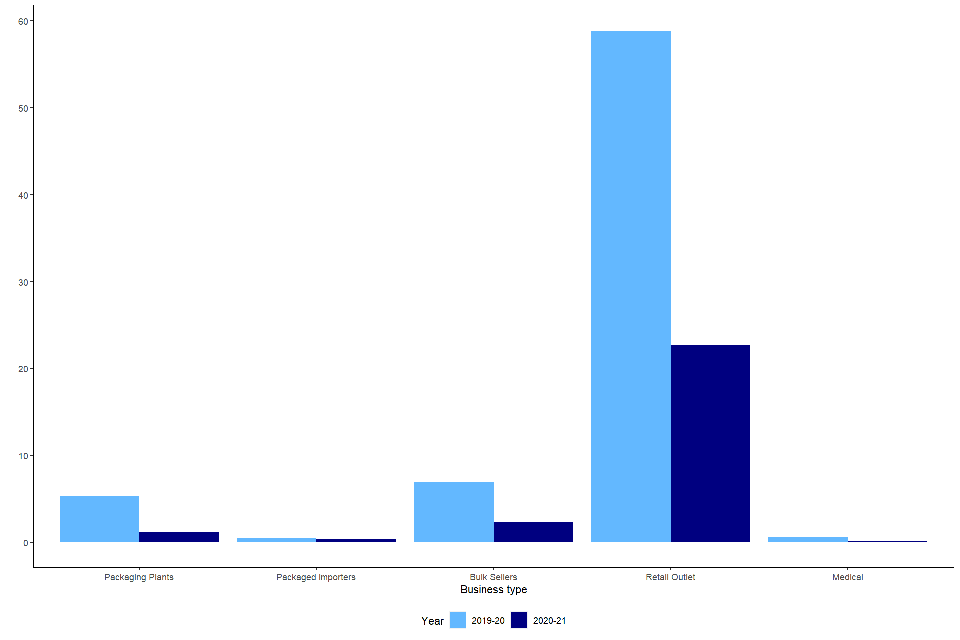
Largely the same pattern of activity can be seen between the two years, with reductions across the board in 2020-21 due to Covid 19 restrictions. On average retail outlets had a change of -36 business visits by LWMA’s (in raw numbers) than the previous year, while Medical Institutions were the least visited type of business in both years.
Figure 5 shows the total rates of compliance for each business type, in 2019-20 and 2020-21. These are broken down into the proportion that were already compliant, and the proportion that were assisted into compliance (the lower section and upper section of each bar, respectively).
Rates of non-compliance are not specifically requested on the Section 70 form. The figures below can indicate where non-compliance may be occurring, but it is not possible to infer exact non-compliance rates.
Figure 5. Business compliance (%) in 2019-20 and 2020-21, with proportion compliant without assistance and proportion assisted into compliance.
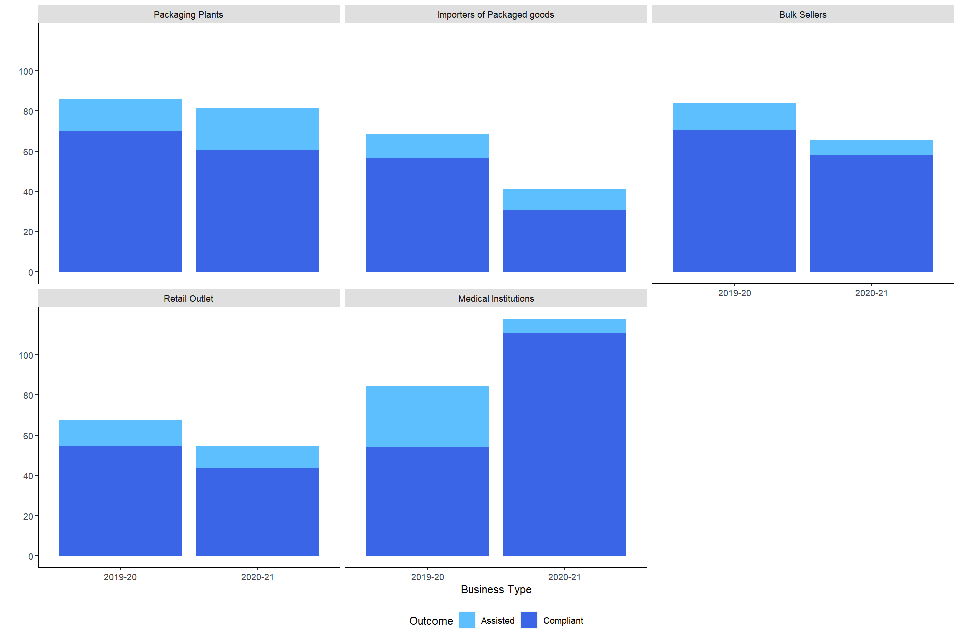
Importers of Packaged goods showed the lowest rate of compliance in 2020-21, at 41% overall. They also had the lowest rate of compliance on first inspection. These were the least frequently visited type of business.
The compliance rate of Medical Institutions increased from 2019-20 to 2020-21; especially those compliant on first inspection (111% compliance, up from 54% compliance).
Although the rate of businesses compliant on first inspection changed by -20.5%, the rate of businesses assisted into compliance changed by -15.7%. As can be seen in Figure 4, this is based on a relatively small sample size (1.8986 total inspections in 2020-21).
Staffing
Figure 6. Total number of inspectors, average number of FTE and average number studying the CTSI Legal Metrology Module, 2012-2021

In 2020-21 there were 793.1 Inspectors, equivalent to 214.5 FTEs. The overall trend shows a change in total numbers of inspectors (-23.7% since 2012-13). There has also been a change in the number of FTE staff engaged in Weights and Measures work (-28.2% since 2012-13). There has been a (-30.2 %) change in the number of officers studying for the CTSI Legal Metrology Module.
Table 1. Change in average number of Weights and Measures inspectors and FTE from 2019-20 to 2020-21 by Local Authority type
| Geography type | 2019-20 | 2020-21 |
|---|---|---|
| County councils | 8.9 inspectors, 1.7 FTE | 9.7 inspectors, 2.1 FTE |
| London Borough | 1.8 inspectors, 0.5 FTE | 1.7 inspectors, 0.5 FTE |
| Metropolitan districts | 3.4 inspectors, 0.7 FTE | 3.2 inspectors, 0.7 FTE |
| Scottish Unitary | 3.9 inspectors, 1.6 FTE | 3.8 inspectors, 1.7 FTE |
| Welsh Unitary | 4.2 inspectors, 1.3 FTE | 4.2 inspectors, 1.3 FTE |
| Unitary authorities | 3.7 inspectors, 0.9 FTE | 3.9 inspectors, 0.9 FTE |
Whilst Figure 6 is useful for monitoring year-on-year trends, it may not account for differences in staffing between different types of Authority. The above figure has been included to reflect this difference.
This suggests that on average some types of Local Authorities (English Unitary, for example) have seen greater changes from 2019-20 to 2020-21, where others (Metropolitan Borough, Welsh Unitary) have largely remained stable.
Staffing and resource is also covered in Part 4: ‘Top 3 concerns as reported by LWMAs’. Figures 6 and 7 may be useful in contextualising concerns raised in Part 4.
Top 3 strategic concerns
In 2019-20, 75% of returns contained information in this section. The figure for 2020-21 was slightly higher at 82%. This difference is mainly because both returns were requested at the same time, and some respondents chose to report just one set of concerns. For this reason, only the 2020-21 concerns are presented here, alongside the concerns reported in 2018-19 for comparison. The percentage of returns containing this information is a slight increase from 2018-19 (79%). Not all concerns related specifically to pieces of equipment or inspections. Therefore, the most commonly raised concerns have been separated into strategic and technical concerns:
Top three strategic concerns
Table 2. Top three strategic concerns reported by LWMAs (2018-19 and 2020-21)
| 2018-19 | 2020-21 |
|---|---|
| Staffing concerns (30%) | Staffing concerns (24%) |
| Lack of funding and resources (21%) | Covid 19 (20%) |
| EU Exit (19%) | Legal Metrology not prioritised (9%) |
Comments were categorised as ‘staffing concerns’ wherever staffing was directly mentioned, or where words or phrases such as ‘lack of new inspectors coming into profession’ or ‘inspectors leaving the profession’ were mentioned. It also includes concerns about competency of staff, including lack of training for new or existing officers.
‘Lack of funding and resources’ were counted wherever either of these two words was specifically mentioned. It may be that some returns mentioned ‘legal metrology not prioritised’, or ‘lack of funding and resources’, with staffing being implied, so the top concerns may have overlapping themes.
‘Covid 19’ was counted anywhere this was specifically mentioned. Many times, this was mentioned in conjunction with lack of funding or resources, so this may explain why this does not feature in the top three concerns reported in 2020-21. Concerns included the ongoing impact on businesses and local authorities, alongside the impact of lack of activities able to take place during lockdowns.
‘Legal metrology not prioritised’ was mentioned both within the context of local authorities and wider, including central government and the media.
The top strategic concern (staffing) remained the same in both years.
Top three technical concerns
Table 3. Top three technical concerns reported by Local Weights and Measures Authorities (2018-19 and 2020-21)
| 2018-19 | 2020-21 |
|---|---|
| NAWI (25%) | NAWI (8%) |
| Weighbridges (16%) | Weighbridges (6%) |
| Intoxicating liquor measuring instruments (12%) | Liquid fuel (6%) |
Concerns for each of these categories were counted wherever the type of equipment was directly mentioned. Some comments mentioned unstamped or unapproved equipment being used but did not specify what type of equipment.
The reporting of technical concerns (as opposed to strategic concerns) for 2020-21 show a decrease from 2018-19, where NAWI’s were mentioned in 25% of the reported concerns, and weighbridges in 16% of the concerns. This is likely to be partly because officers were not able to carry out enforcement activity due to Covid 19 but could also show that the strategic concerns are becoming more significant.
Conclusions
Weights and measures activity
The overall number of inspections shows minimal change from 2018-19 to 2019-20. The main decrease was in NAWI inspections, which is likely due to a spike in interest in this area in 2018-19 due to the NAWI supermarket project. The minimal change is consistent with staffing data from 2018-19, which shows a slight increase in the total number of inspectors. The number of inspections for 2020-21 shows a significant decrease, which can be attributed to the Covid 19 pandemic.
Compliance of weighing and measuring equipment
Equipment failure rates are relatively low in comparison to business non-compliance rates. The equipment with the highest rates of having the verification mark removed includes both NAWI’s and Weighbridges in line with the equipment reported in the top three technical concerns for 2020-21. The high figure for LFTMMS in 2019-20, and the low figure for LFMI’s, in spite of its inclusion in the top three concerns, may be due to the small numbers involved, or could indicate that there are other concerns which make liquid fuel measuring instruments a high priority. The percentage of equipment inspected which had 28 days’ notice issues does not line up with the top three technical concerns reported. For example, LFTMMS in 2019-20 and AWI’s in 2020-21 saw the highest percentages rates, but this could also be attributed to the small number of these types of equipment inspected.
Measuring metrological compliance in transactions
In contrast to the equipment compliance rates, there are seemingly low levels of business compliance on first inspection across most sectors. It may be that other problems were found within businesses aside from equipment compliance. A low rate of compliance could also reflect the intelligence-led model that authorities are following. Importers of packaged goods showed the lowest rate of compliance in 2020-21. However, they were also the least frequently visited type of business. The low rate of compliance found could be a because of the intelligence-led model, or it could simply be due to the small number of businesses of this type visited. Retail outlets had the second lowest rates of compliance, which does fit with top three concerns, as NAWI’s are likely to be the main type of equipment to be found in these businesses. The compliance rate of medical institutions increased significantly from 2019-20 to 2020-21, and this fits with the issues expressed in authorities’ concerns, with medical measuring instruments being mentioned four times less in 2020-21 than in 2019-20, although these were not mentioned enough times to be included in the figures for the overall top three concerns presented in this report.
Annexes
Annex A: Notes on the data
Please note some comparisons were not made in this report due to knock-on effects of the Covid 19 pandemic. Further caution should be considered when comparing data in this report to previous years due to changes in the methodology and geographical definitions.
Where proportions and percentages are used, the returns rate has potential to affect figures. Returns received may be reflective of areas with more resource and higher activity, which may skew data. Please note data submission anomalies can result in calculated percentages totalling more than 100%.
Section 70 Process: The return form asks for the number of officers studying for the ‘TSI Legal Metrology Module’. After page 2, TSI is referred to by its current name (CTSI). The qualification is now the Trading Standards Practitioner Diploma – the data in this report covers the time period before this change occurred.
Annex B: Acronyms and initialisms
- AWI: Automatic Weighing Instrument
- CTSI: Chartered Trading Standards Institute
- FTE: Full-time equivalent
- ILMI: Intoxicating Liquor Measuring Instrument
- LFD: Liquid Fuel Dispensers
- LFTMMS: Liquid Fuel Tanker Meter Measuring System
- LWMA: Local Weights and Measures Authority
- NAWI: Non-automatic Weighing Instrument
- TSI: Trading Standards Institute