Reported road casualties Great Britain: pedestrian factsheet 2021
Published 29 September 2022

© Crown copyright 2022
This publication is licensed under the terms of the Open Government Licence v3.0 except where otherwise stated. To view this licence, visit nationalarchives.gov.uk/doc/open-government-licence/version/3 or write to the Information Policy Team, The National Archives, Kew, London TW9 4DU, or email: psi@nationalarchives.gov.uk.
Where we have identified any third party copyright information you will need to obtain permission from the copyright holders concerned.
This publication is available at https://www.gov.uk/government/statistics/reported-road-casualties-great-britain-pedestrian-factsheet-2021/reported-road-casualties-great-britain-pedestrian-factsheet-2021
This factsheet presents trends from 2004 onwards. However, grouped data for years from 2016 to 2021 is used widely in order to allow sufficiently robust analysis by age, sex and other variables.
This factsheet gives an overview and key statistics on pedestrians involved in road collisions in Great Britain as reported by or to the police. This factsheet examines the main trends in collisions involving pedestrians and the casualties involved.
Pedestrians are one of the vulnerable user groups. They are not protected by a vehicle body in the same way car users are, and tend to be harder for drivers to see on the road. They are, therefore, particularly susceptible to injuries.
Data in this factsheet is from 2004 onwards. Serious and slight injuries have been adjusted to account for changes in the severity reporting systems. More information on the change and adjustment process is available in the Reported Road Casualties GB Annual report 2021.
It should be noted that it has been long known that a considerable percentage of non-fatal casualties are not reported to the police. This should be borne in mind when analysing and interpreting the data.
Main findings
Between 2004 and 2021:
-
fatalities decreased from 671 to 361 (-46%)
-
serious injuries (adjusted) fell by 51%
-
pedestrian traffic (distance walked) grew by 10%
Averaged over the period 2016 to 2021:
-
an average of 8 pedestrians died and 115 were seriously injured (adjusted) per week in reported road collisions
-
a majority of pedestrian fatalities (56%) do not occur at or within 20m of a junction compared to 46% of all seriously injured (adjusted) casualties
-
nearly three in five (58%) of pedestrian fatalities were in collisions involving a single car
-
30% of pedestrian fatalities occurred on rural roads compared to 12% of all pedestrian casualties
-
58% of pedestrian killed or seriously injured (KSI) casualties were male
-
the most common contributory factor allocated to pedestrians in fatal or serious collisions (FSC) with another vehicle was ‘Pedestrian failed to look properly’. The most common factor allocated to the vehicles involved was ‘Driver or rider failed to look properly’
Pedestrian traffic and reported casualties
In 2021, 361 pedestrians were killed in Great Britain, whilst 5,032 were reported to be seriously injured (adjusted) and 11,261 slightly injured (adjusted).
Table 1 and chart 1 show that pedestrian traffic (measured by distance walked) has risen between 2004 and 2021 whilst fatalities, serious and slight injuries have fallen.
Between 2020 and 2021, pedestrian fatalities rose by 4% while pedestrian traffic (distance walked) fell by 4%.
Chart 1: Index of pedestrian traffic (distance walked) and reported pedestrian casualties by severity, GB: 2004 to 2021 (Index 2004=100)
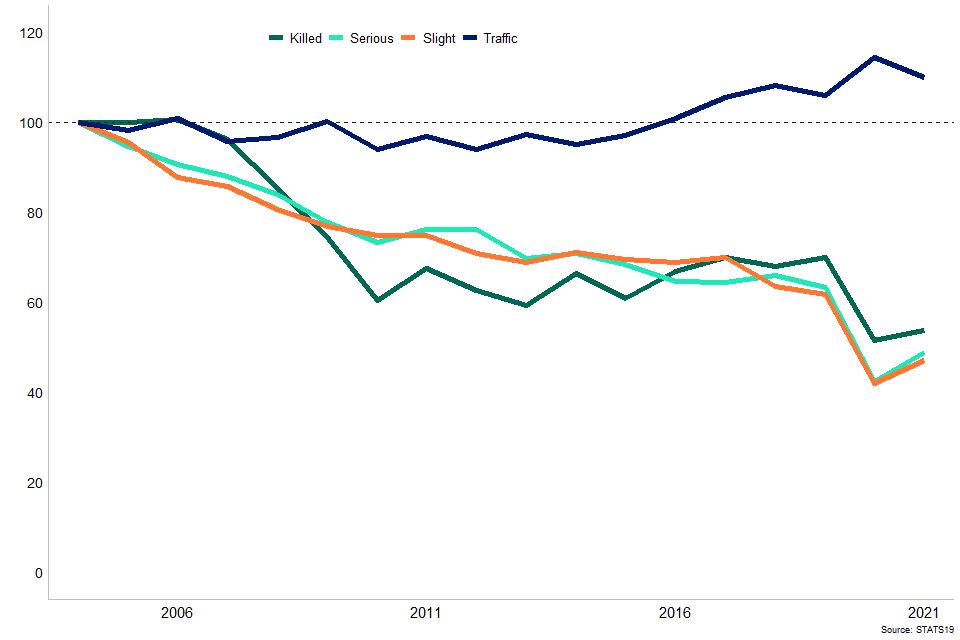
Table 1: Number of reported pedestrian casualties by severity and traffic (pedestrian billion miles walked), GB: 2004 to 2021
| Year | Killed | Serious | Slight | All | Traffic |
|---|---|---|---|---|---|
| 2004 | 671 | 10,318 | 23,892 | 34,881 | 12.52 |
| 2005 | 671 | 9,760 | 22,850 | 33,281 | 12.28 |
| 2006 | 675 | 9,345 | 20,962 | 30,982 | 12.64 |
| 2007 | 646 | 9,082 | 20,463 | 30,191 | 11.99 |
| 2008 | 572 | 8,666 | 19,244 | 28,482 | 12.09 |
| 2009 | 500 | 8,021 | 18,366 | 26,887 | 12.56 |
| 2010 | 405 | 7,566 | 17,874 | 25,845 | 11.78 |
| 2011 | 453 | 7,860 | 17,885 | 26,198 | 12.13 |
| 2012 | 420 | 7,870 | 16,928 | 25,218 | 11.78 |
| 2013 | 398 | 7,190 | 16,445 | 24,033 | 12.17 |
| 2014 | 446 | 7,312 | 16,990 | 24,748 | 11.90 |
| 2015 | 408 | 7,050 | 16,603 | 24,061 | 12.16 |
| 2016 | 448 | 6,657 | 16,445 | 23,550 | 12.64 |
| 2017 | 470 | 6,636 | 16,699 | 23,805 | 13.22 |
| 2018 | 456 | 6,796 | 15,180 | 22,432 | 13.54 |
| 2019 | 470 | 6,528 | 14,772 | 21,770 | 13.27 |
| 2020 | 346 | 4,376 | 10,028 | 14,750 | 14.32 |
| 2021 | 361 | 5,032 | 11,261 | 16,654 | 13.76 |
Source: DfT STATS19, National Travel Survey and Office for National Statistics population data
How far do pedestrians travel?
There are two sources of distance travelled published by the department:
the National Travel Survey (NTS) which provides the number of trips and average distance travelled by person per year for English residents. This is used to derive casualty rates per mile travelled for pedestrians, which also use the Great Britain population figure to estimate total distance walked each year.
the National Road Traffic Census estimates based on annual traffic count data which produces total vehicle miles cycled by type of road. This is used to derive casualty rates per mile travelled for vehicle occupants.
Casualty rates per mile travelled
The pedestrian casualty rate has fallen for all severities in 2021 compared to 2004.
The overall casualty rate fell by 57%. The fatality rate fell by 51% compared to 56% for serious injuries and 57% for slight injuries.
Chart 2: Index of casualty rates of pedestrian casualties by severity, GB: 2004 to 2021 (Index 2004=100)
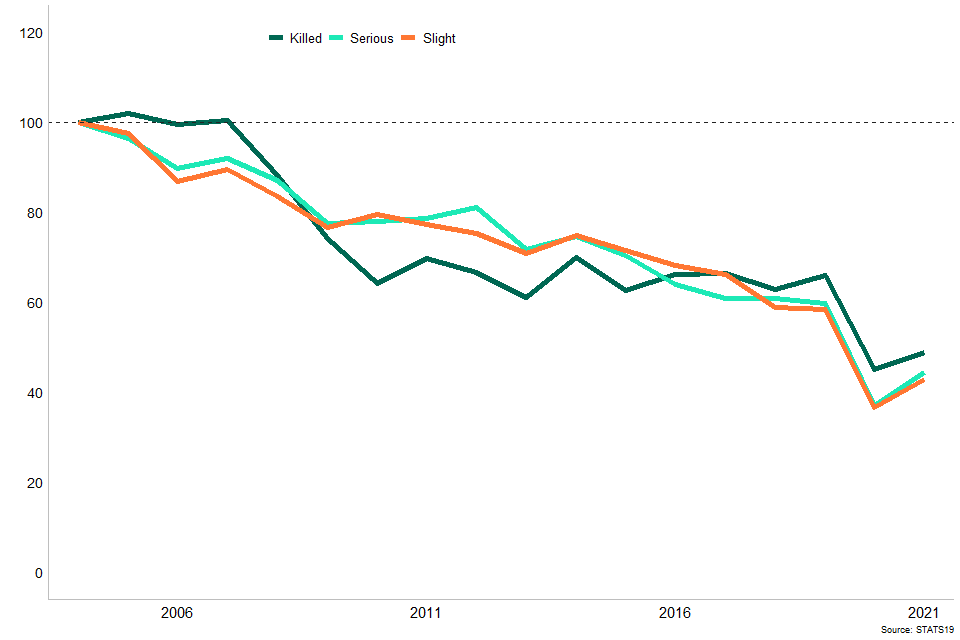
Table 2: Casualty rates of pedestrian casualties by severity per billion miles walked, GB: 2004 to 2021
| Year | Killed | Serious | Slight | All |
|---|---|---|---|---|
| 2004 | 54 | 824 | 1,908 | 2,786 |
| 2005 | 55 | 795 | 1,860 | 2,710 |
| 2006 | 53 | 739 | 1,658 | 2,451 |
| 2007 | 54 | 757 | 1,706 | 2,517 |
| 2008 | 47 | 717 | 1,592 | 2,356 |
| 2009 | 40 | 639 | 1,462 | 2,141 |
| 2010 | 34 | 642 | 1,517 | 2,194 |
| 2011 | 37 | 648 | 1,475 | 2,160 |
| 2012 | 36 | 668 | 1,437 | 2,141 |
| 2013 | 33 | 591 | 1,351 | 1,974 |
| 2014 | 37 | 614 | 1,428 | 2,080 |
| 2015 | 34 | 580 | 1,365 | 1,978 |
| 2016 | 35 | 527 | 1,301 | 1,863 |
| 2017 | 36 | 502 | 1,264 | 1,801 |
| 2018 | 34 | 502 | 1,121 | 1,657 |
| 2019 | 35 | 492 | 1,113 | 1,640 |
| 2020 | 24 | 306 | 700 | 1,030 |
| 2021 | 26 | 366 | 818 | 1,210 |
Sex and age comparisons
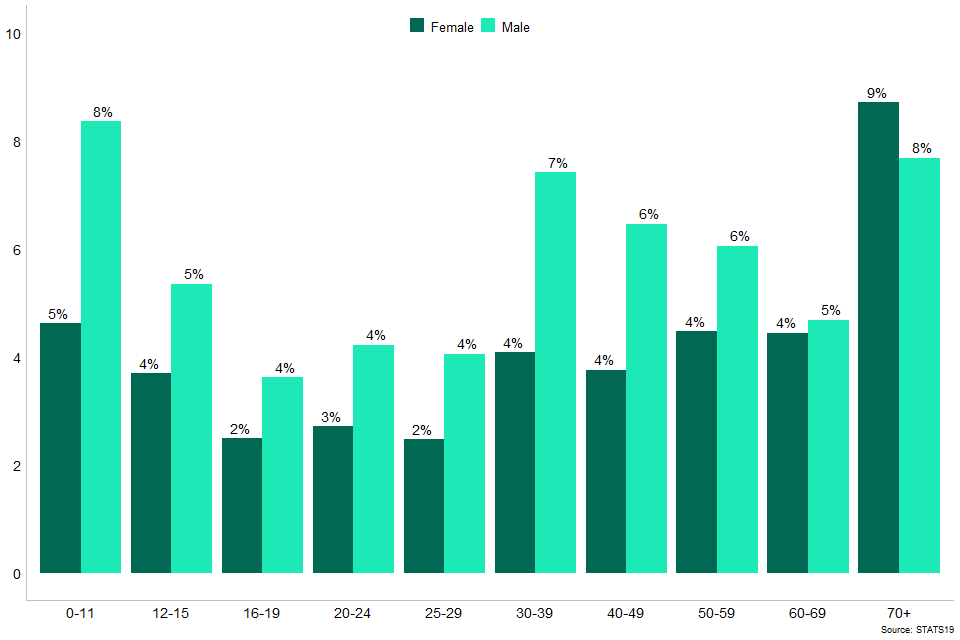
Between 2016 and 2021, 58% of pedestrian casualties were male and 42% female.
There are 1.4 times more male than female pedestrian casualties overall. This compares to 1.8 times more for 30 to 39 year olds, 1.8 times more for children aged under 12 and 0.9 times more for people over 70 - the only age group in which female casualties outnumber males.
Chart 3: Percentage of pedestrian KSI casualties, by sex and age, GB: 2016 to 2021
Which vehicles are involved in collisions with pedestrians?
Between 2016 and 2021, most pedestrian fatalities occurred in a single vehicle collisions involving a car (1469).
However, the highest proportion of casualties that are fatal occur in 1 vehicle collisions involving an HGV (16.0%). The second highest proportion (8.2%) occurred in collisions when 3 or more vehicles were involved.
Table 3: Pedestrian casualties in reported road collisions by severity showing other vehicles involved GB: 2016 to 2021
| Vehicles | Fatalities | Serious injuries | Slight injuries | All casualties | % Fatalities |
|---|---|---|---|---|---|
| 1 pedal cycle | 15 | 771 | 1,686 | 2,472 | 0.6% |
| 1 motorcycle | 66 | 1,472 | 3,665 | 5,203 | 1.3% |
| 1 car | 1,469 | 26,404 | 63,054 | 90,927 | 1.6% |
| 1 bus or coach | 119 | 1,288 | 2,835 | 4,242 | 2.8% |
| 1 light goods vehicle | 166 | 2,276 | 5,161 | 7,603 | 2.2% |
| 1 heavy goods vehicle | 277 | 578 | 876 | 1,731 | 16.0% |
| 1 other vehicle | 61 | 661 | 1,815 | 2,537 | 2.4% |
| 2 vehicles involved | 261 | 2,070 | 4,488 | 6,819 | 3.8% |
| 3 or more other vehicles involved | 117 | 505 | 805 | 1,427 | 8.2% |
| Total | 2,551 | 36,025 | 84,385 | 122,961 | 2.1% |
Time of day of collisions
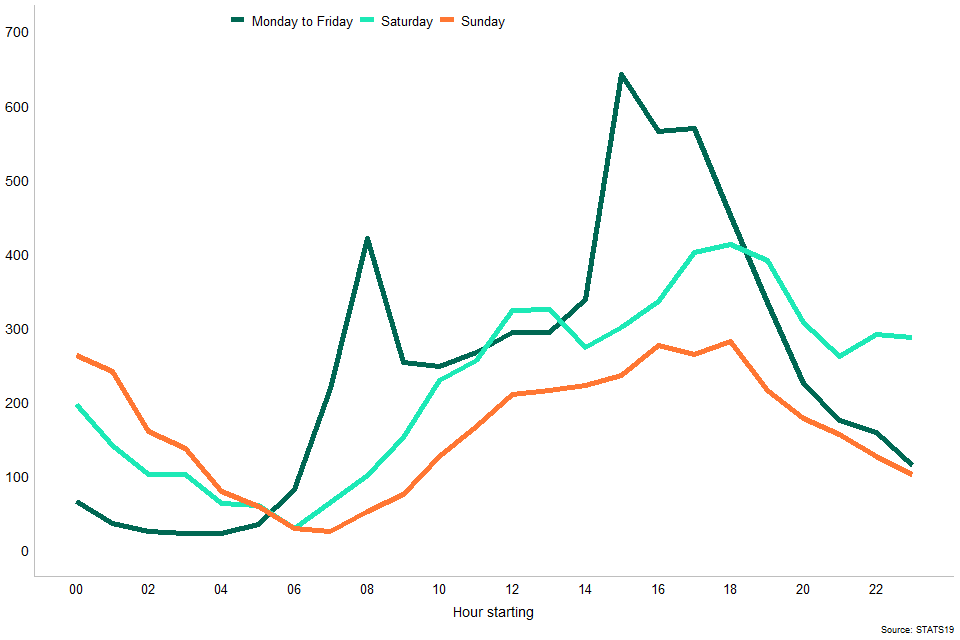
The weekday peak time for pedestrian KSIs is from 3pm to 6pm. By contrast, the peak is later in the early evening at weekends.
Chart 4: Reported pedestrian KSIs by hour of day and day of week, GB: 2016 to 2021
What type of road?
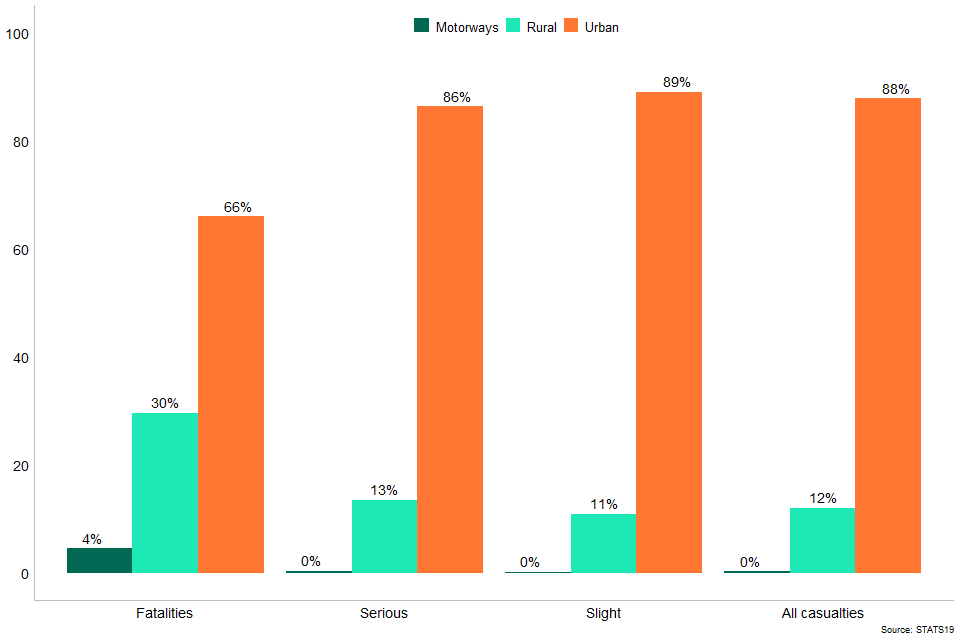
Chart 5 shows that between 2016 and 2021, 66% of pedestrian fatalities occurred on urban roads compared to 88% of all pedestrian casualties. 4% of pedestrian fatalities occurred on motorways. This would be people outside their vehicles whether they are moving at the time or not.
Chart 5: Percentage of pedestrian casualties, by urban or rural classification and severity, GB: 2016 to 2021
Urban roads are those within an area of population of 10,000 or more. The definition is based on the 2001 Communities and Local Government definition of Urban Settlements. Roads outside these areas will be classified as Rural. More information is available in the user guide to urban and rural area definitions.
Vehicle movement on the road
A majority of pedestrian fatalities (56%) do not occur at or within 20m of a junction compared to 46% of serious injuries (adjusted). However, 30% of fatalities occur at a junction compared to 39% of serious injuries (adjusted). Pedestrian fatalities at roundabouts represent 3% of all fatalities in contrast to 4% of serious injuries (adjusted).
Table 4: Percentage of pedestrian KSI casualties by severity and junction detail where the collision occurred, GB: 2016 to 2021
| Junction | Fatalities | Serious | Slight | All Casualties |
|---|---|---|---|---|
| Crossroads | 7.9% | 8.6% | 8.1% | 8.2% |
| T, Y or staggered junction | 25.6% | 32.1% | 31.6% | 31.6% |
| Junction - more than 4 arms (not roundabout) | 0.9% | 1.4% | 1.5% | 1.4% |
| Other junction | 3.9% | 5.2% | 5.4% | 5.3% |
| Roundabout | 2.5% | 2.8% | 2.9% | 2.9% |
| Mini-roundabout | 0.5% | 0.9% | 1.1% | 1.0% |
| Slip road | 1.6% | 0.6% | 0.5% | 0.6% |
| Private drive or entrance | 1.5% | 1.9% | 2.2% | 2.1% |
| Not at junction or within 20 metres | 55.5% | 46.3% | 45.5% | 45.9% |
| Unknown | 0.0% | 0.3% | 1.1% | 0.8% |
Contributory factors in collisions
Contributory factors provide an insight into how and why collisions occur. The factors are largely subjective as they reflect the opinion of the reporting police officer. They are assigned quickly at the occurrence of the collision and often without extensive investigations and so should be interpreted with caution. They are likely to be affected in part by preconceptions police officers have of certain vehicle groups. A maximum of 6 factors can be recorded for each collision.
Table 5 shows the 10 most common contributory factors that have been allocated to pedestrians that have been involved in fatal or serious collisions (FSC) (between 2016 and 2021) and contrasts this with the number allocated to vehicles in these collisions.
The 3 most common contributory factor assigned to pedestrians were ‘failed to look properly’ followed by ‘pedestrian careless, reckless or in a hurry’ and ‘failure to judge vehicle’s path or speed’.
Table 5: Contributory factors allocated to pedestrians and vehicles involved in fatal or serious collisions with pedestrian, GB: 2016 to 2021
| Pedestrian contributory factor | Count |
|---|---|
| Pedestrian failed to look properly | 13,377 |
| Pedestrian careless, reckless or in a hurry | 4,918 |
| Pedestrian failed to judge vehicle`s path or speed | 4,425 |
| Crossing road masked by stationary or parked vehicle | 2,969 |
| Pedestrian impaired by alcohol | 2,841 |
| Pedestrian wearing dark clothing at night | 1,761 |
| Dangerous action in carriageway (eg. playing) | 1,536 |
| Pedestrian wrong use of pedestrian crossing facility | 1,399 |
| Pedestrian disability or illness, mental or physical | 1,003 |
| Pedestrian impaired by drugs (illicit or medicinal) | 497 |
The 3 most common contributory factor assigned to vehicles involved in collisions with pedestrians were ‘failed to look properly’ followed by ‘driver or rider careless, reckless or in a hurry’ and ‘failure to judge other person’s path or speed’.
| Vehicle contributory factor | Count |
|---|---|
| Driver or rider failed to look properly | 7,768 |
| Driver or rider careless, reckless or in a hurry | 2,858 |
| Driver or rider failed to judge other person`s path or speed | 1,787 |
| Stationary or parked vehicle(s) | 1,243 |
| Poor turn or manoeuvre | 1,142 |
| Exceeding speed limit | 1,057 |
| Aggressive driving | 1,011 |
| Loss of control | 840 |
| Travelling too fast for conditions | 740 |
| Dazzling sun | 738 |
Further information
Further information on road collisions and casualties can be found in Reported Road Casualties in Great Britain.
Published tables on casualties in reported road collisions are available.
Non-fatal casualties since 2016 have been affected by a large number of police forces changing their reporting systems which has had a large impact on the classification of injuries recorded. Further details are in the 2021 annual report.
Road collisions and safety statistics guidance including accompanying notes and definitions is available.
Personal travel statistics within Great Britain covering English residents is available from the National Travel Survey.
Road traffic statistics provide estimates of the vehicle miles travelled each year in Great Britain by vehicle type, road category and region.
Instructions for printing and saving
Depending on which browser you use and the type of device you use (such as a mobile or laptop) these instructions may vary.
Tablets and mobile devices normally have the option to “find in text” and “print or save” in their sharing or quick options menu of their browser, but this will vary by device model.
How to search
Select Ctrl and F on a Windows laptop or Command and F on a Mac
This will open a search box in the top right-hand corner of the page. Type the word you are looking for in the search bar and press enter.
Your browser will highlight the word, usually in yellow, wherever it appears on the page. Press enter to move to the next place it appears.
Contact details
Road safety statistics
Email roadacc.stats@dft.gov.uk