Proven reoffending statistics: July to September 2021
Published 27 July 2023
Applies to England and Wales

© Crown copyright 2023
This publication is licensed under the terms of the Open Government Licence v3.0 except where otherwise stated. To view this licence, visit nationalarchives.gov.uk/doc/open-government-licence/version/3 or write to the Information Policy Team, The National Archives, Kew, London TW9 4DU, or email: psi@nationalarchives.gov.uk.
Where we have identified any third party copyright information you will need to obtain permission from the copyright holders concerned.
This publication is available at https://www.gov.uk/government/statistics/proven-reoffending-statistics-july-to-september-2021/proven-reoffending-statistics-july-to-september-2021
1. Main points
This publication provides the proven reoffending results for the July to September 2021 offender cohort, alongside historical data from 2010 onwards. This is the first post-pandemic cohort to not overlap with any Covid-related lockdowns or other operational restrictions. However, it is still affected by the continued recovery of the courts system, particularly around continued delays in the processing of court cases.
| The overall proven reoffending rate was 25.2% for the July to September 2021 offender cohort. | This represents an increase of 1.7 percentage points from the same quarter in 2020 and an increase of 0.5 percentage points over the last quarter. |
| Adult offenders had a proven reoffending rate of 25.0%. | This is an increase of 2.0 percentage points since the same quarter in 2020 and an increase of 0.6 percentage points over last quarter. |
| Juvenile offenders had a proven reoffending rate of 30.3%. | The juvenile reoffending rate decreased by 2.1 percentage points from the same quarter in 2020 and decreased by 1.3 percentage points over last quarter. |
| Adults released from custody or starting court orders had a proven reoffending rate of 32.4%. | This represents an increase of 2.4 percentage points since the same quarter in 2020 and an increase of 1.0 percentage points over last quarter. |
| Adults released from custodial sentences of less than 12 months had a proven reoffending rate of 55.1%. | This is a decrease of 3.2 percentage points from the same quarter in 2020. Those released from sentences of less than or equal to 6 months had a proven reoffending rate of 57.6%, which is a decrease of 2.5 percentage points since the same quarter in 2020. |
This bulletin, associated tables and data tools present the proportion of offenders who reoffend (proven reoffending rate) and the number of proven reoffences by offender history, demographics, police force area, probation area, local authority, and youth offending teams. For technical details and a glossary of terms, please refer to the accompanying guide to proven reoffending.
For any feedback related to the content of this publication, please let us know at reoffendingstatistics@justice.gov.uk
2. Statistician’s comment
“Figures presented in this statistical release show proven reoffending statistics for the July to September 2021 offender cohort. Proven reoffences are measured over a one-year follow-up period and a further six-month waiting period to allow for offences to be proven in court.
The overall proven reoffending rate was 25.2% for the July to September 2021 offender cohort, which represents an increase of 1.7 percentage points from the same quarter in 2020 and an increase of 0.5 percentage points over last quarter. Interestingly, whilst the reoffending rate for the adult cohort increased over the same quarter in 2020 (from 23.0% to 25.0%), the reoffending rate for the juvenile cohort decreased (from 32.5% to 30.3%). This may be an effect of the continually decreasing juvenile offender cohort size.
This publication covers the first post-pandemic cohort to not overlap with any Covid-related lockdowns or other operational restrictions. However, this cohort is still affected by the continued recovery of the courts system. Particularly, continued delays in the processing of cases mean that increased numbers of reoffence convictions may fall outside of six-month waiting period and therefore not be counted in these statistics.”
3. How is proven reoffending measured?
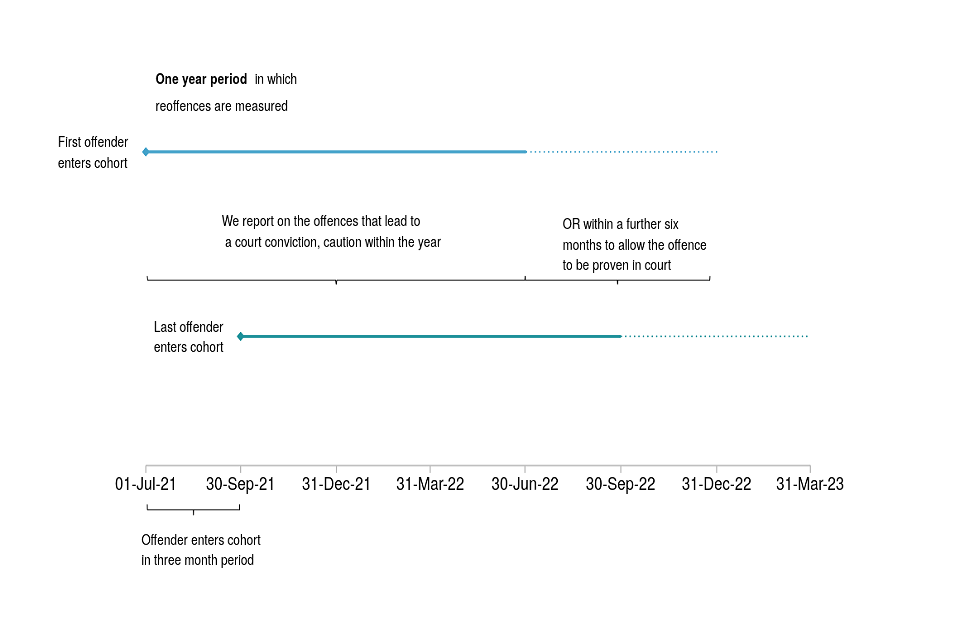
An offender is included in this publication cohort if they were released from custody, received a non-custodial conviction at court, or received a reprimand or warning in the three-month period spanning July to September 2021.
A proven reoffence is defined as any offence committed in a one-year follow-up period that leads to a court conviction, caution, reprimand, or warning in the one-year follow-up or within a further six-month waiting period to allow the offence to be proven in court. This is shown in the diagram below in relation to the latest offender cohort.
Figure 1: Timeline of the measurement period of proven reoffending for the July to September 2021 cohort (Source: Guide to Proven Reoffending Statistics)
Users should be cautious when making any comparison between cohorts before and after October 2015, due to a change in data source from October 2015 onwards. Additionally, it is important to note that the reoffending rates presented in this publication are not comparable to publications prior to October 2017, as these reported on a 12-month cohort. Users of these statistics should also be aware that comparisons between 3-monthly cohorts are likely to be more volatile as cohort populations are smaller than the previous 12-month ones.
For further details on this and how proven reoffending is measured please see the guide to proven reoffending statistics and ‘How the measure of proven reoffending has changed and the effect of these changes’.
4. Overall – adult and juvenile offenders
The overall proven reoffending rate was 25.2% for the July to September 2021 offender cohort, with around 21,000 of the 83,000 offenders in the cohort committing a proven reoffence.
4.1 Rates of proven reoffending
The overall proven reoffending rate for this quarter was 25.2%, representing an increase of 1.7 percentage points from the same quarter in 2020. Over time, the overall proven reoffending rate has fluctuated between 23.1% and 31.8% (figure 2).
Figure 2: Percentage of adult and juvenile offenders[footnote 1] in England and Wales who commit a proven reoffence, by quarter, April to June 2010 - July to September 2021 (Source: Table A1)
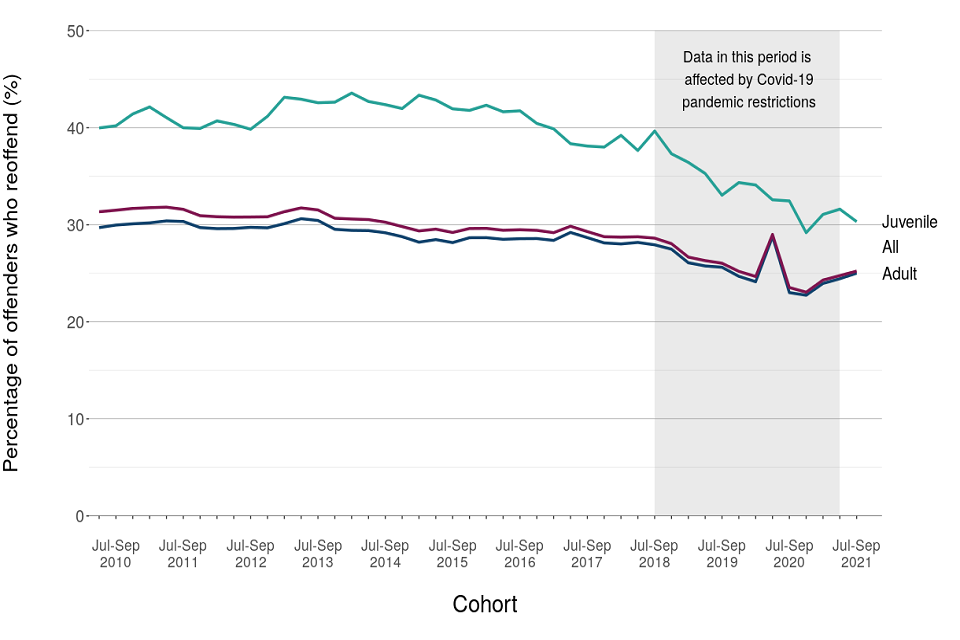
Adult offenders had a proven reoffending rate of 25.0%. This is an increase of 2.0 percentage points since the same quarter in the previous year, and an increase of 0.6 percentage points over last quarter. The rate has fluctuated between 22.7% and 30.6% over the timeseries. However, up until the recent quarters affected by the pandemic, the adult reoffending rate has remained broadly flat.
Juvenile offenders had a proven reoffending rate of 30.3%. The juvenile reoffending rate decreased by 2.1 percentage points from the same quarter in the previous year and decreased by 1.3 percentage points over last quarter. The rate of reoffending has fluctuated between 29.2% and 43.6% over the timeseries but has been in general decline since the January to March 2016 quarter.
4.2 Cohort size
Approximately 83,000 offenders were released from custody, received a non-custodial conviction at court, or received a reprimand or warning in the July to September 2021 cohort. Around 21,000 of those committed a proven reoffence within the one-year follow up period (figure 3). In total, reoffenders committed almost 76,000 proven reoffences over the follow-up period.
Figure 3: Number of offenders in England and Wales who commit a proven reoffence, by quarter, October to December 2015 - July to September 2021 (Source: Table A1)
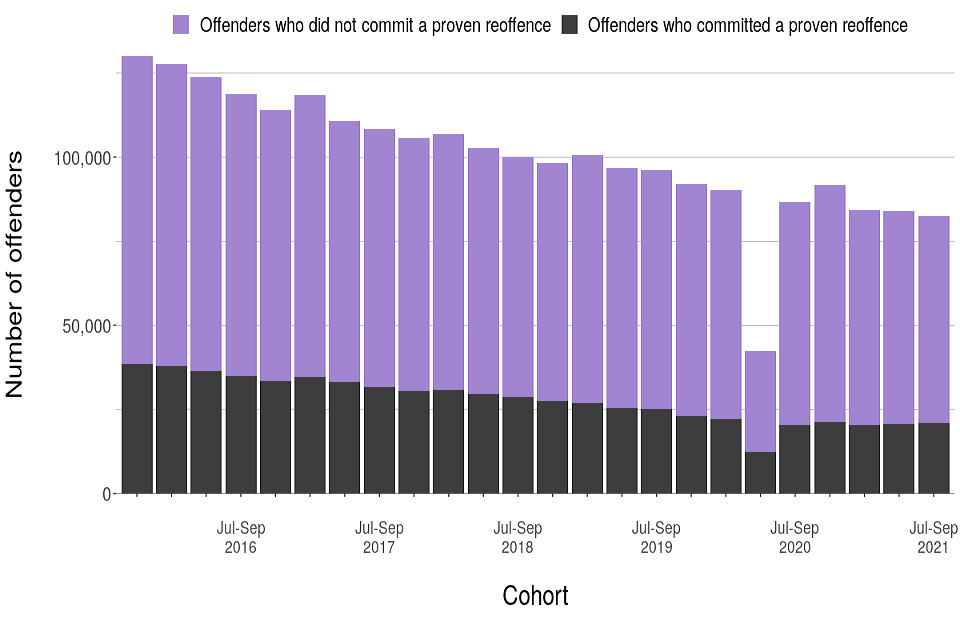
We continue to observe a general decline in the volume of offenders in the cohort and in the volume of subsequent proven reoffenders. The size of the offender cohort has decreased by 57.0% since the same quarter in 2010 and decreased by 4.6% since the same quarter in 2020. Similarly, the number of reoffenders has decreased by 65.6% since the same quarter in 2010 but increased by 2.3% since 2020.
The decline in the juvenile cohort size is particularly pronounced. The number of juvenile offenders in the cohort has decreased by 88.6% since the same quarter in 2010 and, unlike the adult cohort, this decline has continued post-pandemic. This is likely a reflection of continued efforts to divert juveniles away from the criminal justice system where appropriate. The relatively small cohort sizes also means that juvenile reoffending rates may be more prone to volatility and so caution should be taken when making comparisons with these rates.
Within the combined, overall cohort, reoffenders committed an average of 3.65 reoffences each (also known as the frequency rate). More broadly, the overall frequency rate has been in general decline since a peak of 4.06 in 2016. The total number of reoffences has also generally declined over this period but has increased by 6.5% since the same quarter in 2020. Adult reoffenders committed on average 3.63 reoffences each, whilst juvenile reoffenders committed on average 4.10 reoffences each.
5. Overall - offender demographics
The age group with the highest reoffending rate was 15 to 17-year-olds (30.9%). Men reoffended at a higher rate (26.2%) than women (20.0%).
5.1 Age
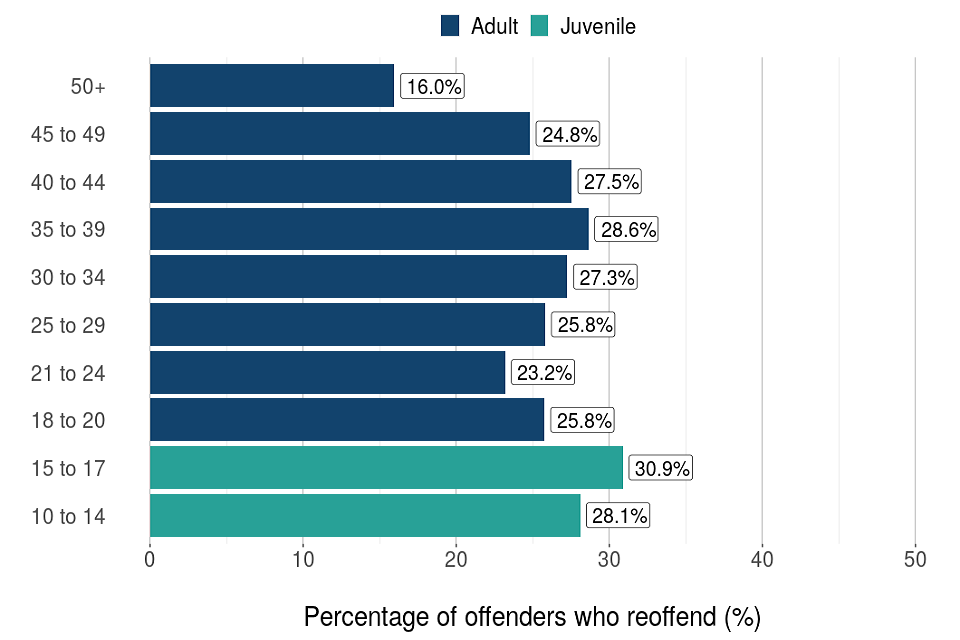
The age group with the highest reoffending rate was 15 to 17-year-olds, at 30.9% (figure 4), which is consistent with historical norms. This was closely followed by the 35 to 39-year-old offenders, with a reoffending rate of 28.6%. For adults, the proven reoffending rate starts to fall with increasing age after the 35 to 39-year-old group.
Figure 4: Percentage of adult and juvenile offenders in England and Wales who commit a proven reoffence, by age, July to September 2021 (Source: Table A3)
5.2 Sex
Of the overall offender cohort, 85% were male and 15% were female. The gender split has remained reasonably stable over time.
Male offenders reoffended at a higher rate of 26.2% compared to female offenders who reoffended at a rate of 20.0%. Since 2010, these rates have fluctuated between 23.9% and 33.8% for males and 18.3% to 24.4% for females.
5.3 Geography
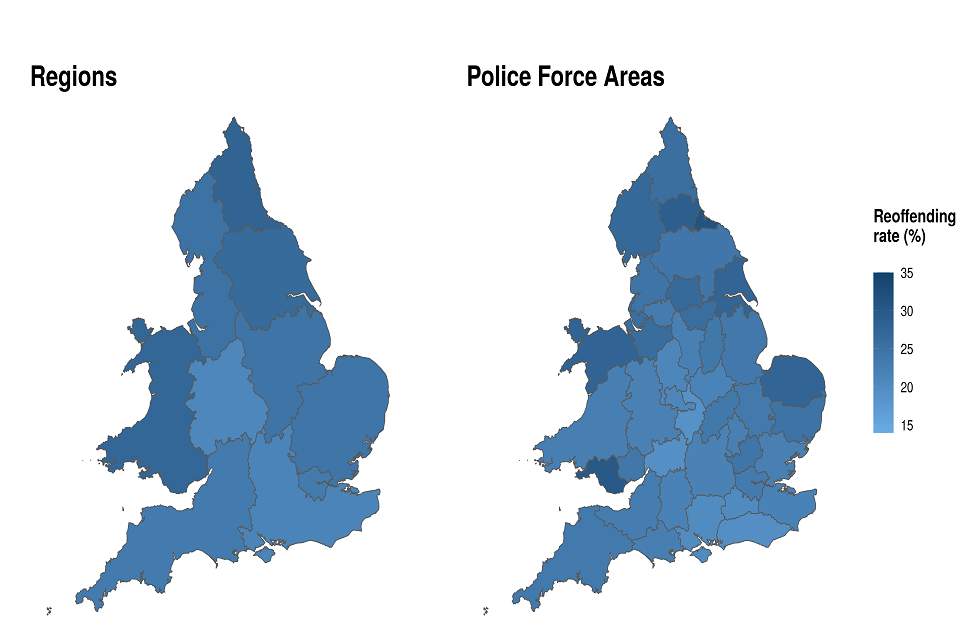
The geographical region with the greatest decrease in the overall rate of reoffending compared to the same quarter in 2020 was London, with a 2.6 percentage point decrease. The geographical region with the greatest increase was the East of England, with a 0.5 percentage point increase (figure 5).
The Police Force Area (PFA) with the greatest decrease in the overall rate of reoffending compared to the same quarter in 2020 was Derbyshire, with a 2.9 percentage point decrease. The PFA with the greatest increase was Suffolk, with a 2.4 percentage point increase.
Note that reoffending rates by geographical region are rolling yearly averages, rather than quarterly values, to prevent unintended disclosure from small cohort sizes. An offender’s geographical location is based on their postcode on the date they received their disposal. Care should be taken when making direct comparison of regions, since the presented rates do not control for offender demographics.
Additionally, although there may be some overlap, the geographical regions shown are distinct from the Probation Service areas. The rates shown are for all offenders, not just those managed by the Probation Service. Reoffending rates for geographical regions, therefore, do not necessarily correspond to rates for Probation Service areas.
Figure 5: Percentage of adult and juvenile offenders in England and Wales who commit a proven reoffence, by Region and Police Force Area (PFA), October 2020 to September 2021 (Source: Geographic Data Tool)
5.4 Ethnicity
The highest reoffending rate was observed for White offenders, 26.6%, which is a 2.2 percentage point increase compared to the same quarter last year. This was followed by Black offenders (26.1%, 0.3 percentage point increase), Asian offenders (21.6%, 2.2 percentage point increase), and offenders in the Other category (17.5%, 1.9 percentage point decrease).
6. Reoffending by disposal type
Adults released from custody or starting a court order had a proven reoffending rate of 32.4%, representing an increase of 2.4 percentage points since the same quarter last year.
Juvenile offenders given youth cautions or released from custody had differing proven reoffending rates, at 20.2% and 56.8% respectively.
Users should exercise caution when comparing the effectiveness of different sentences because the presented rates do not control for differences in offender characteristics receiving those sentences - for further information please consult recent research on the impact of short custodial sentences, community orders and suspended sentence orders on reoffending as well as the guide to proven reoffending statistics.[footnote 2]
6.1 Adult offenders
The proven reoffending rate for adult offenders starting a court order[footnote 3] was 30.6%, an increase of 4.6 percentage points when compared to the same quarter in 2020, and an increase of 1.1 percentage points when compared to the previous quarter[footnote 4].
The proven reoffending rate for adult offenders released from custody was 37.4%, a decrease of 1.9 percentage points compared to the same quarter in the previous year. The proven reoffending rate varied by custodial sentence lengths (figure 6).
Figure 6: Percentage of adult offenders released from custody who commit a proven reoffence by custodial sentence length, by quarter, April to June 2010 - July to September 2021 (Source: Table C2a)
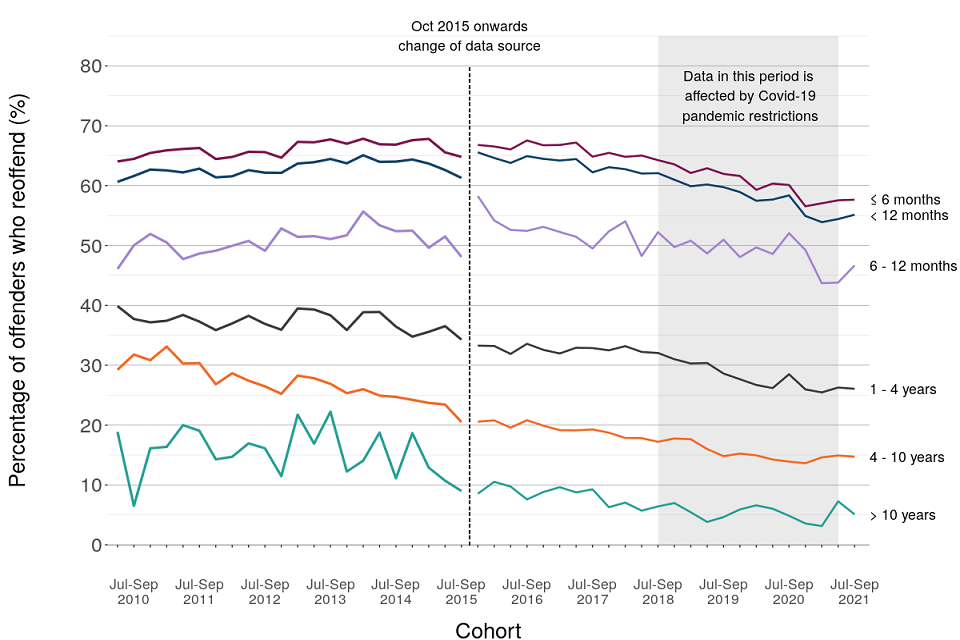
Adults released from custodial sentences of less than 12 months had a proven reoffending rate of 55.1%, whilst those with sentences of 12 months or more reoffended at a substantially lower rate, at 21.7%. This is a decrease of 3.2 percentage points and a decrease of 1.8 percentage points respectively from the same quarter in 2020.
6.2 Juvenile offenders
Juvenile offenders given reprimands, warnings or youth cautions[footnote 5] had a proven reoffending rate of 20.2%, a decrease of 3.3 percentage points since the same quarter in 2020. Those given a first tier penalty had a proven reoffending rate of 29.7%, an increase of 0.4 percentage points since the same quarter in 2020. Those released from custody had a proven reoffending rate of 56.8%, which has decreased by 8.1 percentage points since the same quarter in 2020[footnote 6].
Figure 7: Percentage of juvenile offenders released from custody or given a reprimand, warning or caution who commit a proven reoffence, by quarter, April to June 2010 - July to September 2021 (Source: Table C1b)
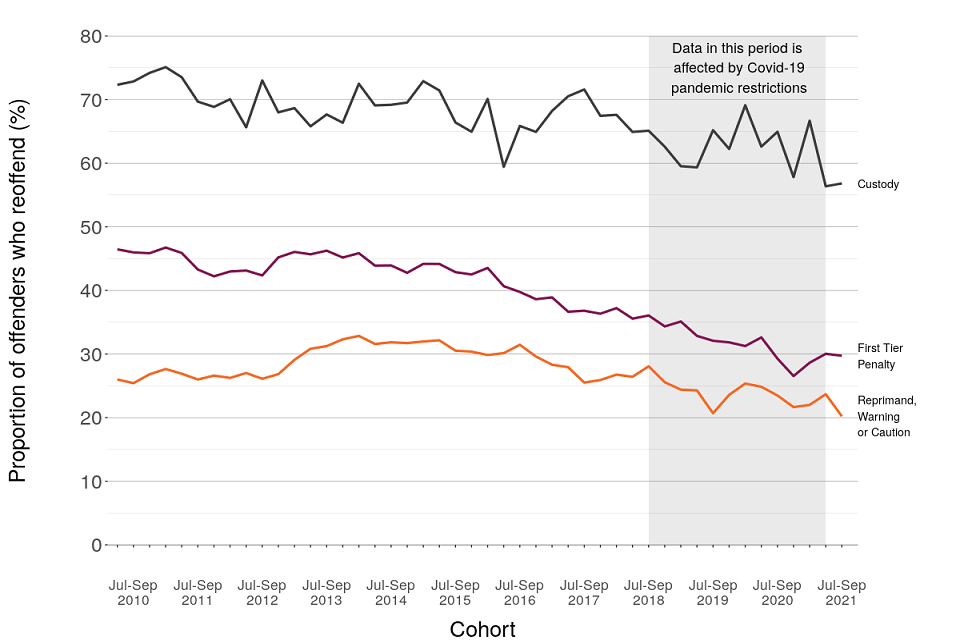
For the July to September 2021 cohort, 44 juvenile offenders were released from custody and 25 (56.8%) were proven to have committed a reoffence within a year.
7. Reoffending by index offence type
For the July to September 2021 adult cohort, the index offence[footnote 7] category associated with the highest reoffending rate was theft (49.9%).
This is an increase of 5.9 percentage points, from 44.0%, in the same quarter in 2020.
For adult offenders, the highest reoffending rate of 49.9% was for those with an index offence of theft. For juvenile offenders, the highest reoffending rate of 58.7% was for those with an index offence of criminal damage and arson (figure 8).
Figure 8: Percentage of adult and juvenile offenders in England and Wales who commit a proven reoffence, by index offence, July to September 2021 (Source: Table A4a/b)
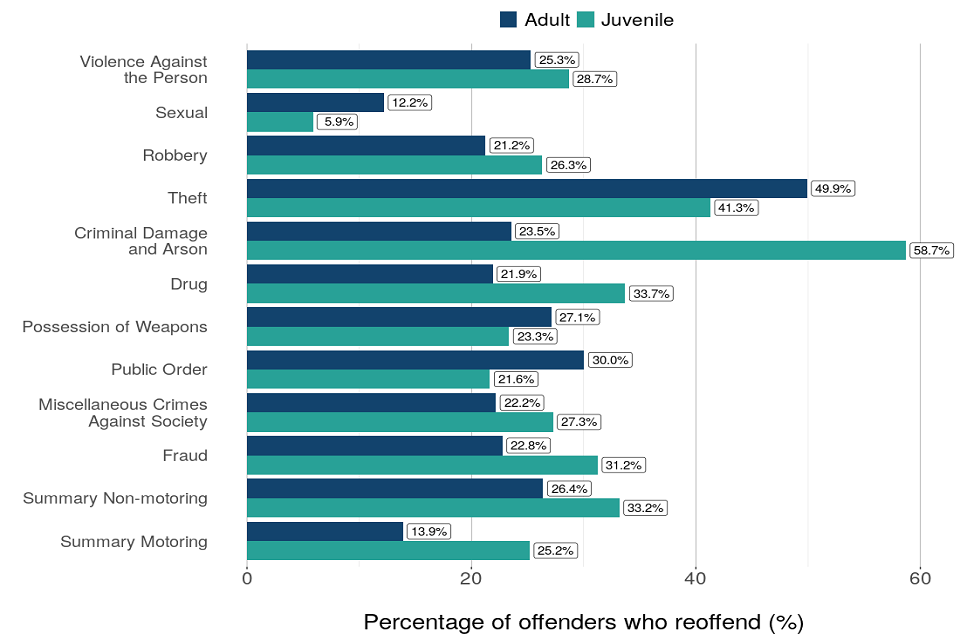
For adult offenders, the second highest reoffending rate was for those with a public order index offence (30.0%). The lowest rate of reoffending (12.2%) was observed among those with a sexual offence as their index offence. The public order index offence category saw the largest percentage point decrease in reoffending rate since the same quarter in 2020, with a 3.5 percentage point difference. Those with an index offence of theft saw the largest increase of 5.9 percentage points over the same period.
For juvenile offenders, the second highest reoffending rate was for those with an index offence of theft at 41.3%. Offenders who had committed a sexual index offence had the lowest rate of reoffending (5.9%). Those who committed a public order index offence saw the largest percentage point decrease in reoffending rate since the same quarter in 2020, a 10.5 percentage point difference. Criminal Damage and Arson index offences represented the largest percentage point increase over the same period (a 19.9 percentage point difference).
Due to a slight database inconsistency, the “other” offence category has the highest rate of reoffending in the adult index offence table (Table A4a). To avoid misrepresentation, and since this category is a mix of offence types, this category has been removed from the analysis and charts.
8. Reoffending by proven reoffence type
For the July to September 2021 adult cohort, 26.0% of proven reoffences were theft, making up the highest proportion of reoffences.
This represents an increase of 1.2 percentage points compared to the same period in 2020.
For the adult offender cohort, the highest proportion of proven reoffences (26.0%) were for theft (figure 9). For the juvenile offender cohort, summary non-motoring offences made up the largest proportion of reoffences (27.4%).
Figure 9: Percentage of proven reoffences for adult and juvenile offenders committed in the one-year follow-up period in England and Wales, by reoffence type, July to September 2021 (Source: Table B3)
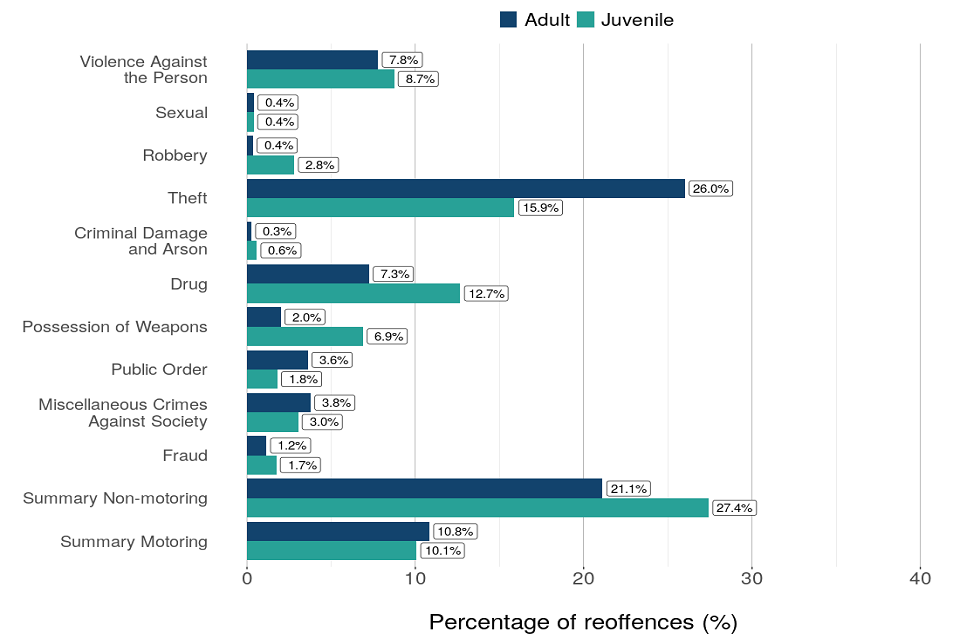
For the adult offender cohort, the second highest proportion of proven reoffences were for summary non-motoring offences (21.1%). Despite the general decrease in the number of proven reoffences committed by adult offenders in recent cohorts, the share of each reoffence category has remained broadly stable over time.
For the juvenile offender cohort, theft offences make up the second largest proportion of reoffences (15.9%), followed by drug offences (12.7%). There has been some variation time over in the share of each reoffence category, with violence against the person having an increasingly larger proportion of total juvenile reoffences within more recent cohorts; currently standing at 8.7% of total proven reoffences.
For adult and juvenile offender cohorts combined, 32.5% of all reoffences took place within three months after release from custody or after receiving a non-custodial conviction at court, a reprimand, or a warning. This percentage increases to 57.1% within six months and steadily increases at an average rate of 7.1% per month beyond that point.
As in section 4, the “other” offence category has been removed from analysis and charts.
9. Reoffending by number of previous offences
Offenders with 11 or more previous offences[footnote 8] had the highest rate of reoffending (41.4% for adults and 65.0% for juveniles).
For both adult and juvenile offenders, the rate of proven reoffending increases with the number of previous offences committed, as shown in figure 10.
Figure 10: Percentage of adult and juvenile offenders in England and Wales who commit a proven reoffence, by number of previous offences, July to September 2021 (Source: Table A5a)
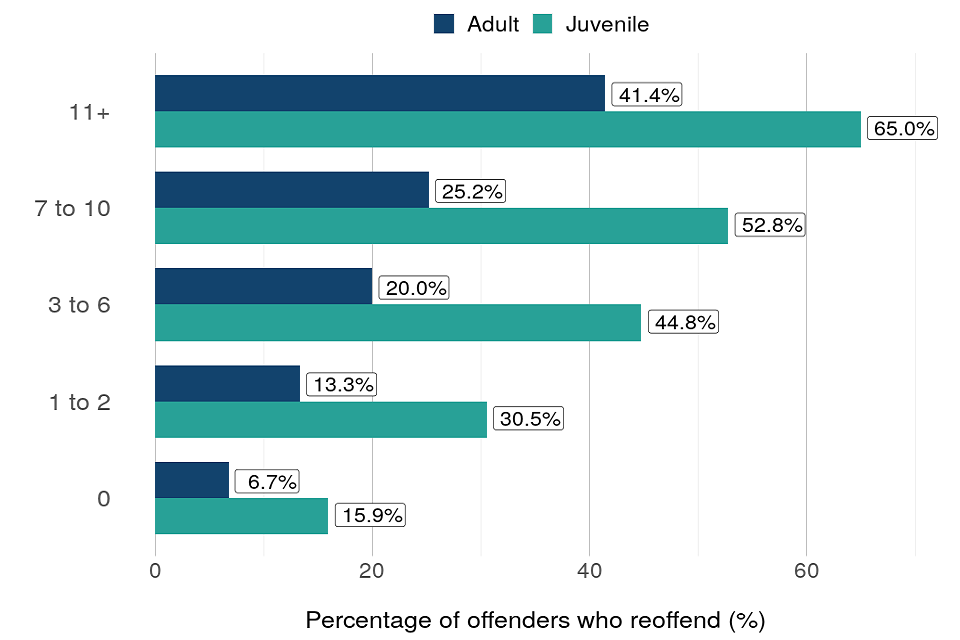
In the July to September 2021 cohort, the proven reoffending rate for adults ranged from 6.7% for offenders with no previous offences to 41.4% for offenders with 11 or more previous offences. Those with 11 or more previous offences made up 39.5% of all adult offenders in the cohort, represented 65.4% of all adult reoffenders and committed 75.9% of all adult proven reoffences. The proven reoffending rate for juveniles ranged from 15.9% for offenders with no previous offences to 65.0% for offenders with 11 or more previous offences.
10. Further information
10.1 Accompanying files
As well as this bulletin, the following products are published as part of this release:
- A set of overview tables, covering each section of this bulletin.
- Data tools providing proven reoffending data for England and Wales, split by various categories (covering October 2010 - September 2021).
- A technical guide to proven reoffending statistics providing information on how proven reoffending is measured and the data sources used.
- A data quality statement which outlines our policies for producing quality statistical outputs and the information provided to maintain our users’ understanding and trust.
10.2 National Statistics status
National Statistics status means that official statistics meet the highest standards of trustworthiness, quality and public value. All official statistics should comply with all aspects of the Code of Practice for Official Statistics. They are awarded National Statistics status following an assessment by the Authority’s regulatory arm. The Authority considers whether the statistics meet the highest standards of Code compliance, including the value they add to public decisions and debate.
It is the Ministry of Justice’s responsibility to maintain compliance with the standards expected for National Statistics. If we become concerned about whether these statistics are still meeting the appropriate standards, we will discuss any concerns with the Authority promptly. National Statistics status can be removed at any point when the highest standards are not maintained, and reinstated when standards are restored.
10.3 Future publications
Our statisticians regularly review the content of publications. Development of new and improved statistical outputs is usually dependent on reallocating existing resources. As part of our continual review and prioritisation, we welcome user feedback on existing outputs including content, breadth, frequency and methodology. Please send any comments you have on this publication including suggestions for further developments or reductions in content.
10.4 Contact
Press enquiries should be directed to the Ministry of Justice press office:
Tel: 020 3334 3536
Email: newsdesk@justice.gsi.gov.uk
Other enquiries and feedback on these statistics should be directed to the Data and Analysis division of the Ministry of Justice:
Liz Whiting, Head of Reducing Reoffending and Probation Statistics
Ministry of Justice, 10th Floor, 102 Petty France, London, SW1H 9AJ
Email: reoffendingstatistics@justice.gov.uk
Next update: 26 October 2023
URL: www.gov.uk/government/collections/proven-reoffending-statistics
© Crown copyright
Produced by the Ministry of Justice
Alternative formats are available on request from reoffendingstatistics@justice.gov.uk
-
Juveniles are defined as those aged 10 to 17 years old. ↩
-
Proven reoffending rates by disposal should not be compared to assess the effectiveness of sentences, as there is no control for known differences in offender characteristics and the type of sentence given. For further information see Annex D of the October 2016 publication (page 41) and the guide to proven reoffending statistics. ↩
-
Community order or suspended sentence order. ↩
-
For proven reoffending statistics, a disposal is defined as a caution, court order, custody, or other disposal resulting from a conviction at court, such as a fine or discharge. A different methodology is used for proven reoffending statistics by disposal type. The first proven offence within each disposal is treated as the start point for measuring proven reoffending. Therefore, some offenders will appear in more than one disposal category. ↩
-
Reprimands and warnings for youths were abolished under the Legal Aid Sentencing and Punishment of Offenders Act 2012 with effect from 8 April 2013 and replaced with youth cautions. Youth cautions are a formal out-of-court disposal that can be used as an alternative to prosecution for juvenile offenders in certain circumstances. A youth caution may be given for any offence where the young offender admits an offence and there is sufficient evidence for a realistic prospect of conviction, but it is not in the public interest to prosecute. ↩
-
The juvenile proven reoffending data by disposal uses the same methodology as that adopted for adult reoffending by disposal (see section 3 for more details). ↩
-
An index offence refers to the offence that leads to an offender being included in the offender cohort. ↩
-
Previous offences are those committed prior to an offender’s index offence. ↩