Proven reoffending statistics: April to June 2020
Published 28 April 2022
Applies to England and Wales

© Crown copyright 2022
This publication is licensed under the terms of the Open Government Licence v3.0 except where otherwise stated. To view this licence, visit nationalarchives.gov.uk/doc/open-government-licence/version/3 or write to the Information Policy Team, The National Archives, Kew, London TW9 4DU, or email: psi@nationalarchives.gov.uk.
Where we have identified any third party copyright information you will need to obtain permission from the copyright holders concerned.
This publication is available at https://www.gov.uk/government/statistics/proven-reoffending-statistics-april-to-june-2020/proven-reoffending-statistics-april-to-june-2020
1. Main points
This publication provides the proven reoffending results for the April to June 2020 offender cohort. The volume of offenders associated with this latest cohort has decreased sharply due to the impact of the COVID-19 pandemic, with the overall size decreasing by 56.3% since the same quarter in 2019. This has resulted in figures being considerably more volatile across a number of subgroups.
| The overall proven reoffending rate was 29.0% for the April to June 2020 offender cohort. | This represents the largest year-on-year increase in the timeseries, an increase of 2.7 percentage points from the same quarter in 2019. |
| Adult offenders had a proven reoffending rate of 28.8% | This is an increase of 3.0 percentage points since the same quarter in 2019 and the largest year-on-year increase in the timeseries. |
| Juvenile offenders had a proven reoffending rate of 32.6%. | The juvenile reoffending rate decreased by 2.7 percentage points from the same quarter in the previous year. However, for context, the number of offenders in the cohort has fallen by 93% since the same financial quarter in 2009. |
| Adults starting a court order had a proven reoffending rate of 37.0%. | This represents a 7.7 percentage point increase since the same quarter last year, and the largest year-on-year increase in the timeseries . |
| Adults released from prison had a proven reoffending rate of 38.6%. | This is a decrease of 4.8 percentage points from the same quarter in 2019. Those released from sentences of 12 months or more reoffended at a lower rate at 22.3% (a 3.4 percentage point decrease) compared to those who served a sentence of less than 12 months at a rate of 57.7% (a 2.5 percentage point decrease). |
This bulletin, associated tables and data tools present the proportion of offenders who reoffend (proven reoffending rate) and the number of proven reoffences by offender history, demographics, individual prisons, probation area, local authorities and youth offending teams. For technical details please refer to the accompanying guide to proven reoffending statistics.
For any feedback related to the content of this publication, please let us know at ESD@justice.gov.uk
2. Statistician’s comment
“Figures presented in this statistical release show proven reoffending statistics for the April to June 2020 offender cohort. Proven reoffences are measured over a one-year follow-up period and a further six-month waiting period to allow for offences to be proven in court.
This latest offender cohort represents the first for which the cohort period itself overlaps entirely with the first national lockdown due to the pandemic; this included court closures leading to sharp decreases in the number of cases processed at the criminal court[footnote 1]. Although there has been a gradual decrease in the offender cohort size over time, latest figures show a much sharper decrease in cohort size (of 56.3%) since the same quarter in 2019, and the largest year-on-year reduction in the timeseries. The reoffending follow-up and waiting periods for this cohort also continue to overlap with both the second and third national lockdowns[footnote 2]. While there were no court closures during these two latter lockdowns, police recorded crime data have shown overall reductions in the reporting and recording of many crime types during periods of lockdown[footnote 3]. Similarly to the offender cohort size therefore, the number of reoffenders also fell sharply over the same period (a decline of 51.8%), again representing the largest year-on-year reduction in the timeseries. The overall proven reoffending rate was 29.0% for the April to June 2020 offender cohort, a 2.7 percentage point increase from the same quarter in 2019 and the largest year-on-year increase in the reoffending rate since the same quarter in 2009. Prior to this quarter, the trend had been downward for recent offender cohorts, for which the corresponding reoffending and waiting periods have been affected by the impact of the pandemic.
These more acute trends are broadly reflected in separate figures for adults and juveniles (although the juvenile reoffending rate itself has continued to decrease), as well as results by disposal type.
Figures for this latest offender cohort period are now showing an even more pronounced impact of the pandemic on reoffending figures. During this period of volatility, proven reoffending rates are likely to continue oscillating in the short-term before potentially more stable trends are observed as we move further away from the periods of lockdowns.”
2.1 How is proven reoffending measured?
An offender enters the cohort if they were released from custody, received a non-custodial conviction at court or received a reprimand or warning in a three-month period: April to June 2020. It is important to note that this is not comparable to publications prior to the October 2017 proven reoffending publication, which reported on a 12-month cohort.
A proven reoffence is defined as any offence committed in a one-year follow-up period that leads to a court conviction, caution, reprimand or warning in the one-year follow-up or within a further six-month waiting period to allow the offence to be proven in court as shown in the diagram below in relation to the latest offender cohort.
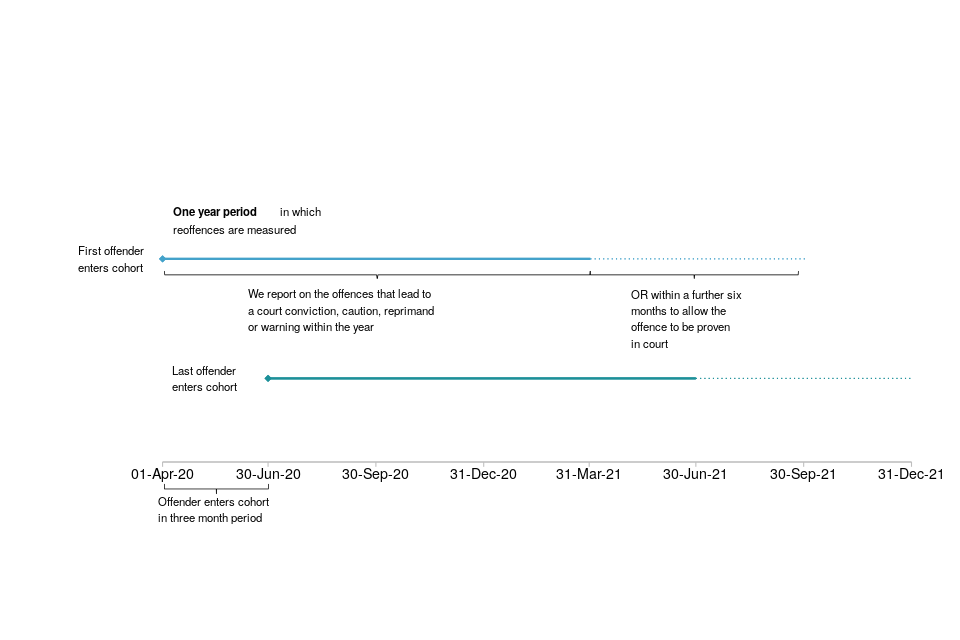
How is proven reoffending measured
The timeseries presented in this publication spans the April to June 2008 through to the April to June 2020 offender cohorts.
Latest proven reoffending statistics based on annual average cohorts can be found at: annual tables.
Users should be cautious when making any comparison between cohorts before and after October 2015. This is because there is a change in data source from October 2015 onwards. In addition, users should be cautious when comparing the 3-monthly cohorts to one another (e.g. October to December 2018 to July to September 2018). This is due to the smaller 3-month cohort size the measure is likely to be more variable than the previous 12-month cohort measure of reoffending. For further details on this, and how proven reoffending is measured, please see the guide to proven reoffending statistics and ‘How the measure of proven reoffending has changed and the effect of these changes’.
3. Overall – adult and juvenile offenders
The overall proven reoffending rate was 29.0% for the April to June 2020 offender cohort.
This represents the largest year-on-year increase in the timeseries and an increase of 2.7 percentage points from the same quarter in 2019. The overall cohort size itself has seen a decrease of 56.3% over the same period due to the impact of the COVID-19 pandemic; this has resulted in figures being considerably more volatile.
Proven reoffences are measured over a one-year follow-up period and a further six-month waiting period to allow for offences to be proven in court. Unlike previous cohorts which had been affected to varying degrees by the pandemic, the April to June 2020 offender cohort represents the first for which the cohort period itself overlaps with the phase of operational restrictions. Limits on criminal court activity during spring 2020 meant a reduction in the volumes of cases processed and an increase in outstanding cases in Magistrates’ and Crown Courts[footnote 4].
In addition, this also coincides with the first set of lockdown restrictions put in place more generally which may have had an effect on offending behaviour. As a result, we now observe acute effects on the volume of offenders in the cohort and the volume of subsequent proven reoffenders, and hence considerably more volatility.
The size of the offender cohort has shrunk by 56.3% since the same quarter in 2019; similarly, the number of reoffenders also decreased over the same period (a decline of 51.8%). These changes in both the volumes of offenders and reoffenders represent the largest year-on-year reductions in the timeseries.
The extent to which the decline in the number of offenders outpaces the decrease in reoffenders is also the greatest observed in the timeseries. This has led to the overall proven reoffending rate for the April to June 2020 cohort standing at 29.0%, a 2.7 percentage point increase from the same quarter in 2019 and the largest year-on-year increase since the same quarter in 2009 (figure 1). This follows a downward trend in the reoffending rate for recent offender cohorts affected by the pandemic. Over time, the rate has fluctuated between 24.7% and 31.8%.
Reoffenders within this latest cohort committed an average of 3.8 reoffences each (also known as the frequency rate). More broadly, the frequency rate gradually increased since 2009, indicating that a higher number of reoffences were gradually being committed by a smaller number of individuals. However there has been a general reduction in the frequency rate for more recent offender cohorts, with the latest figures representing a 0.5% decrease since the same quarter in the previous year. As with the offender and reoffender volumes for this latest cohort, the number of proven reoffences has decreased sharply, by 52.0%, since the same quarter in 2019.
Figure 1: Proportion of adult and juvenile offenders in England and Wales who commit a proven reoffence and the number of offenders in each cohort, April 2009 to June 2020 (Source: Table A1)
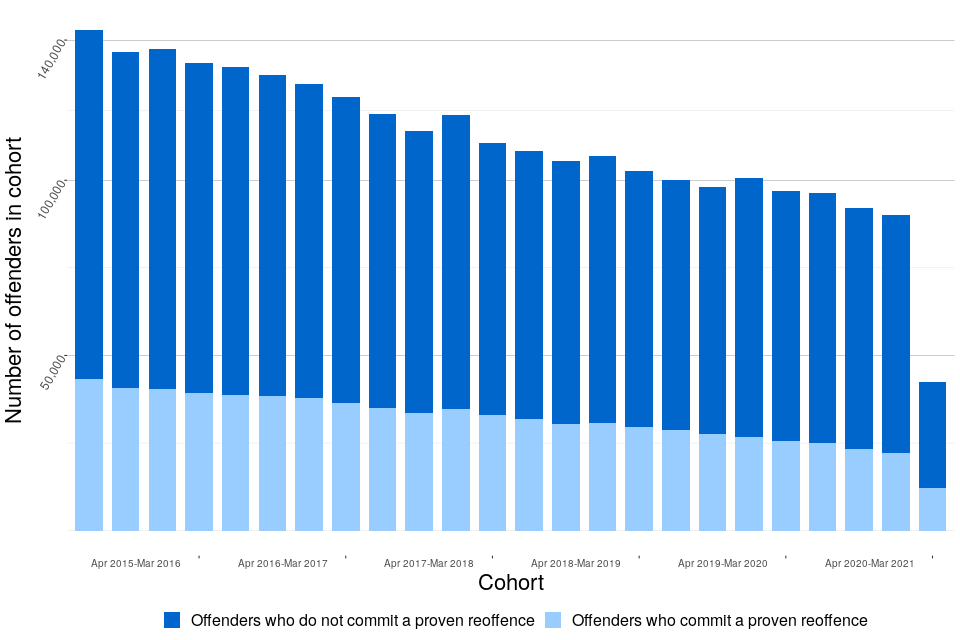
Figure 1: Proportion of adult and juvenile offenders in England and Wales who commit a proven reoffence and the number of offenders in each cohort, April 2009 to June 2020 (Source: Table A1)
Of this offender cohort, 86% were male and 14% were female, with the gender split remaining reasonably stable over time. Male offenders reoffended at a higher rate of 30.0% compared to female offenders who reoffended at a rate of 23.1%. Since 2009, these rates have fluctuated between 25.7% and 33.8% for males and 19.4% to 24.4% for females.
4. Adult offenders
Adult offenders had a proven reoffending rate of 28.8%.
This is an increase of 3.0 percentage points since the same quarter in 2019 and the largest year-on-year increase in the timeseries.
The adult reoffending rate had remained broadly flat since 2009. However, the latest figure for the April to June 2020 cohort was 28.8%, a 3.0 percentage point increase since the same quarter in 2019.
This increase in the reoffending rate follows reductions observed for more recent cohorts and represents the largest year-on-year increase since 2009. Over time, the rate has fluctuated between 24.1% and 30.6%.
As with the overall proven reoffending rate, this latest increase in the adult rate is due to the extent of the disparity between the volume of offenders entering the cohort and volume of subsequent reoffenders; the size of the offender cohort has shrunk by 56.5% since the same quarter in 2019, likely due to the impact of court closures, and therefore outpaced the reduction in the number of reoffenders over the same period (51.4%).
For the latest quarterly cohort, just under 44,000 proven reoffences were committed over the one-year follow-up period by over 11,000 adults. Those that reoffended committed on average 3.83 reoffences, a 0.1% decrease since the same quarter in 2019.
Figure 2: Proportion of adult offenders in England and Wales who commit a proven reoffence, by number of previous offences, April to June 2020 (Source: Table A5a)
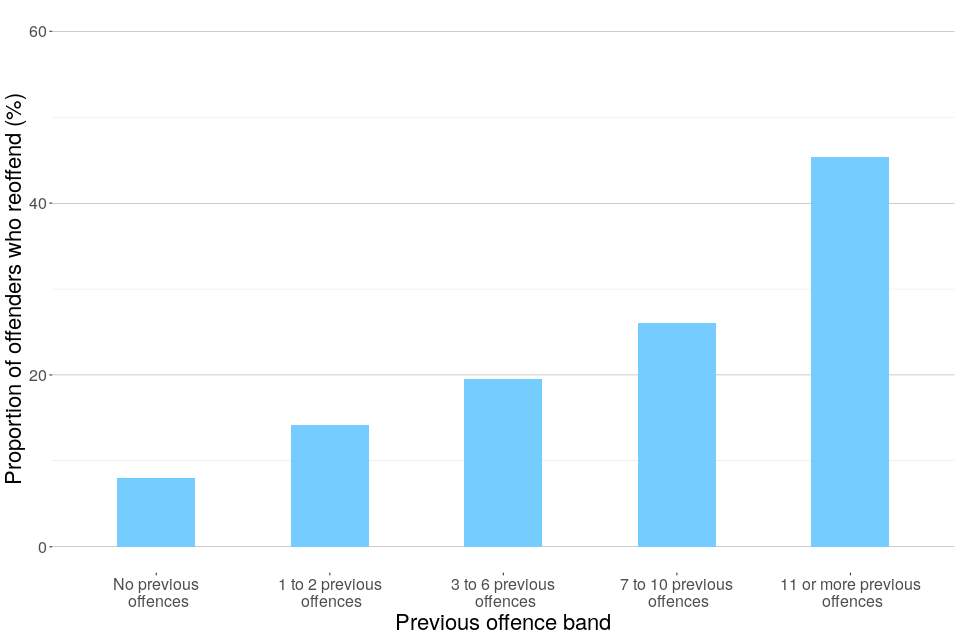
Figure 2: Proportion of adult offenders in England and Wales who commit a proven reoffence, by number of previous offences, April to June 2020 (Source: Table A5a)
Offenders with a larger number of previous offences have a higher rate of proven reoffending than those with fewer previous offences. In the April to June 2020 cohort, the proven reoffending rates for adults ranged from 8.0% for offenders with no previous offences to 45.3% for offenders with 11 or more previous offences (figure 2).
Adult offenders with 11 or more previous offences made up 46% of all adult offenders in the cohort, represented 72% of all adult reoffenders and committed 81% of all adult proven reoffences.
5. Juvenile offenders[footnote 5]
Juvenile offenders had a proven reoffending rate of 32.6%.
The juvenile reoffending rate decreased by 2.7 percentage points from the same quarter in the previous year. However, for context, the number of offenders in the cohort has fallen by 93% since the same financial quarter in 2009.
In contrast to the increase in the overall and adult reoffending rates, there was a 2.7 percentage point decrease in the juvenile reoffending rate compared to the same quarter in the previous year, which stands at 32.6%.
Under 1,000 of approximately 3,000 juvenile offenders in the April to June 2020 cohort, committed a reoffence within a one-year follow-up period (equivalent to around 3,000 proven reoffences). As with the overall figures, the numbers of offenders in the juvenile cohort, reoffenders and reoffences has reduced sharply compared to the same quarter in 2019 (decreases of 52.3%, 56.0% and 58.5% respectively); unlike overall figures though, the decrease in the number of reoffenders outpaces the decrease in offenders in the cohort, resulting in a reduction in the reoffending rate over the same period. However, despite the continued impact of the pandemic, it is important to note that the number of offenders in the juvenile cohort has gradually fallen over the years and these latest figures show a reduction of 93% since the same quarter in 2009. The rate has fluctuated between 32.6% and 43.6% over the timeseries.
Those that reoffended committed on average 3.42 reoffences each, a 5.7% decrease compared to the same quarter in the previous year. As with the adult cohort, juvenile offenders with 11 or more previous offences had a higher reoffending rate than those with no previous offences, 73.9% and 17.8% respectively.
Figure 3: Proportion of adult and juvenile offenders in England and Wales who commit a proven reoffence, by age, April to June 2020 (Source: Table A3)
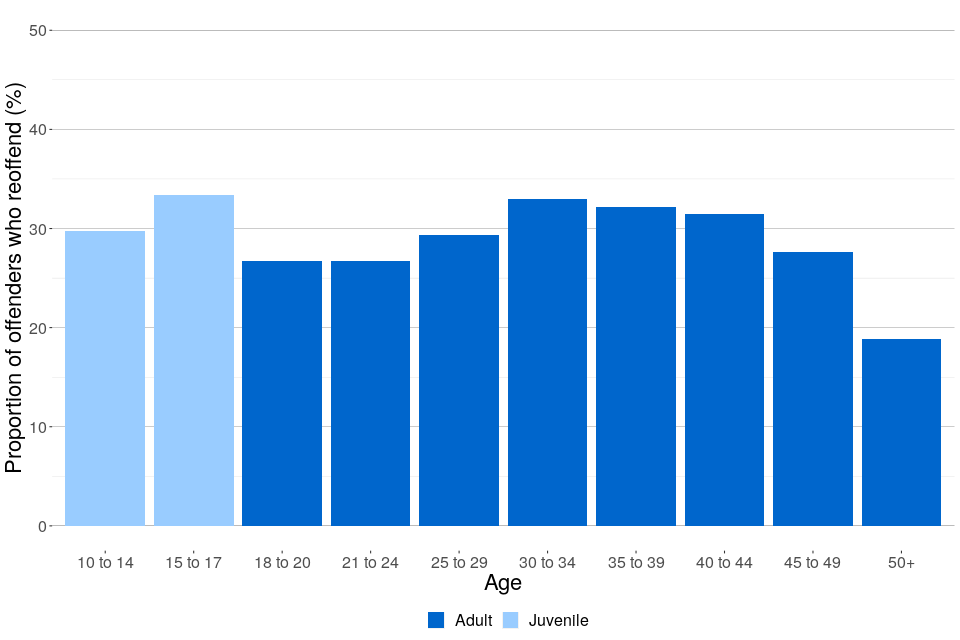
Figure 3: Proportion of adult and juvenile offenders in England and Wales who commit a proven reoffence, by age, April to June 2020 (Source: Table A3)
This quarter, 15 to 17-year-old offenders have the highest reoffending rate, closely followed by the 30 to 34-year-old offenders, with reoffending rates of 33.4% and 33.0% respectively (figure 3). However, it is worth noting that this is the first cohort period since 2009 for which any adult age group has a higher reoffending rate than any juvenile age group.
6. Adult reoffending by disposal[footnote 6]
Adults starting a court order had a proven reoffending rate of 37.0%.
This represents a 7.7 percentage point increase since the same quarter last year, and the largest year-on-year increase in the timeseries.
Adults released from prison had a proven reoffending rate of 38.6%.
This is a decrease of 4.8 percentage points from the same quarter in 2019. Those released from sentences of 12 months or more reoffended at a lower rate at 22.3% (a 3.4 percentage point decrease) compared to those who served a sentence of less than 12 months at a rate of 57.7% (a 2.5 percentage point decrease).
Adults released from custody or starting court orders had a proven reoffending rate of 37.4%, an increase of 3.9 percentage points compared to the same quarter in 2019 and the largest year-on-year increase in the timeseries.
More broadly, the proven reoffending rate for adult offenders across most sentence types increased compared to the same quarter in 2019. Given the offender cohort period now aligns directly with the first lockdown implemented in response to the pandemic (including court closures), there are sharp reductions in the volumes of offenders, reoffenders and reoffences; this, along with the extent of the reduction in the number of offenders exceeding that of reoffenders has caused the reoffending rate to increase.
The proven reoffending rate for adult offenders starting a court order[footnote 7] specifically was 37.0%, a 7.7 percentage point increase compared to the same quarter in 2019 and, again, this is the largest year-on-year increase since 2009. Furthermore, it is worth noting that the volumes of offenders, reoffenders and reoffences has decreased by 68.8%, 60.5% and 59.7% respectively since the same quarter in the previous year. These acute changes are largely driven by the impact of court closures over the offender cohort period.
Figure 4: Proportion of adult offenders released from custody who commit a proven reoffence, by custodial sentence length, April 2009 to June 2020 (Source: Table C2a)
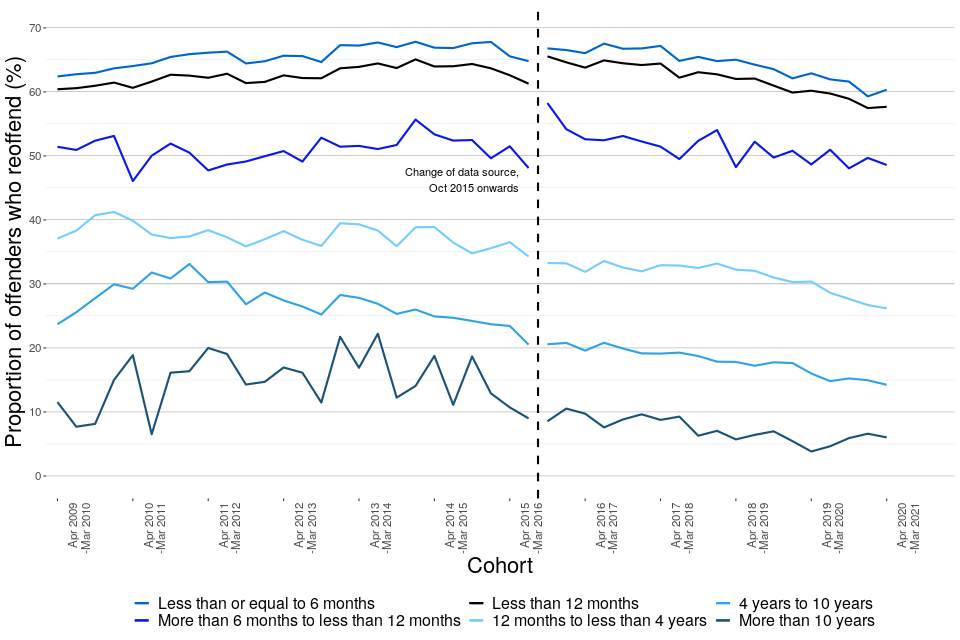
Figure 4: Proportion of adult offenders released from custody who commit a proven reoffence, by custodial sentence length, April 2009 to June 2020 (Source: Table C2a)
In contrast to other disposal types, although the volume of offenders released from custody has also decreased, the extent of the reduction was still greater in the number of reoffenders; this has led to a 4.8 percentage point decrease in the reoffending rate compared to the same quarter the previous year, to stand at 38.6%. Adults who served sentences of 12 months or more reoffended at a substantially lower rate at 22.3% compared to those who served a sentence of less than 12 months at a rate of 57.7%. Those released from sentences of less than or equal to 6 months had a proven reoffending rate of 60.3%, a decrease of 2.6 percentage points since the same quarter in the previous year. Users should exercise caution when comparing the effectiveness of different sentences because the presented rates do not control for known differences in offender characteristics receiving those sentences - for further information please consult recent research on the impact of short custodial sentences, community orders and suspended sentence orders on reoffending as well as the guide to proven reoffending statistics.[footnote 8]
7. Juvenile reoffending by disposal[footnote 9]
Juvenile offenders given youth cautions had a proven reoffending rate of 24.8%.
The reoffending rate for juvenile offenders given youth cautions has increased by 0.6 percentage points since the same quarter last year.
Reprimands and warnings for youths were abolished under the Legal Aid Sentencing and Punishment of Offenders Act 2012 with effect from 8 April 2013 and replaced with youth cautions. Youth cautions are a formal out-of-court disposal that can be used as an alternative to prosecution for juvenile offenders in certain circumstances. A youth caution may be given for any offence where the young offender admits an offence and there is sufficient evidence for a realistic prospect of conviction, but it is not in the public interest to prosecute.
Figure 5: Proportion of juvenile offenders released from custody or given a reprimand, warning or caution who commit a proven reoffence, April 2009 to June 2020 (Source: Table C1b)
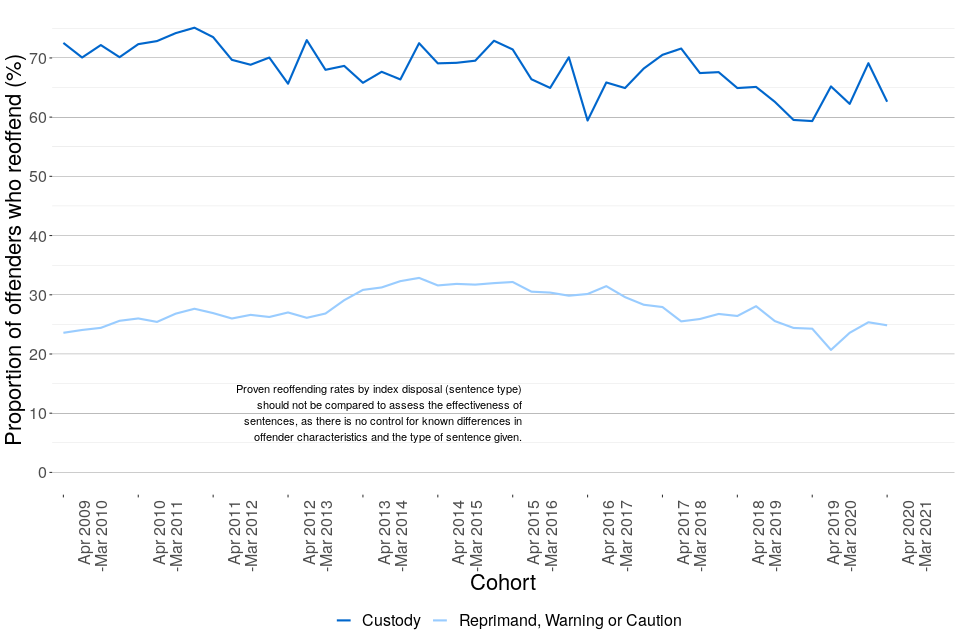
Figure 5: Proportion of juvenile offenders released from custody or given a reprimand, warning or caution who commit a proven reoffence, April 2009 to June 2020 (Source: Table C1b)
Between April to June 2020, 123 juvenile offenders were released from custody and 77 (62.6%) were proven to have committed a reoffence within a year. The rate has increased by 3.3 percentage points since the same quarter in 2019. In addition to the effects of the pandemic for this latest cohort, there is, however, likely to be more variation with the new reoffending measure, from one quarter to another due to the reduced size of the cohort.
8. Index offences[footnote 10]
For the April to June 2020 adult cohort, the index offence category associated with the highest reoffending rate was theft at 50.5%.
The second highest reoffending rate of 42.0% amongst adult offenders was those with an index offence of public order (figure 6).
Figure 6: Proportion of adult and juvenile offenders in England and Wales who commit a proven reoffence, by index offence (except the ‘other’ offence category), April to June 2020 (Source: Table A4a/b)
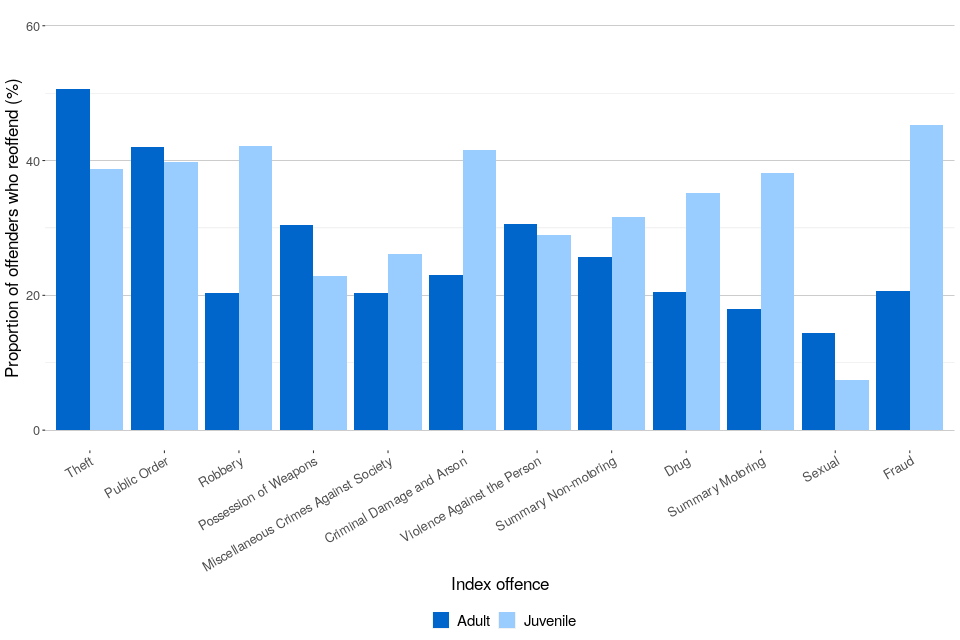
Figure 6: Proportion of adult and juvenile offenders in England and Wales who commit a proven reoffence, by index offence (except the ‘other’ offence category), April to June 2020 (Source: Table A4a/b)
The proportion of reoffences committed depending on index offence has remained broadly stable over time. The lowest rate of reoffending in the adult cohort was observed amongst those with a sexual offence as their index offence, with a rate of 14.4%. Excluding the ‘other’ offence category, the robbery index offence category saw the largest percentage point decrease in reoffending rate since the same financial quarter in 2009, a 18.1 percentage point difference. Those with an index offence of violence against the person saw an increase over this period, a 9.0 percentage point difference.
In the juvenile cohort, those with an index offence of fraud had the highest proven reoffending rate at 45.2%, followed by those with an index offence of robbery at 42.2%. Those with the lowest rate, excluding the ‘other’ offence category, were offenders who had committed a sexual index offence. Their reoffending rate was 7.5%. Those who committed miscellaneous crimes against society index offences saw the largest percentage point decrease in reoffending rate since the same financial quarter in 2009 (a 20.9 percentage point difference) whilst fraud index offences represented the biggest percentage point increase over the same period (a 12.6 percentage point difference).
9. Proven reoffences
For the April to June 2020 adult cohort, 28.1% of proven reoffences committed were theft, making up the highest proportion of reoffences. This represents a decrease of 5.4 percentage points compared to the same period in 2019.
The second highest proportion of proven reoffences committed were summary non-motoring offences (23.6% of reoffences) followed by violence against the person (11.9% of reoffences) (figure 7). Despite the decrease in the number of proven reoffences committed by adult offenders, particularly for the more recent cohort, the share of each reoffence category has remained broadly stable over time.
For the juvenile offender cohort, summary non-motoring offences make up the largest proportion of reoffences (32.9%), followed by drug offences (13.9%) and theft offences (11.7%). In terms of the split by reoffence category, there has been some variation over time with violence against the person taking up an increasingly larger proportion of total juvenile reoffences for more recent cohorts; this currently stands at 9.6% of total proven reoffences.
Figure 7: Proportion of proven reoffences for adult and juveniles committed in the one-year follow-up period, by reoffence type, April to June 2020 (Source: Table B3)
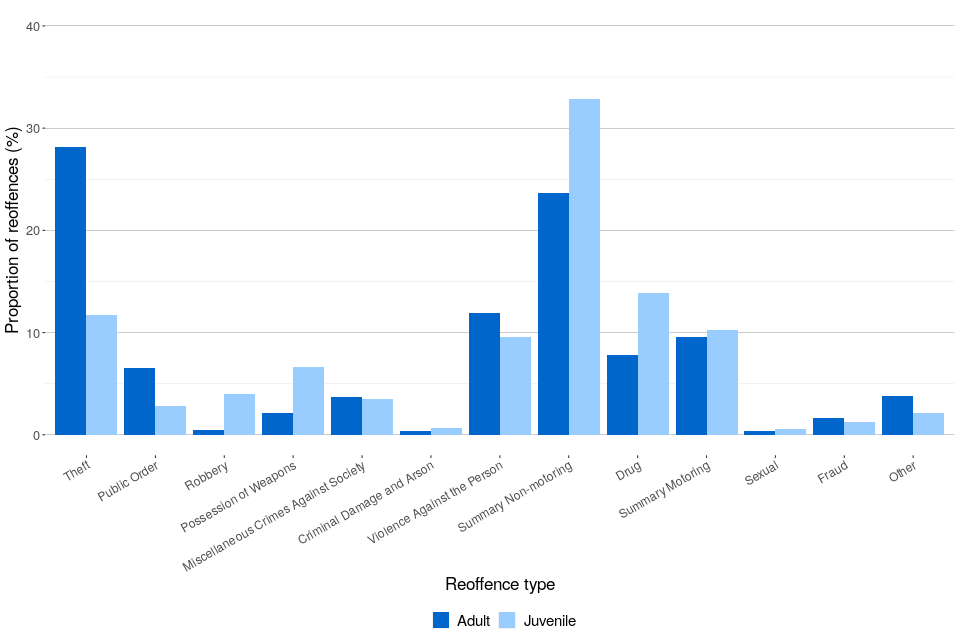
Figure 7: Proportion of proven reoffences for adult and juveniles committed in the one-year follow-up period, by reoffence type, April to June 2020 (Source: Table B3)
Figure 8: Proportion of proven reoffences for adult and juveniles committed in the one-year follow-up period, by month of reoffence, April to June 2020 (Source: Table B2)
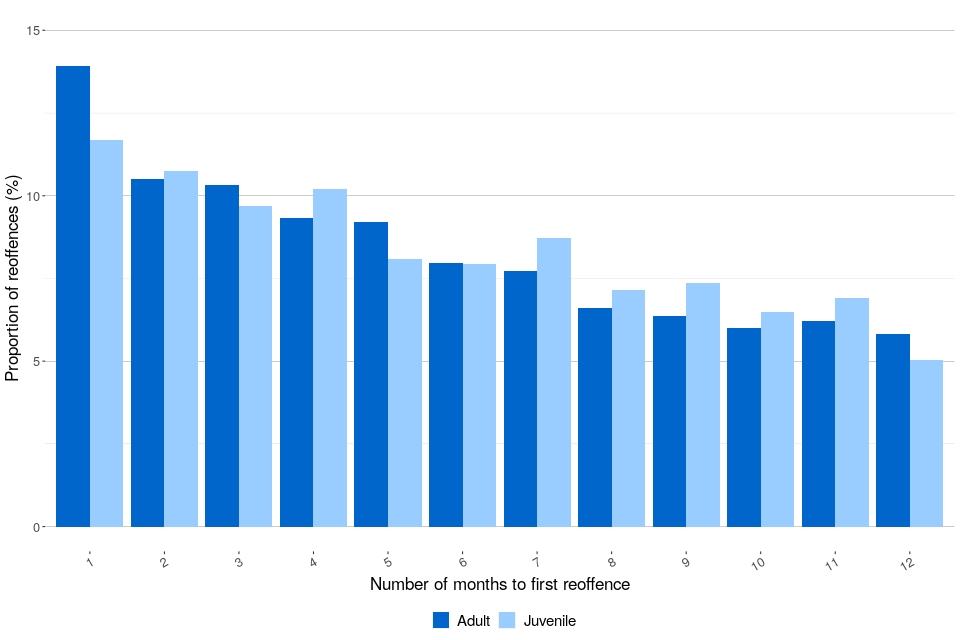
Figure 8: Proportion of proven reoffences for adult and juveniles committed in the one-year follow-up period, by month of reoffence, April to June 2020 (Source: Table B2)
For both adult and juvenile offenders, 34.6% of all reoffences took place within three months after release from custody or after receiving a non-custodial conviction at court, a reprimand or a warning (figure 8). This percentage increases to 61.1% as we approach the sixth month and steadily increasing at an average rate of 6.5% beyond that point per month of reoffence.
10. Further information
10.1 Accompanying files
As well as this bulletin, the following products are published as part of this release:
- A set of overview tables, covering each section of this bulletin.
- One data tools providing proven reoffending data for England and Wales, by region, county as well as local authority (covering July 2009 - June 2020).
- A technical guide to proven reoffending statistics providing information on how proven reoffending is measured and the data sources used.
- A data quality statement which outlines our policies for producing quality statistical outputs and the information provided to maintain our users’ understanding and trust.
10.2 National Statistics status
National Statistics status means that official statistics meet the highest standards of trustworthiness, quality and public value. All official statistics should comply with all aspects of the Code of Practice for Official Statistics. They are awarded National Statistics status following an assessment by the Authority’s regulatory arm. The Authority considers whether the statistics meet the highest standards of Code compliance, including the value they add to public decisions and debate.
It is the Ministry of Justice’s responsibility to maintain compliance with the standards expected for National Statistics. If we become concerned about whether these statistics are still meeting the appropriate standards, we will discuss any concerns with the Authority promptly. National Statistics status can be removed at any point when the highest standards are not maintained, and reinstated when standards are restored.
10.3 Future publications
Our statisticians regularly review the content of publications. Development of new and improved statistical outputs is usually dependent on reallocating existing resources. As part of our continual review and prioritisation, we welcome user feedback on existing outputs including content, breadth, frequency and methodology. Please send any comments you have on this publication including suggestions for further developments or reductions in content.
10.4 Contact
Press enquiries should be directed to the Ministry of Justice press office:
Tel: 020 3334 3536
Email: newsdesk@justice.gsi.gov.uk
Other enquiries and feedback on these statistics should be directed to the Data and Evidence as a Service division of the Ministry of Justice:
Liz Whiting, Head of Reducing Reoffending and Probation Statistics
Ministry of Justice, 7th Floor, 102 Petty France, London, SW1H 9AJ
Email: ESD@justice.gov.uk
Next update: 27 January 2022
URL: www.gov.uk/government/collections/proven-reoffending-statistics
© Crown copyright
Produced by the Ministry of Justice
Alternative formats are available on request from ESD@justice.gov.uk
-
For details on trends in criminal court activity, please refer to: (https://www.gov.uk/government/collections/criminal-court-statistics) ↩
-
The first national lockdown was implemented on 23 March 2020 and transitioned to phased reopening until August 2020 (including a limited number of jury trials resuming from 18 May 2020). The second national lockdown was implemented on 5 November 2020 and returned to a three-tier restriction system from 2 December 2020. The third national lockdown was implemented on 6 January 2021 and transitioned to phased reopening until June 2021. ↩
-
Police recorded crime figures (including monthly trends) can be found at: (https://www.ons.gov.uk/peoplepopulationandcommunity/crimeandjustice) ↩
-
For details on trends in criminal court activity, please refer to: (https://www.gov.uk/government/collections/criminal-court-statistics) ↩
-
Juveniles are defined as those aged 10 to 17 years old ↩
-
For proven reoffending statistics, a disposal is defined as a caution, court order, custody, or other disposal resulting from a conviction at court, such as a fine or discharge. A different methodology is used for proven reoffending statistics by disposal type. The first proven offence within each disposal is treated as the start point for measuring proven reoffending. Therefore, some offenders will appear in more than one disposal category. ↩
-
Community order or suspended sentence order. ↩
-
Proven reoffending rates by disposal should not be compared to assess the effectiveness of sentences, as there is no control for known differences in offender characteristics and the type of sentence given. For further information see Annex D of the October 2016 publication (page 41) and the guide to proven reoffending statistics. ↩
-
The juvenile proven reoffending data by disposal uses the same methodology as that adopted for adult reoffending by disposal (see section 5 for more details). ↩
-
An index offence refers to the offence that leads to an offender being included in the offender cohort. ↩