Prison Population Projections: 2025 to 2030
Published 4 December 2025
Applies to England and Wales

© Crown copyright 2025
This publication is licensed under the terms of the Open Government Licence v3.0 except where otherwise stated. To view this licence, visit nationalarchives.gov.uk/doc/open-government-licence/version/3 or write to the Information Policy Team, The National Archives, Kew, London TW9 4DU, or email: psi@nationalarchives.gov.uk.
Where we have identified any third party copyright information you will need to obtain permission from the copyright holders concerned.
This publication is available at https://www.gov.uk/government/statistics/prison-population-projections-2025-to-2030/prison-population-projections-2025-to-2030--2
This bulletin presents prison population projections for England and Wales from October 2025 to March 2030. It is produced to aid policy development, capacity planning and resource allocation within the Ministry of Justice (MoJ) and His Majesty’s Prison and Probation Service (HMPPS).
Main points
| The prison population is expected to increase due to a combination of factors | The prison population is projected to increase to between 98,000 and 103,600 by March 2030, with a central estimate of 100,600. The projected increase in the prison population is driven by several factors including: continued growth in police charging and prosecutorial activity; increased flows into the courts; and increases in the numbers of offenders recalled to custody. Policies that have not received royal assent such as the Sentencing Bill 2025, are not included in this projection. |
| The projected population in the central scenario is below that of the previously published 2024 to 2029 projection for the whole projection period | In the central scenario, by September 2028, the total prison population is now estimated to be around 2,400 lower than in the previous 2024 to 2029 publication. The difference is predominantly driven by the impact of recent sentencing policy measures outlined in Section 1 below. |
| The populations of adult males and adult females across all age categories are projected to increase | The prison populations of adult males and adult females across all age categories are expected to increase over the projection period with the same drivers of overall growth affecting each of these sub-populations. |
| The projections carry considerable uncertainty | The projections account for the best available evidence, but there is considerable uncertainty around the impact of various key factors. Notably, future crime mix and police charging activity will have a considerable impact on the volume and composition of cases entering the criminal courts. Additionally, any differences in assumptions for other factors such as court activity, sentencing behaviour, and future changes in policy will all result in variation from these projections. |
Introduction
This bulletin presents prison population projections for England and Wales from October 2025 to March 2030. It is produced to aid policy development, capacity planning and resource allocation within the Ministry of Justice (MoJ) and His Majesty’s Prison and Probation Service (HMPPS). The latest published useable operational capacity[footnote 1] of the prison estate (24th November 2025) is 89,334[footnote 2].
The projections are generated by modelling the flow of offenders into and out of prison each month. A key driver for future prison population is the volume and composition of cases entering the criminal courts, i.e. upstream demand.
To illustrate the impact of varying upstream demand assumptions, three plausible scenarios for upstream demand over the next five years have been agreed between the MoJ, the Home Office and the Crown Prosecution Service. This publication presents the prison population projection as a range based on these scenarios. All three scenarios are presented from October 2025 to March 2030.
The projections incorporate the estimated impacts of agreed sentencing policies. These include the Police, Crime, Sentencing and Courts Act[footnote 3], and the Release of Prisoners Order 2020[footnote 4] which include provisions to increase custody time for violent and sexual offenders sentenced to a standard determinate sentence of 4 to 7 years and over 7 years, respectively. Also included is The Criminal Justice Act 2003 (Requisite and Minimum Custodial Periods) Order 2024[footnote 5] which changed the automatic release point for some offenders on a standard determinate sentence from 50% to 40%.
These estimates do not account for future policies that could impact the prison population but are yet to be formally agreed by Parliament. For example, the sentencing reforms as set out in the Sentencing Bill 2025, which are expected to suppress growth in the prison population, are not included, nor are any impacts from government policies in response to the Independent Review into Criminal Courts.
Since there is considerable uncertainty in the assumptions used throughout the projections, the prison population will likely differ from what has been projected – there is a more detailed discussion regarding uncertainty in Section 2.
The latest statistics and commentary on the current and historic prison population are published in the Offender Management Statistics Quarterly publication. This is available online on GOV.UK at: https://www.gov.uk/government/collections/offender-management-statistics-quarterly.
Prison population historic data for September 2025 used in this publication are published at: https://www.gov.uk/government/statistics/offender-management-statistics-quarterly-april-to-june-2025.
1. Total prison population projection and custody type breakdown
The prison population in England and Wales was 87,332[footnote 2] as of 24th November 2025. It is projected to increase steadily to between 98,000 and 103,600 by March 2030, with a central estimate of 100,600.
In the first few years of the projection period, the projected rise in the prison population is heavily influenced by an increase in receptions of determinate sentenced offenders. This increase in receptions reflects observed increases in police and prosecutorial[footnote 6] activity over recent years, leading to projected increases in the number of cases that enter the criminal courts.
There are several sources of uncertainty in projecting the future prison population, particularly around the level of demand entering the Criminal Justice System (CJS). This publication presents three prison population projections to assess the impact of differing possible upstream demand scenarios which have been agreed between the Ministry of Justice (MoJ), the Home Office and the Crown Prosecution Service (CPS).
The cross-CJS view is that charge volumes are likely to continue rising over a three-to-five-year horizon. Although there are factors such as a growth in police officer workload which could supress charge volumes, these are assumed to be outweighed by charge increasing factors such as: increases in officer experience; officer numbers and investigator capacity. It is on this premise that the following scenarios are estimated:
-
Low upstream demand: assumes demand remains at the level observed in the 12 months to Jun-25.
-
Central upstream demand: assumes that demand continues to rise but at a gradually decreasing rate. Demand at March 2030 is c.7% and c.9% higher in Crown and magistrates’ courts respectively than the level observed in the 12 months to Jun-25.
-
High upstream demand: reflects the fact that there are several risks that could drive demand up further than the ‘Central’ estimate. The ‘High’ scenario reflects a situation where current growth rates continue for a further 12 months before starting to level off. Demand at March 2030 is c.13% and c.14% higher in Crown and magistrates’ courts respectively than the level observed in the 12 months to Jun-25.
Figure 1.1 presents the actual prison population between January 2018 and September 2025, with central, low and high population projections from October 2025 to March 2030.
Figure 1.1: Total prison population projection, October 2025 to March 2030[footnote 7] (Source: Table A4)

Table 1.1 presents the prison population projection by custody type, reported at an end of September position.
Table 1.1:[footnote 8] Total prison population by custody type at end September 2025 and projections for September 2026 to September 2029
| Date | Total | Remand | Determinate | Indeterminate | Recall | Non-Criminal | Fine Defaulters |
|---|---|---|---|---|---|---|---|
| Actual | |||||||
| September 2025* | 87,465 | 17,700 | 48,224 | 8,493 | 12,657 | 367 | 24 |
| Central | |||||||
| September 2026 | 91,400 | 18,200 | 50,700 | 8,400 | 13,700 | 400 | 0 |
| September 2027 | 94,700 | 18,700 | 52,900 | 8,400 | 14,400 | 400 | 0 |
| September 2028 | 97,400 | 19,200 | 54,700 | 8,400 | 14,800 | 400 | 0 |
| September 2029 | 99,600 | 19,400 | 56,400 | 8,300 | 15,100 | 400 | 0 |
| Low | |||||||
| September 2026 | 91,100 | 18,000 | 50,600 | 8,400 | 13,600 | 400 | 0 |
| September 2027 | 93,500 | 17,900 | 52,400 | 8,400 | 14,300 | 400 | 0 |
| September 2028 | 95,700 | 18,000 | 54,200 | 8,400 | 14,700 | 400 | 0 |
| September 2029 | 97,400 | 18,000 | 55,700 | 8,300 | 14,900 | 400 | 0 |
| High | |||||||
| September 2026 | 92,200 | 18,400 | 51,200 | 8,400 | 13,700 | 400 | 0 |
| September 2027 | 96,200 | 19,300 | 53,600 | 8,400 | 14,500 | 400 | 0 |
| September 2028 | 99,200 | 20,100 | 55,400 | 8,400 | 14,900 | 400 | 0 |
| September 2029 | 102,100 | 20,900 | 57,200 | 8,300 | 15,300 | 400 | 0 |
The determinate population is projected to grow throughout the projection period in all three scenarios and the increase in this category is the main driver for the projected rise in the total population since the determinate sub-population is the single largest group. The projected growth in the determinate population is driven by an increase in the number of offenders receiving a determinate sentence as increases in police and prosecutorial charging activity and increases in court capacity result in more individuals being sentenced.
The number of people remanded in custody is projected to increase in all scenarios. The remand population was 17,700 at the end of September 2025 and is projected to grow over the projection horizon. This is due to increases in upstream demand from police and prosecutorial activity, leaving courts unable to keep pace with incoming and existing demand. This growth is lower than previously estimated in the 2024 to 2029 prison population projection as remand outturns have remained constant throughout 2025. This is driven in part by the impacts of the Sentencing Act 2020 (Magistrates’ Court Sentencing Powers) (Amendment) Regulations 2024[footnote 9] which allows magistrates’ courts to impose custodial sentences of up to 12 months.
The indeterminate population consists of offenders who serve Imprisonment for Public Protection[footnote 10] (IPP) and life sentences. This population is projected to fall over the projection period driven by the gradual decline of IPP offenders. Offenders can no longer receive an IPP sentence due to its abolition in 2012, with current IPP offenders being released by the Parole Board. Any such released offenders subsequently recalled will be counted in the recall projection.
The recent legislative change to the Criminal Justice Act 2003 (Suitability for Fixed Term Recall) Order 2025[footnote 11] has reduced the recall population by increasing use of Fixed Term Recall for those on sentences of under 4 years. However, after the initial releases, the recall population[footnote 12] is projected to increase from December 2025 for the rest of the projection period in all three scenarios. The increase is primarily due to the expected growth of the determinate population which will result in a larger pool of offenders on licence after serving the custodial part of their sentence, and a proportion of this group will be recalled to custody.
The non-criminal[footnote 13] population includes prisoners held for civil offences and immigration detainees held in prisons. This population is assumed to remain constant over the projection period. The small number of fine defaulters in custody is also assumed to stay at current levels.
Changes in the prison population are expected as the result of a range of policies, including those already in effect but not yet fully represented in the population and others expected to commence over the projection period. The estimated impacts factored into the projections include:
-
The impacts of the Police, Crime, Sentencing and Courts Act 2022[footnote 14], which includes provisions for changing the automatic release point for violent and sexual offenders sentenced to a standard determinate sentence of 4 to 7 years;
-
The impacts of the Release of Prisoners Order 2020[footnote 15], which increases custodial sentences for offenders convicted of a relevant violent or sexual offence with a custodial sentence of 7 years or more;
-
The impacts of The Criminal Justice Act 2003 (Home Detention Curfew) Order 2023[footnote 16] and changes to the Home Detention Curfew (HDC) policy framework which increased the time offenders could spend on HDC to a maximum of 12 months (implemented 3rd June 2025)[footnote 17];
-
The impacts of the Victims and Prisoners Act 2024[footnote 18];
-
The Criminal Justice Act 2003 (Requisite and Minimum Custodial Periods) Order 2024[footnote 19];
-
The Sentencing Act 2020 (Magistrates’ Court Sentencing Powers) (Amendment) Regulations 2024[footnote 20];
-
The Criminal Justice Act 2003 (Suitability for Fixed Term Recall) Order 2025 which increased use of Fixed Term Recall for offenders on sentences of under 4 years[footnote 21].
2. Uncertainty in the projection
Several factors contribute to the uncertainty around the 2025 to 2030 projections. Three main sources of uncertainty are (a) future crime and police charging rates; (b) future court activity; and (c) future policy changes which have the potential to change prison receptions, or the amount of time offenders spend in custody.
Demand into the Criminal Justice System (CJS) is driven by underlying crime trends as well as police and prosecutorial practices, and it remains a key driver of levels of future prison population. The low, central, and high projections presented in Section 1 illustrate the potential impact of differing upstream demand assumptions on the prison population. These projections reflect assumptions agreed with the Home Office (HO) and Crown Prosecution Service (CPS) for plausible low, central, and high future upstream demand scenarios.
The prison population projections are informed by the latest available data and reflect additional assumptions about the future of the CJS such as sentencing outcomes and uncertain policy impacts yet to come into effect. Unanticipated changes to Government policy, as well as offender, police, and sentencing behaviours, will inevitably mean the actual prison population in future years will differ to some degree from the projections.
Uncertainty around future crime types and police charging rates
Future trends in the volume and types of crime being committed and charged are highly uncertain and therefore the volume of upstream demand into courts carries particular uncertainty. Home Office insight suggests two key drivers that are likely to impact charge volumes over the next five years: increased levels of officer experience; and increases in investigator numbers. The demand scenarios have been aligned to analysis from the Home Office-led Demand Insights programme, reflecting the impact of different factors such as officer experience on charge volumes.
Police officer experience remains at a low level due to both the large number of new, inexperienced officers recruited under the Police Uplift Programme and the loss of experienced officers during the 2010s[footnote 22]. It is expected that police officer experience levels will increase over the next 5 years which is likely to result in increased investigative effectiveness and subsequent increases in charge volumes, particularly for victim-based offences[footnote 23]. Similarly, some forces are likely to use the pool of newly recruited officers to expand their investigator capacity. Any increases in investigator numbers are likely to contribute to an increase in charge volumes, particularly in more serious/complex victim-based crimes. There are other factors not explicitly modelled which could impact future demand trends. For example, measures that could lead to improvements in police productivity through case improvement or progression initiatives. The size of these effects is currently unknown.
Uncertainty around future court activity
Prison projections are sensitive to the scale and type of future activity in the criminal courts, which is influenced by a wide range of uncertain and interrelated factors, e.g. future funding and what this means for sitting day levels, independent judicial listing decisions, the behaviour of defendants in entering pleas, availability of prosecutors and defence barristers, the capacity of cross-system partners in ensuring the timely preparation of a case for hearing and the level of open caseloads.
Assumptions on future sentencing outcomes, including conviction and custody rates, which drive future sentencing behaviour and average sentence lengths, also have an impact on the growth of the sentenced population.
Uncertainty due to other policy impacts
The prison demand projections also include the impacts of policy changes that have received royal assent. For some policies already in effect, the impacts have not yet been fully realised in the current prison population i.e. the policy impact on the prison population will increase or decrease from that seen at the beginning of the projection period. Other policies are expected to commence over the projection period, and therefore their impact is not reflected in the prison population at the beginning of the projection period. The policy impacts included in these prison projections are set out in Section 1 and are based on the most up-to-date data available and the best assumptions of future impact at the time of assessment. However, there is inherent uncertainty around these impacts due to being unable to precisely predict the volume and nature of future cases flowing into the CJS.
Additional policies that have not yet received royal assent at the time of modelling are not included in these projections due to uncertainty over both the timelines and precise detail of the policies, which will remain until the parliamentary process has concluded. A key example is the package of sentencing reforms outlined within the Sentencing Bill 2025. Any policy changes that result from this bill, or occur separately, are not reflected in these projections and are likely to cause outturn to deviate from these projections. Future polices and government initiatives made in response to system activity may also cause outturn to deviate from these projections.
Uncertainty and limitations due to modelling methodology
The modelling methodology, described in Sections TG1 and TG2, is another source of uncertainty. The modelling approach used to produce the prison population projections presented in this bulletin represents a complex real-world system and cannot and does not capture every aspect which affects the prison population. As a result, even if assumptions prove accurate and are unchanged for the whole projection period, the projections will not match the actual prison population perfectly.
3. Comparison against 2024 to 2029 population projection
The prison population tracked below the 2024 to 2029 projection during 2025, primarily due to the implementation of new policies targeted at suppressing population growth that were not included in the 2024 to 2029 projection. These include changes to Home Detention Curfew and use of Fixed Term Recall. The new central prison population projection reflects these changes and is c.2,100 below the previous 2024 to 2029 publication at the end of September 2026.
In the previous 2024 to 2029 publication, the total prison population was expected to grow from 86,966 at the end of September 2024 to 89,100 at the end of September 2025. The outturn population at the end of September 2025 was 87,465 which was c.1,600 below the projected level.
The deviation from the previous projection was mainly due to two policies targeted at suppressing population growth that were implemented during 2025 and not included at the time of the 2024 to 2029 publication as they were yet to receive royal assent (expansion of Home Detention Curfew and increased use of Fixed Term Recall).
In June 2025, there was an increase made to the maximum period an offender was allowed to spend on Home Detention Curfew, from 180 days to 365 days. This measure allowed the prison service to move some sentenced offenders out of prison on to Home Detention Curfew up to 185 days earlier.
Starting in early September 2025, changes to Fixed Term Recall were implemented which ensured that recalled individuals serving a custodial sentence of under 4 years would receive a fixed 28-day recall. The recall population then fell from 13,800 at the end of August 2025 to 12,657 by the end of September 2025.
As outlined in Section 1, the 2025 to 2030 publication reflects the most recent data and agreed changes to legislation and therefore projects a lower prison population in the central scenario at all points. At the end of September 2026, the total population is expected to be c.2,100 lower than previously projected in the central scenario. The reasons for this and comparisons to the 2024 to 2029 projections at the sub-population level are discussed in more detail below.
A comparison of the 2024 to 2029 projection against outturn to date and the latest projections is presented in Figure 3.1.
Figure 3.1 Comparison of the 2024 to 2029 total prison population projection against historic data and latest 2025 to 2030 projections[footnote 24] (Source: Tables A4 and A5)

Comparison against 2024 to 2029 sub-population projections
Remand Population
In the previous 2024 to 2029 projection the remand population was projected to grow from 17,662 at the end of September 2024 to 19,300 at the end of September 2025. Instead, the outturn remand population remained relatively constant over the past 12 months, moving from 17,662 at the end of September 2024 to 17,700 at the end of September 2025.
The reason the remand population has not risen as projected is that although the volume of demand entering the system has increased, the proportion of offenders remanded upon receipt into the CJS has fallen.
These two effects are reflected in the new 2025 to 2030 projection, and the combination is a remand population that grows more slowly than previously estimated. The higher upstream demand is offset by the lower assumed proportion of offenders remanded upon receipt into the CJS. This means that at the end of September 2026, the remand population is projected to increase to 18,200. This is c.2,000 lower than estimated in the previous 2024 to 2029 publication.
The projected growth in the remand population is the consequence of a general rise in court open caseloads as demand into the CJS is projected to continue to exceed court capacity. The Crown Court open caseload is expected to grow throughout the projection period rising from 78,329 at the end of September 2025[footnote 25] to 88,700 at the end of September 2026 and 108,700 at the end of September 2028 (see supplementary table A6).
Determinate Sentenced Population
In the previous 2024 to 2029 projection the determinate population was projected to grow from 47,818 at the end of September 2024 to 48,100 at the end of September 2025. The outturn growth in the Determinate population over this period was very close to this, growing to 48,224 at the end of September 2025.
As discussed in Section 1, upstream demand was higher than expected leading to more receptions into the sentenced population. This was offset by an increase in discharges due to the expansion of Home Detention Curfew and by lower than expected growth in the SDS+ population which is a group with long sentence lengths.
In our new 2025 to 2030 projection the determinate population is expected to continue to grow as trends of higher demand into the courts and increasing court capacity continue. This means that at the end of September 2026, the determinate population is projected to increase to 50,700. This is c.800 lower than estimated in the previous 2024 to 2029 publication which reflects the impact of Home Detention Curfew expansion and lower SDS+ population growth.
Recall Population
In the previous 2024 to 2029 projection the recall population was projected to grow from 12,579 at the end of September 2024 to 12,900 at the end of September 2025. The outturn recall population at the end of September 2025 was 12,657.
The recall population was lower than projected as a result of the Criminal Justice Act 2003 (Suitability for Fixed Term Recall) Order 2025[footnote 26] that came into effect on the 8th July. This reduced the recall population as prisoners with qualifying sentences of under 4 years are now automatically released after 28 days of recall.
The new 2025 to 2030 projection reflects this legislative change however it also reflects assumptions of higher upstream demand and court capacity. This will result in more discharges from the sentenced population, a greater licence pool and therefore a higher recall population. This means that at the end of September 2026, the recall population is projected to increase to 13,700. This is c.500 higher than estimated in the previous 2024 to 2029 publication.
Indeterminate Population
In the previous 2024 to 2029 projection the indeterminate population was projected to fall from 8,501 at the end of September 2024 to 8,300 at the end of September 2025. The outturn for the indeterminate population at the end of September 2025 was 8,493.
This is a smaller decrease than projected which is primarily driven by a larger increase in the life sentence population, which has offset the decrease in IPP population.
In this update, the indeterminate population is projected to continue declining slowly over the projection period, driven by the ongoing reduction in the IPP population following its removal in 2012 (see Section 1). This means that at the end of September 2026, the indeterminate population is projected to fall to 8,400. This is c.300 higher than estimated in the previous 2024 to 2029 publication as the trend of a growing life sentence population is expected to continue.
Table 3.1:[footnote 8] Comparisons between the prison population projections for 2024 to 2029 and 2025 to 2030 (central scenario), by type of custody[footnote 27]
| Date | 2024-2029 | 2025-2030 | Difference (%) |
|---|---|---|---|
| Total | |||
| September 2025 | 89,100 | 87,465* | -2 |
| September 2026 | 93,500 | 91,400 | -2 |
| September 2027 | 97,300 | 94,700 | -3 |
| September 2028 | 99,800 | 97,400 | -2 |
| Remand | |||
| September 2025 | 19,300 | 17,700* | -8 |
| September 2026 | 20,200 | 18,200 | -10 |
| September 2027 | 20,800 | 18,700 | -10 |
| September 2028 | 21,300 | 19,200 | -10 |
| Determinate | |||
| September 2025 | 48,100 | 48,224* | 0 |
| September 2026 | 51,500 | 50,700 | -2 |
| September 2027 | 54,500 | 52,900 | -3 |
| September 2028 | 56,100 | 54,700 | -3 |
| Indeterminate | |||
| September 2025 | 8,300 | 8,493* | 2 |
| September 2026 | 8,200 | 8,400 | 4 |
| September 2027 | 8,000 | 8,400 | 5 |
| September 2028 | 8,000 | 8,400 | 5 |
| Recall | |||
| September 2025 | 12,900 | 12,657* | -2 |
| September 2026 | 13,200 | 13,700 | 4 |
| September 2027 | 13,500 | 14,400 | 6 |
| September 2028 | 13,900 | 14,800 | 6 |
| Non-Criminal | |||
| September 2025 | 400 | 367* | -16 |
| September 2026 | 400 | 400 | -6 |
| September 2027 | 400 | 400 | -6 |
| September 2028 | 400 | 400 | -6 |
| Fine Defaulters | |||
| September 2025 | 0 | 24* | 4 |
| September 2026 | 0 | 0 | -9 |
| September 2027 | 0 | 0 | -9 |
| September 2028 | 0 | 0 | -9 |
4. Projection of over 50, over 60 and over 70 years old populations
As the overall prison population is projected to increase throughout the projection period, so too are the populations of over 50, over 60 and over 70-year-olds. These sub-populations are estimated to remain relatively constant as proportions of the total prison population.
Table 4.1 shows projections of the prison population aged 50 to 59, 60 to 69 and over 70 years old. The prison population is projected to increase over the projection period for all of these age groups, in line with the overall prison population.
Table 4.1:[footnote 8] Prison population aged over 50, 60 and 70 years old, September 2025 historic data and projected September 2026 to September 2029
| Date | Total (all ages) | 50 and over | 50 to 59 | 60 to 69 | 70 and over |
|---|---|---|---|---|---|
| Actual | |||||
| September 2025* | 87,465 | 16,163 | 9,495 | 4,559 | 2,109 |
| Central | |||||
| September 2026 | 91,400 | 16,600 | 9,800 | 4,600 | 2,200 |
| September 2027 | 94,700 | 17,200 | 10,000 | 4,900 | 2,300 |
| September 2028 | 97,400 | 18,000 | 10,400 | 5,100 | 2,500 |
| September 2029 | 99,600 | 18,600 | 10,700 | 5,200 | 2,600 |
| Low | |||||
| September 2026 | 91,100 | 16,500 | 9,700 | 4,600 | 2,200 |
| September 2027 | 93,500 | 17,000 | 9,900 | 4,800 | 2,300 |
| September 2028 | 95,700 | 17,600 | 10,200 | 5,000 | 2,400 |
| September 2029 | 97,400 | 18,300 | 10,500 | 5,100 | 2,600 |
| High | |||||
| September 2026 | 92,200 | 16,600 | 9,800 | 4,700 | 2,200 |
| September 2027 | 96,200 | 17,400 | 10,200 | 4,900 | 2,300 |
| September 2028 | 99,200 | 18,200 | 10,600 | 5,200 | 2,500 |
| September 2029 | 102,100 | 18,800 | 10,900 | 5,200 | 2,700 |
Over the course of 2025 the proportion of the prison population aged 50 and older has remained relatively flat at c.18%. The 50-year-old and over population is projected to increase from 16,163 at the end of September 2025 to 18,600 in September 2029 in the central scenario.
This projected increase in the 50-year-old and over prison population is driven by the same underlying drivers as those in the overall population, including growth in police charging and prosecutorial activity and receipts into court.
5. Projection of age and sex cohorts
The overall prison population is projected to increase over the projection period, with the populations of both female adults, and male adults increasing and the populations of juveniles projected to remain stable.
Table 5.1 shows projections of the prison population by those aged under 18 and adults by sex. Adult male and adult female sub-populations increase over the projection period due to the same factors driving the increase in the total population. The juvenile population has remained relatively stable in recent years and is projected to remain at this level throughout the projection.
Table 5.1:[footnote 8] Prison population by age group and sex, September 2025 historic data and projected September 2026 to September 2029
| Date | Total | Juvenile | Female 18+ | Male 18+ |
|---|---|---|---|---|
| Actual | ||||
| September 2025* | 87,465 | 253 | 3,527 | 83,685 |
| Central | ||||
| September 2026 | 91,400 | 300 | 3,600 | 87,500 |
| September 2027 | 94,700 | 300 | 3,700 | 90,700 |
| September 2028 | 97,400 | 300 | 3,900 | 93,200 |
| September 2029 | 99,600 | 300 | 3,900 | 95,400 |
| Low | ||||
| September 2026 | 91,100 | 300 | 3,600 | 87,200 |
| September 2027 | 93,500 | 300 | 3,700 | 89,500 |
| September 2028 | 95,700 | 300 | 3,800 | 91,600 |
| September 2029 | 97,400 | 300 | 3,800 | 93,200 |
| High | ||||
| September 2026 | 92,200 | 300 | 3,600 | 88,200 |
| September 2027 | 96,200 | 300 | 3,800 | 92,000 |
| September 2028 | 99,200 | 300 | 4,000 | 94,900 |
| September 2029 | 102,100 | 300 | 4,000 | 97,700 |
The adult male (18 and over) population is projected to increase from 83,685 at the end of September 2025 to 95,400 by September 2029. Supporting Table A2 provides a further breakdown of the young adult population (aged 18 to 20 inclusive, both male and female), which is also projected to increase from the current population of 2,979 (September 2025) to 3,400 by September 2029.
The juvenile population includes those in the 15 to 17 age group and covers only offenders held in HMPPS estates. Note that figures do not cover those young offenders held in Secure Children’s Homes or Secure Training Centres. The juvenile population decreased in 2020 and has remained roughly constant at c.300 since the end of 2020. The number of 15- to 17-year-olds in HMPPS custody is projected to remain at this level throughout the projection, with a projected population of c.300 at September 2029.
The adult female population has remained flat since September 2024 and is 3,527 at the end of September 2025 (3,524 at end of September 2024). This population slightly increased over 2025 before decreasing in September 2025 as a result of the recent change to the Criminal Justice Act 2003 (Suitability for Fixed Term Recall) Order, as discussed above, and is projected to increase to 3,900 in the central scenario by September 2029.
6. Links to related Ministry of Justice statistics
For further information on:
-
The latest statistics on court receipts visit: www.gov.uk/government/collections/criminal-court-statistics
-
The latest statistics on the Criminal Justice System, including information on sentencing, visit: www.gov.uk/government/collections/criminal-justice-statistics-quarterly
-
The latest statistics and commentary on the prison population visit: www.gov.uk/government/collections/offender-management-statistics-quarterly
-
The Story of the Prison Population 1993-2020 visit:www.gov.uk/government/statistics/story-of-the-prison-population-1993-to-2020
-
Weekly prison population and capacity figures visit: www.gov.uk/government/collections/prison-population-statistics
Technical Guidance 1 (TG1). Modelling methodology
The prison projections modelling is part of a wider suite of models within the Ministry of Justice used to model the criminal courts and offender management, driven by projections of demand for the MOJ’s services. Starting from projected volumes of completed court cases (produced by separate models discussed in Sections 1 and 2 of TG2), two main components of the modelling suite are used to develop prison population projections: a custodial sentencing model and a prison population projection model.
The custodial sentencing model (discussed in Section 3 of TG2) is driven by projections of the number of defendants convicted or sentenced in the criminal courts. To project volumes of people received into prison, it also considers:
-
the case type and court route defendants have come through
-
the sentences received by concluded cases
-
the proportion of these sentences which lead to a prison reception
The prison population projection model (discussed in Section 4 of TG2) takes projections of prison receptions from the custodial sentencing model and then estimates the time offenders spend in prison to calculate the resulting prison population for each month of the projection period.
These projections are subject to uncertainty, both in terms of the assumptions that inform them, and the statistical uncertainties with the modelling.
The prison population projection model is based on the latest available data from various sources including court proceedings, performance data and sentencing data. The latest P-NOMIS extracts, discussed in offender management statistics[footnote 28], are utilised to model both prison receptions and population data.
The method used to project the prison population in England and Wales for the 2025 to 2030 projections is similar to the approach used to generate the previous 2024 to 2029 projections published on 5th December 2024. Section TG2 provides further details of the methods used to produce the prison population projections and the assumptions behind them.
Technical Guidance 2 (TG2). Detail of models and assumptions
Overview of the modelling approach
The methods used to generate this set of prison population projections are similar to the approach taken for the previous projections (2024 to 2029 projections published on 5th December 2024).
Since there is uncertainty around future levels of demand entering the CJS, this publication presents the prison population projections based on three plausible upstream demand scenarios which have been agreed between the MoJ, the Home Office and the CPS.
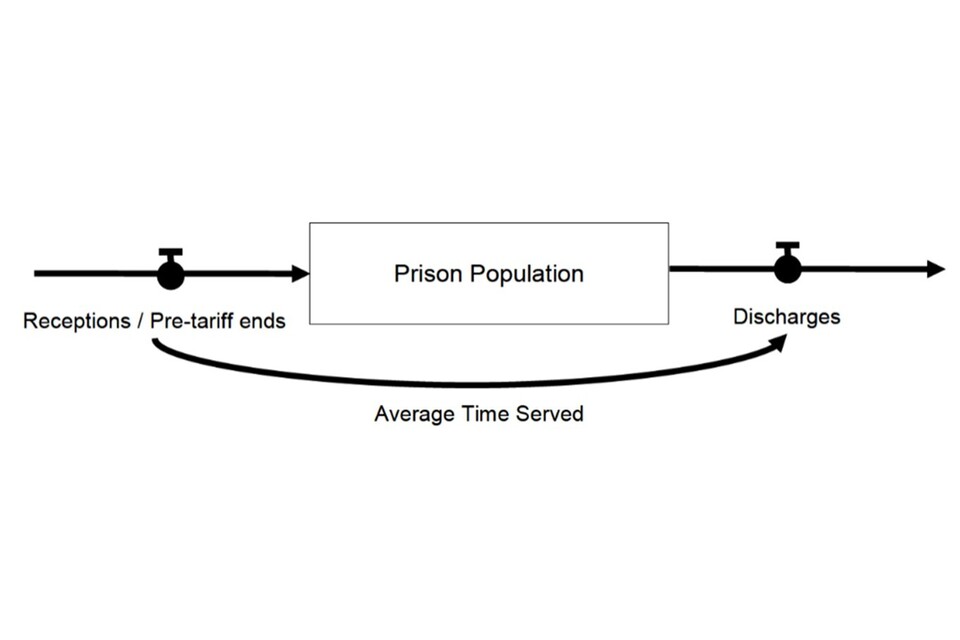
Prison population projections are initially produced for separate sub-populations and then combined. In most cases, these population groups are projected by combining reception (inflow) projections over time, discharge (outflow) projections over time, and the starting-point population at the beginning of the projection period (this type of modelling is known as stock-flow modelling). The reception projections are produced by modelling the flow of cases through the courts and applying calculated ratios of court disposals (closed cases) to generate projected prison receptions. The discharge projections are derived by applying time periods served in prison to both the existing prison population and new receptions. The time periods served are estimated through historical sampling. The overall structure is shown in Figure TG2.1
Prison sub-populations that are not modelled in a stock-flow manner are, fine defaulters and non-criminal populations. Changes to the prison population resulting from government policies that are being or are expected to be implemented, which can apply to any sub-population, are also not modelled in this way.
Figure TG2.1: Key components of the prison projections modelling system

1) Producing projections of defendants entering court
Projections of defendants proceeded against at court are chosen as the entry point to the modelling system because this is the entry point of defendants into the MOJ’s area of responsibility.
In projecting future demand, three plausible scenarios for future demand from police and prosecutorial activity have been agreed between the MoJ, the Home Office and the CPS, and modelled for these projections. The scenarios have different assumptions for the levels and composition of cases entering the criminal courts, as detailed in Section 1.
Our estimate of the workload required for courts to meet incoming demand is based on assigning key attributes to each case entering the system (for example, whether a guilty plea is entered and at what stage). These attributes are then combined with the relevant average hearing times to calculate the total sitting days needed to accommodate this annual demand. The resulting workload estimates are published in Table A7 of the accompanying statistical tables.
2) Converting projections of defendants entering court into volumes of completed court cases and an open caseload projection
The court models take the projections of defendants entering court (court receipts) and assign various attributes (such as plea behaviour) to cases based on historical data. These attributes are used to estimate likely hearing times and to predict the progression of the case through the courts.
This gives a projection of demand coming into the courts based on the characteristics of the cases and the pathway through the court system. This projection is then combined with the estimated demand within the current open caseload to estimate total possible court workload. The model then takes assumptions for available court capacity, listing processes and prioritisation to estimate which of these cases will be disposed of in each period.
The open caseload projection is then a function of these receipt and disposal projections based on a stock-flow model. The predicted receipts are added to the current open caseload and predicted disposals are taken off. The open caseload in period t+1 is equal to the open caseload in period t plus the receipts in period t+1 minus the disposals in period t+1. The Crown open caseload projection is published in table A6 of the accompanying Statistical Tables.
There is inherent uncertainty in this projection, and the actual future open caseload is likely to deviate from the estimate. As outlined in Section 1, these projections do not include the impact of policies which are yet to receive parliamentary approval and therefore the open caseload projections for courts do not include any impacts from the Independent Review of Criminal Courts. Other key uncertainties include the expected future demand into courts (receipts), the route that cases will take through the system and future court capacity and listing practices. These projections are a key input for the prison population modelling described in points 3 and 4 below.
3) Converting completed court cases into volumes of prison inflows
The sentencing module takes projections of court disposals (Section 2 of TG2) and derives projected volumes of custodial sentences. The conversion of court disposals into custodial sentences is based on historical court sentence outcomes.
The projected custodial sentences are then converted into prison receptions using conversion ratios derived from historical proportions. This is not a 1:1 ratio as the projected custodial sentences include offenders who may already be serving a sentence for a previous crime or those who serve their whole custodial sentence on remand, meaning that they would not be a new reception to prison.
4a) Producing prison population projections
Prison population projections are produced using separate models for individual sub-populations, combined with the impacts of new policies. The main sub-populations in prison are modelled using a stock-flow model based on the generic structure shown in Figure TG2.2, except for the fines and non-criminal populations. The stock-flow model begins with the starting-point prison population, predicts the monthly flow of offenders into and out of prison, and calculates the resulting prison population at the end of each month.
Figure TG2.2: Generic stock-flow structure in the prison population stock-flow models
For the remand population, inflows are estimated using the latest data on the proportion of receipts into the CJS that are remanded into custody. This proportion is applied to the agreed assumptions on future upstream demand to calculate estimated remand receipts. Outflows from the remand population come from estimates of which types of cases the courts will dispose of. These estimated disposals are derived from assumptions around court capacity and prioritisation and are assumed to follow the trend of the previous 12 months.
For the determinate population, the monthly prison receptions (inflows into prison) are estimated in the sentencing module, as described in Section 3 of TG2. Monthly determinate prison discharges (outflows from prison) are estimated using historical distributions of time spent in custody, accounting for the impacts of The Criminal Justice Act 2003 (Requisite and Minimum Custodial Periods) Order 2024 which changed the automatic release point for some offenders on a standard determinate sentence from 50% to 40%, as discussed in Section 1.
For the IPP and life sentence (indeterminate) population, outflows depend on the tariff lengths received, the minimum term an offender must spend in prison before becoming eligible to apply for parole, and on the frequency and outcome of Parole Board hearings. The values of these parameters are set and calibrated to reflect the most recent management information on Parole Board outcomes.
For the recall population, indeterminate recalls are treated explicitly based on data and assumptions around future release and recall rates, and conditional on Parole Board capacity as per the indeterminate population. The determinate recall population is predicted on four main steps. First, the size of the eligible pool of offenders subject to licence conditions, split by sentence length band, is estimated from the predicted discharge of determinate prisoners (see above on the determinate population). Second, a monthly ‘rate of recall’ is applied to this pool to estimate the number of new people entering recall. Third, a profile of average time spent recalled into custody is applied to estimate re-releases. Fourth, the total determinate sentenced recall population is calculated based on the existing recall population, the number of new receptions, and the number of re-releases.
The relatively small non-criminal population and the fine defaulter population are assumed to remain constant throughout the projection period, with the populations determined by the most recent data available prior to projections.
4b) Accounting for the impacts of policies
The impact of policies that are being implemented, or are expected to be implemented, are mostly projected separately as population changes, rather than using a stock-flow method (detailed in Section 4a of TG2 above). These are then added to the core projections to give the full projections presented here. In each case, policy impacts are projected according to the unique aspects of the policy in question (included policies are listed in Section 1).
Exceptions to this rule include The Criminal Justice Act 2003 (Requisite and Minimum Custodial Periods) Order 2024 which is included within the modelling of the determinate prison population.
4c) Splitting out projections by age and sex
The determinate population modelling methodology allows age-bands and sex to be modelled explicitly. Newly received offenders (see Section 3 of TG2) are assigned both an age and sex based on distributions of offenders entering prison during scenario-specific time periods, aligning with the time periods used to define sentence length assumptions (see Section 1). Existing and newly received offenders are then aged whilst they are in prison to determine movements into/out of age-bands at any point (e.g. offenders moving from the 21 to 49 years old age-band to the 50 to 59 years old age-band as they age during their time in custody).
For all other prison sub-populations, the population in prison at the end of each modelled month is sub-divided by age-band and sex using historical splits of the prison population by sub-population, described as follows.
In the case of the non-criminal, fine, remand, recall and life populations, and in the case of additional populations that result from policy impacts, age and sex splits are assumed to remain at the average observed in the previous six months of historical data available prior to the start of the projection.
For the IPP population, the sex distribution is assumed to remain constant at the level observed in the most recent historical data available, prior to the start of the projections. However, because there are no incoming offenders, due to the sentence’s abolition in 2012, the aging of existing offenders is sufficient to calculate the population in any given age-band.
Further Information
Accredited Official Statistics Status
Accredited Official Statistics are accredited official statistics that meet the highest standards of trustworthiness, quality, and public value.
These official statistics were independently reviewed by the Office for Statistics Regulation (OSR) in December 2009. They comply with the standards of trustworthiness, quality and value in the Code of Practice for Statistics and should be labelled ‘accredited official statistics’, called National Statistics in the Statistics and Registration Service Act 2007. You are welcome to contact us directly with any comments about how we meet these standards. Alternatively, you can contact the OSR by emailing regulation@statistics.gov.uk or via the OSR website.
It is the Ministry of Justice’s responsibility to maintain compliance with the standards expected for Accredited Official Statistics. If we become concerned about whether these statistics are still meeting the appropriate standards, we will discuss any concerns with the OSR promptly. Accredited Official Statistics status can be removed at any point when the highest standards are not maintained and reinstated when standards are restored.
Enquiries
Press enquiries should be directed to the Ministry of Justice Press Office:
Telephone: 0300 790 0711
Email: newsdesk@justice.gov.uk
For all enquiries relating to these statistics, please contact the Analytical Services Division, Ministry of Justice:
Jamie Symon, Head of Prison and Courts Projections
Rohin Sharma, Prison and Courts Projections Analyst
Address: Ministry of Justice, Post Point 4, 10 South Colonnade, London, E14 4PU
Email: PrisonProjection.Statistics@justice.gov.uk
Next update: December 2026 (provisional)
URL: www.gov.uk/government/statistics/prison-population-projections-ns
© Crown copyright 2025
This publication is licensed under the terms of the Open Government Licence v3.0 except where otherwise stated. To view this licence, visit www.nationalarchives.gov.uk/doc/open-government-licence/version/3 or write to the Information Policy Team, The National Archives, Kew, London TW9 4DU, or email: psi@nationalarchives.gov.uk.
Alternative formats are available on request from PrisonProjection.Statistics@justice.gov.uk
-
The operational capacity of a prison is the total number of prisoners that an establishment can hold, considering control, security and the proper operation of the planned regime. It is determined by Prison Group Directors based on operational judgement and experience. ↩
-
https://www.gov.uk/government/collections/prison-population-statistics ↩ ↩2
-
https://www.legislation.gov.uk/ukpga/2022/32/contents/enacted ↩
-
https://www.legislation.gov.uk/uksi/2024/844/contents/made ↩
-
https://www.gov.uk/government/statistics/criminal-justice-system-statistics-quarterly-june-2025 ↩
-
The chart shows the central projection for prison population and the range estimated from reasonable low and high upstream demand scenarios. This shaded area therefore estimates the impact of plausible future trends in crime types and levels of police and prosecutorial activity, however this does not reflect the full range of demand risk. The uncertainty around these projections is large and increases over time. See Section 2 for more information about the sources of uncertainty. ↩
-
Numbers greater than 100 are rounded to the nearest 100; numbers smaller than 100 are rounded to the nearest 50. Components may not sum due to rounding. * Populations are actual prison population values taken from 30th September 2025. ↩ ↩2 ↩3 ↩4
-
Sentences of Imprisonment for Public Protection (IPPs) were created by the Criminal Justice Act 2003 and started to be used in April 2005. Offenders sentenced to an IPP are set a minimum term (tariff) which they must spend in prison. After they have completed their tariff, they can apply to the Parole Board for release. The Parole Board will release an offender only if it is satisfied that it is no longer necessary for the protection of the public for the offender to be confined. ↩
-
https://www.legislation.gov.uk/uksi/2025/833/contents/made ↩
-
Offenders are released from custody under licenced supervision, subject to a set of conditions such as living at an approved address. If the offender breaches the conditions of their licence they may be recalled into prison. ↩
-
Non-criminal prisoners are held for civil offences or under the Immigration Act. A civil non-criminal prisoner is someone held in prison because of a non-criminal matter, for example, non-payment of council tax or contempt of court. The non-criminal population also includes immigration detainees that have finished serving their sentence and are being kept in prison by immigration authorities. ↩
-
https://www.legislation.gov.uk/ukpga/2022/32/contents/enacted ↩
-
https://www.legislation.gov.uk/uksi/2023/390/article/2/made ↩
-
https://assets.publishing.service.gov.uk/media/683eb2baa9b2749a8095e09f/home-curfew-pf.pdf ↩
-
https://www.legislation.gov.uk/uksi/2024/844/contents/made ↩
-
https://www.legislation.gov.uk/uksi/2025/833/contents/made ↩
-
https://www.gov.uk/government/statistics/police-officer-uplift-final-position-as-at-march-2023 ↩
-
Identifying factors associated with changes in charge volumes: a statistical analysis - GOV.UK ↩
-
The chart shows the central projection, however the uncertainty around this projection is large. See Section 2 for more information about the sources of uncertainty. ↩
-
https://www.gov.uk/government/statistics/criminal-court-statistics-quarterly-april-to-june-2025 ↩
-
https://www.legislation.gov.uk/uksi/2025/833/contents/made ↩
-
Non-criminal prisoners are held for civil offences or under the Immigration Act. A civil non-criminal prisoner is someone held in prison because of a non-criminal matter, for example, non-payment of council tax or contempt of court. The non-criminal population also includes immigration detainees that have finished serving their sentence and are being kept in prison by immigration authorities. ↩
-
https://www.gov.uk/government/collections/offender-management-statistics-quarterly ↩