Planning Inspectorate staff diversity official statistics 14 September 2023
Published 14 September 2023
Applies to England

© Crown copyright 2023
This publication is licensed under the terms of the Open Government Licence v3.0 except where otherwise stated. To view this licence, visit nationalarchives.gov.uk/doc/open-government-licence/version/3 or write to the Information Policy Team, The National Archives, Kew, London TW9 4DU, or email: psi@nationalarchives.gov.uk.
Where we have identified any third party copyright information you will need to obtain permission from the copyright holders concerned.
This publication is available at https://www.gov.uk/government/statistics/planning-inspectorate-staff-diversity-statistics-14-september-2023/planning-inspectorate-staff-diversity-official-statistics-14-september-2023
1. Introduction
This statistical release provides summary information on the staff who work at the Planning Inspectorate (PINS). It describes the diversity characteristics of those staff and compares their pay.
This increases our transparency and accountability to our customers, stakeholders and the wider public, providing reliable information of our staff diversity. It will help those considering joining the organisation decide “is this the sort of organisation I want to work for?”. Over time, routine publication will enable anyone to see what progress has been made in increasing the diversity of the organisation. This publication also supports our obligations under the Public Sector Equality Duty to provide information on its workforce identified by the Equality Act 2010.
These statistics have been published to ensure everyone has equal access to the information and to support the Planning Inspectorate’s commitment to release information where possible.
This statistical bulletin provides:
- Number of staff as of 31st March 2023; split between Inspector Profession and other professions
- Information and declaration rates
- Staff Diversity by protected characteristics
- Comparison with Civil Service characteristics where possible
- How the above have changed over recent years
- How the protected characteristics relate to each other (whether they are independent)
The information provided describes the status as of 31st March 2023. This provides a consistent picture with other published information and allows comparison with other government bodies, particularly through the Annual Civil Service Employment Survey, which uses this date as its benchmark and is also the basis of gender pay information published by the Cabinet Office.
The publication of these statistics also supports the implementation of the Planning Inspectorate’s Equality, Diversity, and Inclusion Strategy. The Inspectorate is committed to ensuring that everything it does is fair, inclusive and promotes diversity in background and thought. The vision of the ED&I Strategy is for the Planning Inspectorate to better reflect the diverse make up of its customers and those that are impacted by the work we do all over England, ensuring that everyone feels valued and included in the workplace.
This Release also includes commentary from the Inspectorate on work being carried out to increase diversity, including the Equality, Diversity, and Inclusion strategy.
The information in this bulletin, describing the statistics as of 31st March, may not reflect the current status of the organisation.
1.1 The Planning Inspectorate
The Planning Inspectorate makes decisions and provides recommendations and advice on a range of land use planning-related issues across England. This is done in a fair, open, and timely way.
The Planning Inspectorate deals with planning appeals, national infrastructure planning applications, examinations of local plans and other planning-related and specialist casework in England. The Planning Inspectorate is an executive agency, sponsored by the Department for Levelling Up, Housing and Communities.
1.2 Summary
The number of staff at the end of March 2023 was 887. This is a measure of headcount. Some of the staff worked part-time; and the full-time equivalent (FTE) count was 807.8.
There were 463 staff working in the Inspector Profession (most but not all of these are Planning Inspectors) – with a full-time equivalent of 414.1. This is slightly more than half of the Inspectorate’s people – fewer work in other professions (424 headcount: 393.7 FTE), such as strategy, digital and data, human resources and finance.
Both headcount and FTE measures grew from 2018 to 2021. There was a fall in staff numbers in 2022 which is largely due to the staff and functions of Planning Inspectorate Wales transferring to Welsh Government. Over the year to March 2023, both headcount and FTE increased again, more so for the Inspector Profession than the Other Professions group.
More than half of staff are aged between 40 and 59, with 26% under 40. The median age of staff in the Planning Inspectorate is 47 years old.
Of those with recorded information, 8% of staff have a disability. This is slightly lower than previous years. 6% of staff identify as being from an ethnic minority background (not including white minorities). This is considerably below the civil service average of 15%. The proportion of ethnic minority staff has increased year on year since 2018, until the most recent year when it remained constant at 6.1%.
The percentage of female staff in the Inspectorate is 47%, which has remained stable over recent years and is lower than the civil service, where 55% are female.
Most of the Planning Inspectorate’s people are either of no religion (44%) or Christian (41%). 2% of staff are of any other religions, with 1% of staff being Muslim, and other religions having lower proportions.
Overall, 5% of staff identified as being lesbian, gay, bisexual or ‘other’. The civil service average is 6%. The number of LGBO staff has increased from 2018 to 2023 but the proportion has remained steady.
There were 274 people who worked part time in the planning inspectorate – that’s almost a third. The proportion working part time from 2018 to 2023 has remained steady.
In general, the profile of people who work in the Inspector Profession is different from that of those in other professions. For example, comparing the Inspector Profession with other professions:
| Inspector Profession | Other Professions |
|---|---|
| Older (81% over 40; median age 50) | Younger (64% over 40; median age 44) |
| 4% disabled | 12% disabled |
| 3% minority (excl. white minority) | 9% minority (excl. white minority) |
| 39% Female | 55% Female |
| 48% Christian; 50% No religion; 2% Other | 33% Christian; 62% No religion; 4% Other |
| 27% attended state-run selective schools; 10% attended independent schools | 18% attended state-run selective schools; 8% attended independent schools |
| 37% work part time | 24% work part time |
The proportion of LGBO staff is similar for the Inspector Profession and other professions; there is also a similar profile in terms of parental qualifications. These figures summarise the characteristics of the Inspector Profession as a whole, but there is of course diversity within this group.
Results obtained through modelling pay via linear regression suggest that age and sex of Planning Inspectorate staff can be used to predict salary and that some other protected characteristics such as ethnicity and disability status are not represented equally across grades.
2. Number of Staff and Profession
The number of staff at the end of March 2023 was 887. This is a measure of headcount. Some of the staff worked part-time; and the full-time equivalent count was 807.8.
Table 1 below shows the number of staff in the Planning Inspectorate as of 31/03/2023. This includes headcount (i.e., the number of different individuals) and full-time equivalents (FTE) where those working part time are counted in proportion with their contracted hours. There were 463 staff working in the Inspector Profession (not all of these are Planning Inspectors) – with a full-time equivalent of 414.1. This is more than half of the Inspectorate’s people – fewer work in support professions (424 headcount: 393.7 FTE) such as operations, strategy, digital and data, human resources, and finance.
Note that the Inspector Profession includes Planning Inspectors and other staff – as such, the number in the Inspector Profession is not the same as the number of Planning Inspectors published in other places.
The Inspector Profession includes Appeals Planning Officers, who submit reports to Planning Inspectors recommending whether the appeal should be allowed or dismissed (Householder Planning Service and s78 Planning Appeals).
Appeals Planning Officers and Apprentice HEOs assist in processing and determining Planning, Enforcement, and a range of other appeals (Tree preservation / replacement, High Hedges and Hedgerow).
Information on the number of people in each of these roles is given in Table 3. Further detail is in Annex A.
Other professions comprise the following categories: Commercial, Communications, Digital, Data and Technology, Finance, Human Resources, Knowledge and Information Management, Legal, Operational Delivery, Planning, Project Delivery and Analysis. Operational Delivery, which includes Case Officers and Case Managers, represents 60% of other professions.
Table 1 – Number of Staff as of 31 March 2023 by Profession
| Profession | Headcount | FTE |
|---|---|---|
| Inspector Profession | 463 | 414.1 |
| Other Professions | 424 | 393.7 |
| Total | 887 | 807.8 |
Figure 1 – Percentage of Staff by Profession (Headcount and Full Time Equivalent), As of 31 March 2023
Inspector Profession and Other Profession Split (Headcount)
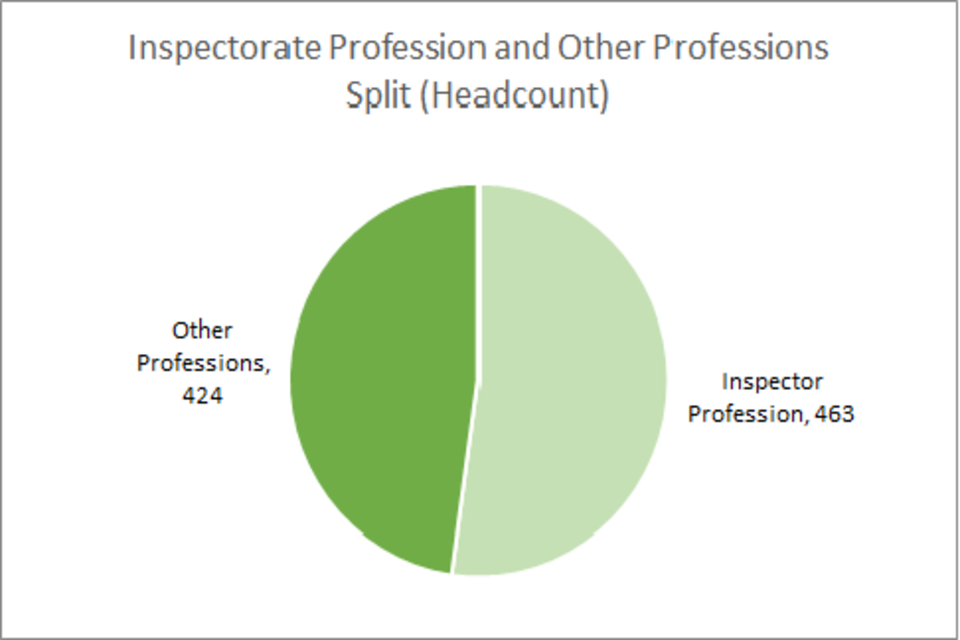
Inspector Profession and Other Profession Split (FTE)
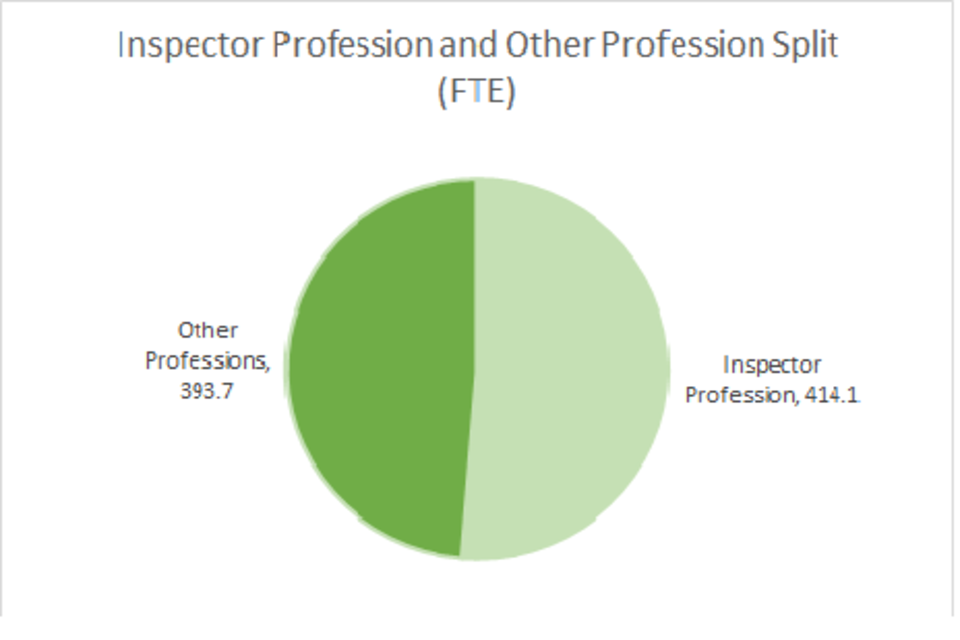
Source: SAP HR
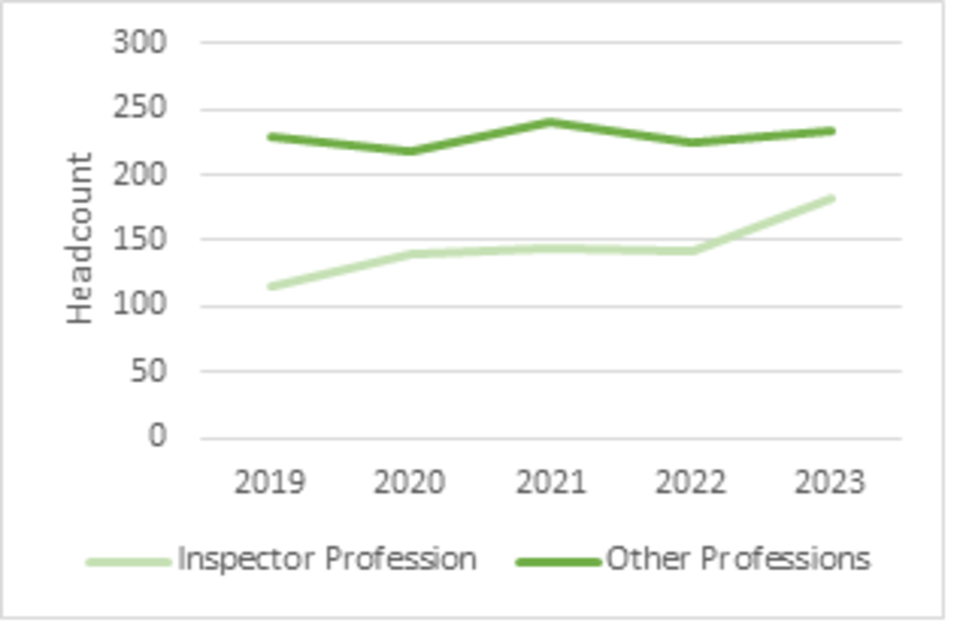
Figure 2 and Table 2 below show the change in number of staff from 2017 to 2022. The increase in the number of staff between 2018 and 2021 was due to the Inspectorate’s organisation redesign process. This redesign was put in place to help the Inspectorate better deliver its strategic goals, better deliver for customers, and better support the Inspectorate’s staff in their careers. Prior to 30th September 2021 the Planning Inspectorate dealt with appeals both in England and Wales. There was a fall in both headcount and FTE in 2022 due to the staff and functions of Planning Inspectorate Wales transferring to Welsh Government
Figure 2 –Staff by Profession (Headcount and Full Time Equivalent), 2017 to 2023
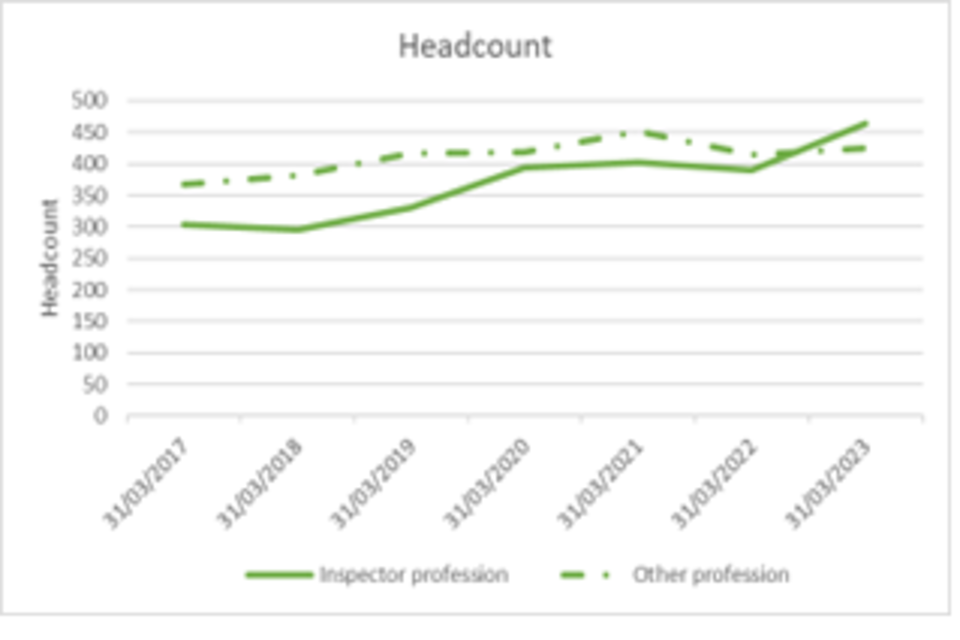
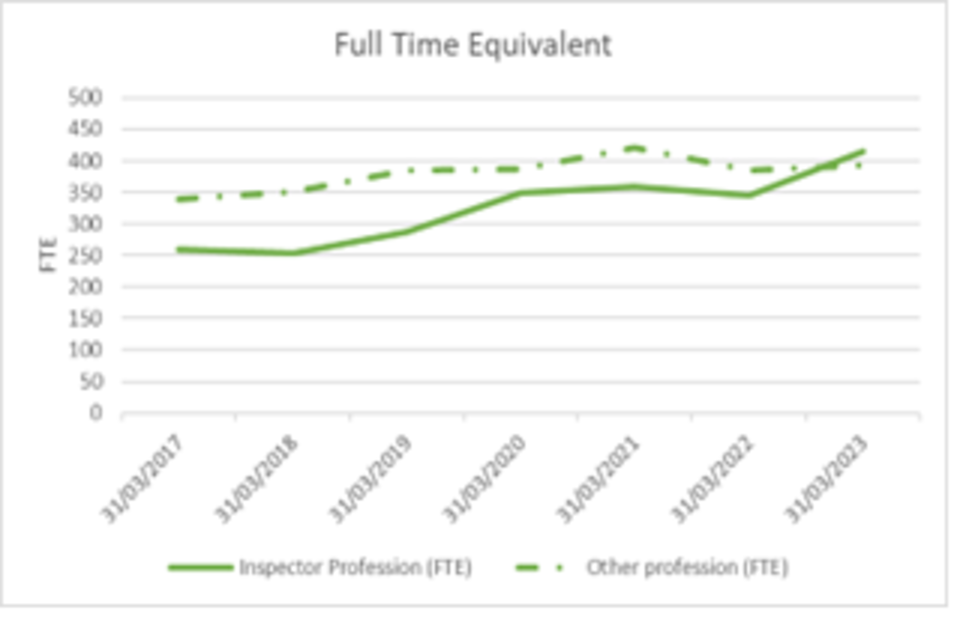
Table 2 – Change in Number of Staff, 2019 to 2023
| Headcount | 2019 | 2020 | 2021 | 2022 | 2023 |
|---|---|---|---|---|---|
| Total Staff | 747 | 812 | 855 | 803 | 887 |
| Inspector profession | 330 | 394 | 403 | 389 | 463 |
| Other profession | 417 | 418 | 452 | 414 | 424 |
| Full Time Equivalent | 2019 | 2020 | 2021 | 2022 | 2023 |
| Total Staff (FTE) | 673.3 | 736.1 | 779.9 | 730.3 | 807.8 |
| Inspector Profession (FTE) | 288.2 | 348.8 | 358.4 | 345.8 | 414.1 |
| Other profession (FTE) | 385.2 | 387.2 | 421.5 | 384.5 | 393.7 |
Source: SAP HR; Note: Data as of 31/03 each year
Table 3 – Number of Staff by Grade as of 31 March 2023
| Grade | Headcount | FTE |
|---|---|---|
| Total | 887 | 807.8 |
| Apprentice HEO | 9 | 9.0 |
| Appeals Planning Officer | 12 | 11.0 |
| BAND 1 Inspector | 165 | 150.5 |
| BAND 2 Inspector | 150 | 131.7 |
| BAND 3 Inspector | 127 | 111.9 |
| Total Inspector Profession | 463 | 414.1 |
| Administrative Assistant (AA) | 6 | 4.9 |
| Administrative Officer (AO) | 138 | 125.5 |
| Executive Officer (EO) | 89 | 83.0 |
| Higher Executive Officer (HEO) | 80 | 75.2 |
| Senior Executive Officer (SEO) | 52 | 49.3 |
| Grade 7 | 37 | 35.2 |
| Grade 6 | 15 | 14.0 |
| Senior Civil Service | 7 | 6.8 |
| Total Other Professions | 424 | 393.7 |
Source: SAP HR
See Annex A for detail on the grades in the table above.
3. Information and Declaration Rates
The information in this release is drawn from the Planning Inspectorate’s Human Resources database (SAP).
In some instances, there is no record of someone’s personal characteristic. This can be for two main reasons:
- The Inspectorate has not asked the person about the characteristics, or
- The Inspectorate has asked, and the person has chosen the option of “prefer not to say” (or similar), or chosen not to answer
Table 4 below shows the proportion of staff for whom the Planning Inspectorate hold information on different aspects of their personal information. The trend for this is upwards over time for every item except ethnicity.
Please note that all subsequent commentary and data give information limited to those on whom information is available. So, where a percentage is given (e.g., % with a disability) this excludes those staff (19% in this case) on whom this information is not held. This is potentially important, as those staff on whom no information is held may have a different profile – so the percentage given may not fully reflect the profile across all staff.
Table 4: Percentage of employees with recorded personal characteristics, 2019 – 2023
| Characteristic | 2019 | 2020 | 2021 | 2022 | 2023 |
|---|---|---|---|---|---|
| Disability | 51% | 61% | 78% | 80% | 81% |
| Ethnicity | 77% | 78% | 86% | 86% | 86% |
| Religion | 48% | 58% | 71% | 73% | 75% |
| Sexual Orientation | 50% | 59% | 72% | 74% | 75% |
Source: SAP HR; Data as of 31/03 each year
Note: All staff are required to disclose their sex, age and working pattern, thus information on these is recorded for 100% of employees.
Figure 3: Percentage of employees with recorded personal characteristics, 2019 - 2023
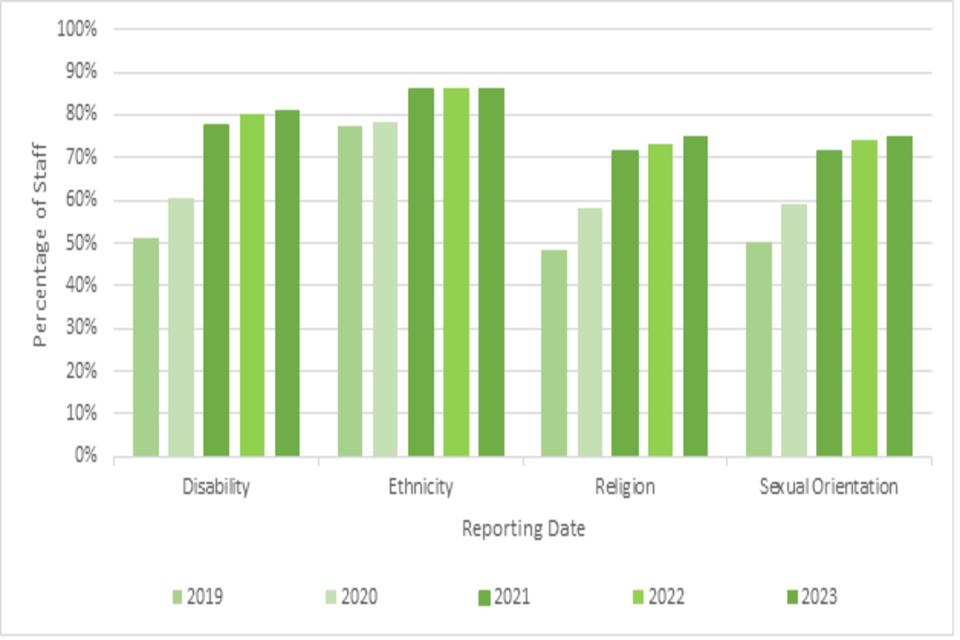
Source: SAP HR; Note: Data as of 31/03 each year. Note: All staff are required to disclose their sex, age and working pattern are thus information on these is recorded for 100% of employees.
Also included in this publication is data on socio-economic characteristics. This is collected via a survey. Further information is included in the Background Quality Report.
The number of staff who did not to provide the Planning Inspectorate with their protected characteristics were comparable with rates for the wider Civil Service (Civil Service declaration rates, Disability 74.1%, Ethnicity 81.5%, Religion 70.6%, Sexual Orientation 71.8% ).
Non-disclosing employees
For all employees who have no record for at least two of the protected characteristics above, 19.3% have been employed at the Planning Inspectorate for fewer than two years. A further 13.3% have been employed for between two and four years.
These employees have a range of grades, but the largest proportions are AO (24.8%), Band 1 (15.8%), Band 2 (14.9%), EO (11.9%) and HEO (10.9%). There are more male (59.4%) than female (40.6%) employees who have two or more non-disclosed personal characteristics. Furthermore, two or more non-disclosed personal characteristics are more common for employees who are forty and above; 24.3% are aged 40-49, 29.2% aged 50-59, and 20.3% aged 60+, compared to 10.4% who are 16-29 and 15.8% aged 30-39.
Figure 4: percentage of staff at each length of service band with 2 or more personal characteristics unreported.
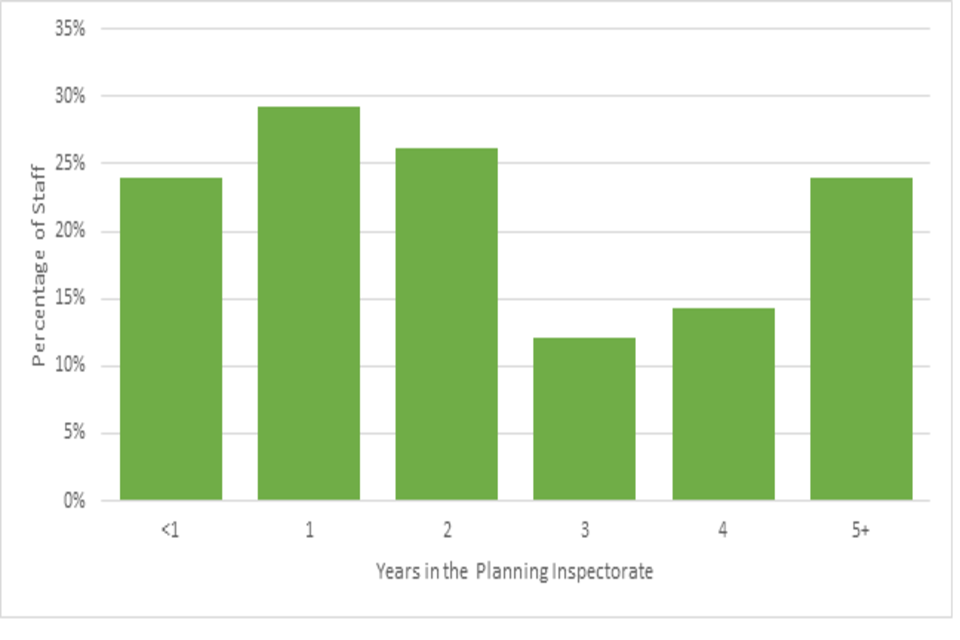
Source: SAP HR
4. Staff Diversity by Protected Characteristic
What follows is a breakdown of staff by various protected characteristics. This is presented in alphabetical order. Each section gives a figure for the Planning Inspectorate as a whole; and then gives separate figures for Inspectors and other professions, further split by grade groups. This is to help understand whether the characteristics apply evenly across all staff. Later sections of this bulletin explore how the factors relate to each other in more depth.
4.1 Age
Table 5 below shows the age profile of staff in the Planning Inspectorate.
The median age of all staff is 47.4 years – 26% are under 40 and 74% are 40 and above. In the Inspector Profession the age profile is somewhat older, with a median age of 49.9 years, 18% under 40 and 82% aged 40 and over. Conversely in other professions staff have a younger profile. The median age is 44.3 years and 35% are under 40, 65% are 40 and above.
Table 5 – Age of Planning Inspectorate Staff as of 31 March 2023a
| Median Age | 16-29 | 30-39 | 40-49 | 50-59 | 60+ | |
|---|---|---|---|---|---|---|
| Total | 47.4 | 8% | 18% | 31% | 29% | 14% |
| BAND 1 | 43.5 | 6% | 26% | 38% | 22% | 8% |
| BAND 2 | 53.3 | 0% | 8% | 34% | 33% | 25% |
| BAND 3 | 55.3 | 0% | 9% | 21% | 40% | 29% |
| Inspector Profession Total | 49.9 | 2% | 16% | 32% | 30% | 19% |
| AA/AO | 43.7 | 23% | 19% | 19% | 26% | 12% |
| EO/HEO/SEO | 43.8 | 13% | 21% | 35% | 25% | 6% |
| G7/G6/SCS | 48.3 | 3% | 19% | 39% | 37% | 2% |
| Other Professional Total | 44.3 | 15% | 20% | 30% | 27% | 7% |
Source: SAP HR
a. Due to rounding, percentages might not add to 100%.
b. ~ indicates a supressed figure. See Confidentiality and Transparency for more detail.
Compared to the civil service, Planning Inspectorate Staff are older. For example:
• 17% of all civil servants are under 30; 8% of Planning Inspectorate staff. • 38% of all civil servants are over 50; 43% of Planning Inspectorate staff. • 11% of all civil servants are over 60; 14% of Planning Inspectorate staff.
Table 6 – Staff Age Profile: Planning inspectorate and Civil Service, 31 March 2023a
| 16-29 | 30-39 | 40-49 | 50-59 | 60 and over | |
|---|---|---|---|---|---|
| Planning Inspectorate | 8% | 18% | 31% | 29% | 14% |
| Civil Service | 17% | 22% | 23% | 27% | 11% |
Sources: SAP HR, Annual Civil Service Employment Survey
a. Due to rounding, percentages might not add to 100%.
Over the last five years, the Inspectorate has a similar shaped age profile of its staff (Figure 5).
Figure 5 - Age of Planning Inspectorate Staff by Headcount and Year, 2019-2023
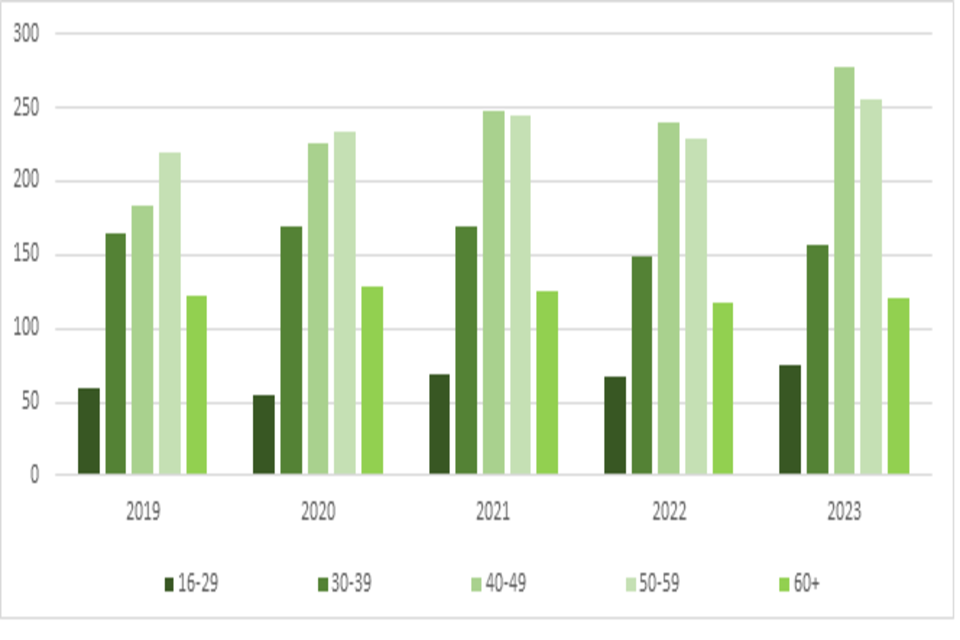
Source: SAP HR; Note: Data as of 31/03 each year
4.2 Disability
Table 7 below shows the number of Planning Inspectorate staff declaring themselves as having a disability. In total, 8% of staff have a disability; with 4% of Inspector grades having a disability, and 12% of other professions.
Disability is higher among lower grade staff – with 18% of AAs and AOs (the lowest grades) having a disability, compared with 8% of EO-SEO grades and 10% of senior managers (Grade 7 and above) having a disability (Figure 6). The same level of disparity is not seen in disability rates across the Inspector grades.
The Planning Inspectorate’s overall disability rate of 8% is below the overall Civil Service rate of 14% (2022).
Table 7 – Planning Inspectorate Staff Declaring Disability as of 31 March 2023
| % Disabled | No | Yes | Total | |
|---|---|---|---|---|
| Planning Inspectorate Total | 8% | 665 | 55 | 720 |
| Inspector Profession Total | 4% | 367 | 15 | 382 |
| BAND 1 / APO / APP HEO | 4% | 144 | 6 | 150 |
| BAND 2 | ~% | 120-124 | <5 | 124 |
| BAND 3 | ~% | 99-103 | 5-9 | 108 |
| Other Professions Total | 12% | 298 | 40 | 338 |
| AA/AO | 18% | 90 | 20 | 110 |
| EO/HEO/SEO | 8% | 163 | 15 | 178 |
| G7/G6/SCS | 10% | 45 | 5 | 50 |
Source: SAP HR ~ indicates a supressed figure. See Confidentiality and Transparency for more detail.
Figure 6 - Percentage of Staff Disabled as of 31 March 2023
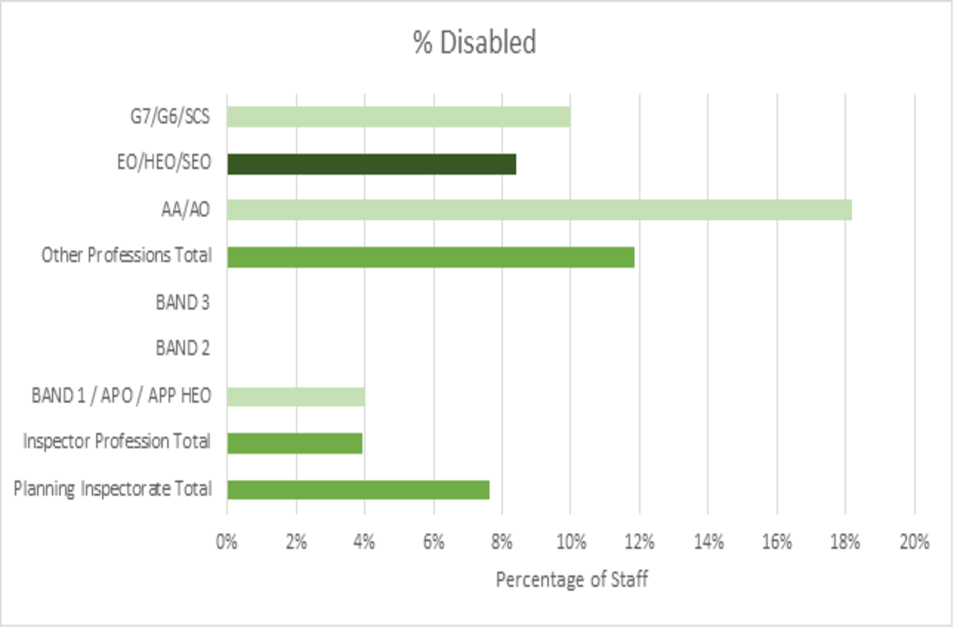
Source: SAP HR
The number of people with a disability has increased from 2018 to 2022 but the percentage of staff with a disability has reduced from a high of 10.4% in 2019 to 8.4% in 2022 (Table 8). Disclosure rates have increased from 51% to 80% over the period and it is not possible to say whether there has been a genuine reduction in the percentage of staff with a disability or increased disclosure rates among those who do not consider themselves to have a disability.
Table 8 – Change in Number and Percentage of Staff with Disability, 2019 – 2023
| Number of Disabled Employees | 2019 | 2020 | 2021 | 2022 | 2023 |
|---|---|---|---|---|---|
| Total | 40 | 46 | 58 | 54 | 55 |
| Inspector Profession | 11 | 11 | 14 | 14 | 15 |
| Other Professions | 29 | 35 | 44 | 40 | 40 |
| % Disabled (of total disclosed) | 2019 | 2020 | 2021 | 2022 | 2023 |
| Total | 10.4% | 9.3% | 8.7% | 8.4% | 7.6% |
| Inspector Profession | 8.1% | 5.1% | 4.5% | 4.5% | 3.9% |
| Other Professions | 11.7% | 12.6% | 12.3% | 11.9% | 11.8% |
Source: SAP HR; Note: Data as of 31/03 each year
4.3 Ethnicity
Ethnic minorities (excluding white minorities) is the currently used terminology replacing the term BAME.
White (including white minorities): is the currently used terminology replacing the term White.
The Planning Inspectorate does not currently collect data on the representation of white minorities.
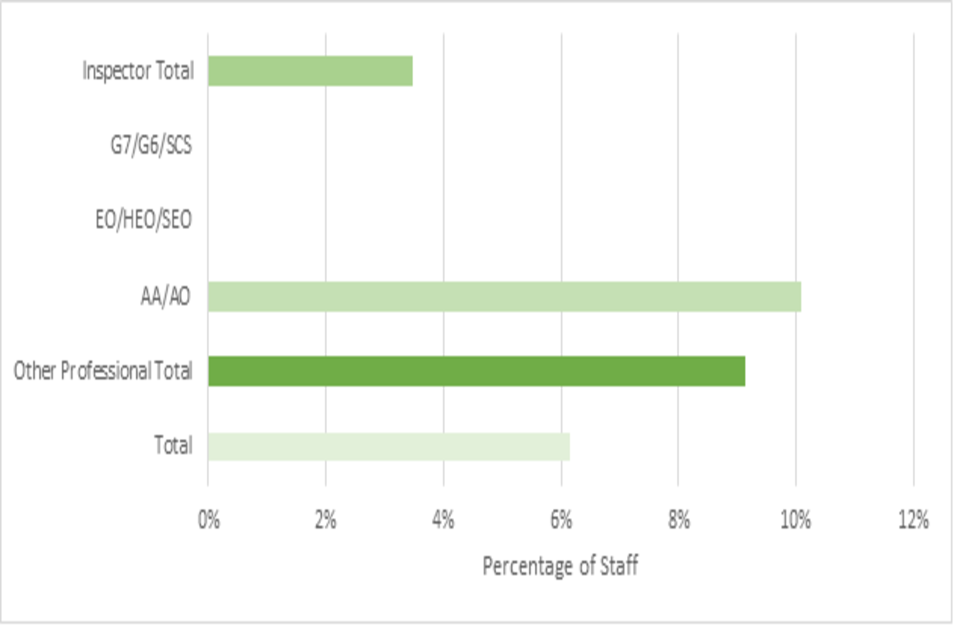
Overall, 6% of Planning Inspectorate staff identify as being from an ethnic minority background (excluding white minorities). This is considerably below the civil service average of 15%.
A lower proportion of Inspectors (3%) identify as being from an ethnic minority background than do other professions (9%). The AAs and AO grade group has the highest representation of people from ethnic minority backgrounds.
Figure 7: Percentage of Staff of Minority Ethnicity (excl White Minority) as of 31 March 2023
Source: SAP HR
Table 9 – Planning Inspectorate Staff Ethnicity as of 31 March 2023
| % Ethnic Minority* | White** | Ethnic Minority* | Total | |
|---|---|---|---|---|
| Total | 6% | 718 | 47 | 765 |
| Other Professional Total | 9% | 328 | 33 | 361 |
| AA/AO | 10% | 107 | 12 | 119 |
| EO/HEO/SEO | ~% | 170-174 | 17-21 | 191 |
| G7/G6/SCS | ~% | 47-51 | <5 | 51 |
| Inspector Total | 3% | 390 | 14 | 404 |
Source: SAP HR
~ indicates a supressed figure. See Confidentiality and Transparency for more detail.
- excluding white minorities
** including white minorities
Table 10 below shows the ethnic groups of staff from an ethnic minority background within the planning inspectorate. The largest groups are Asian and Black (14 people each).
It is not practical to break these down further without risking disclosing personal information about individuals, who have not given their consent to this disclosure.
Table 10 - Ethnicity of staff from an ethnic minority background, as of 31 March 2023
| Asian | 14 |
| Black | 14 |
| Chinese | Fewer than 5 |
| Mixed | 9 |
| Other | 6-10 |
| Total | 47 |
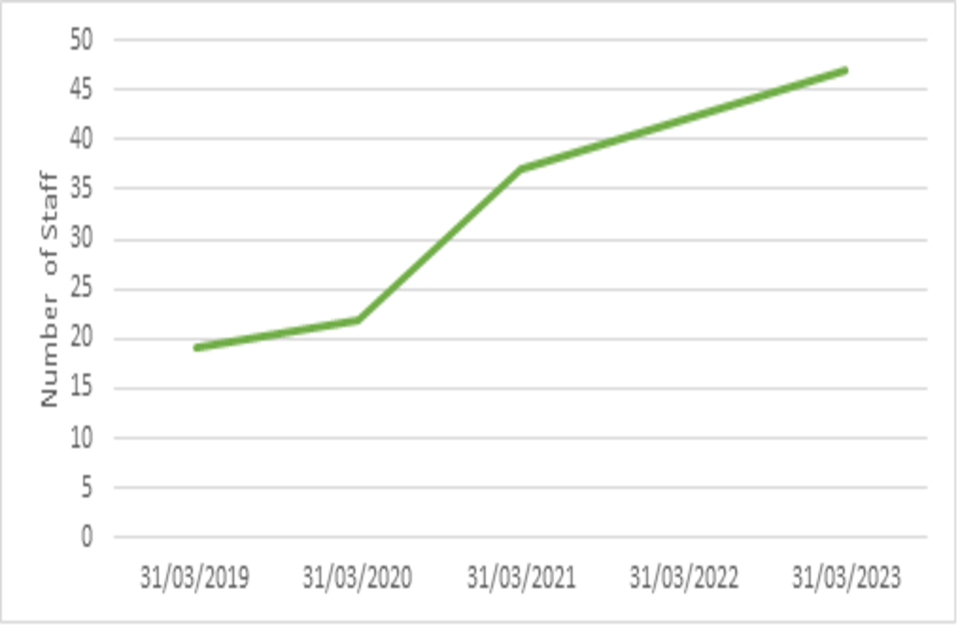
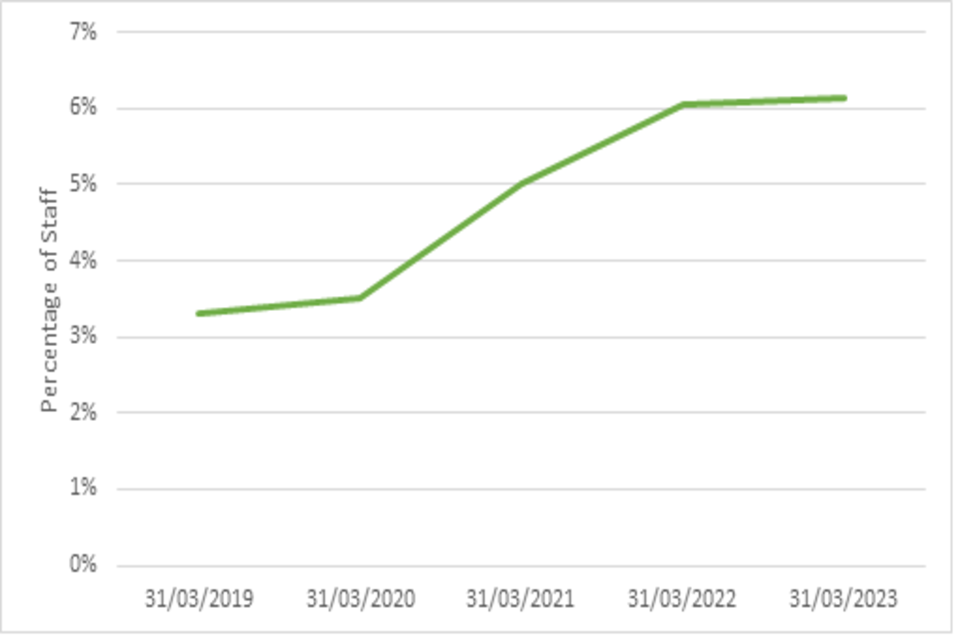
Both the number and percentage of staff from an ethnic minority background has risen over the last 5 years (Figure 8 & Table 11).
Table 11 – Number and Percentage of Ethnic Minority Background Staff, 2019 to 2023
| Number of minority(exc white minority) Staff | 2019 | 2020 | 2021 | 2022 | 2023 |
|---|---|---|---|---|---|
| Total | 19 | 22 | 37 | 42 | 47 |
| Inspector Profession | <5 | <5 | 8 | 6 | 14 |
| Other Professions | 14-19 | 17-22 | 29 | 36 | 33 |
| % minority (exc white minority) (of total disclosed) | 2019 | 2020 | 2021 | 2022 | 2023 |
| Total | 3.3% | 3.5% | 5.0% | 6.1% | 6.1% |
| Inspector Profession | <2% | <2% | 2.3% | 1.8% | 3.5% |
| Other Professions | ~% | ~% | 7.5% | 10.1% | 9.1% |
Source: SAP HR; Note: Data as of 31/03 each year
Figure 8 - Number and Percentage of staff from an ethnic minority background, 2019 to 2023
Source: SAP HR
4.4 Sex
Table 12 and Figure 9 below show the legal sex of staff within the Planning Inspectorate. All references below to female or male staff are based on their sex, as this is the only gender data recorded. 47% of staff are female, which is lower than the civil service as a whole, where 55% are female. 39% of the Inspector profession are female; this is lower than the other professions, where over half (55%, akin to the civil service average) are female. Within the other professions, the highest percentage of females is in the lowest grade staff (66% of AA/ AO staff are female).
Table 12: Planning Inspectorate staff by sex as of 31 March 2023
| % Female | Female | Male | Total | |
|---|---|---|---|---|
| Planning Inspectorate Total | 47% | 415 | 472 | 887 |
| Other Professional Total | 55% | 233 | 191 | 424 |
| AA/AO | 66% | 95 | 49 | 144 |
| EO/HEO/SEO | 51% | 113 | 108 | 221 |
| G7/G6/SCS | 42% | 25 | 34 | 59 |
| Inspector Total | 39% | 182 | 281 | 463 |
| Band 1/APO/APP HEO | 46% | 85 | 101 | 186 |
| Band 2 | 33% | 49 | 101 | 150 |
| Band 3 | 38% | 48 | 79 | 127 |
Source: SAP HR
Figure 9 - Percentage of Staff Female as of 31 March 2023
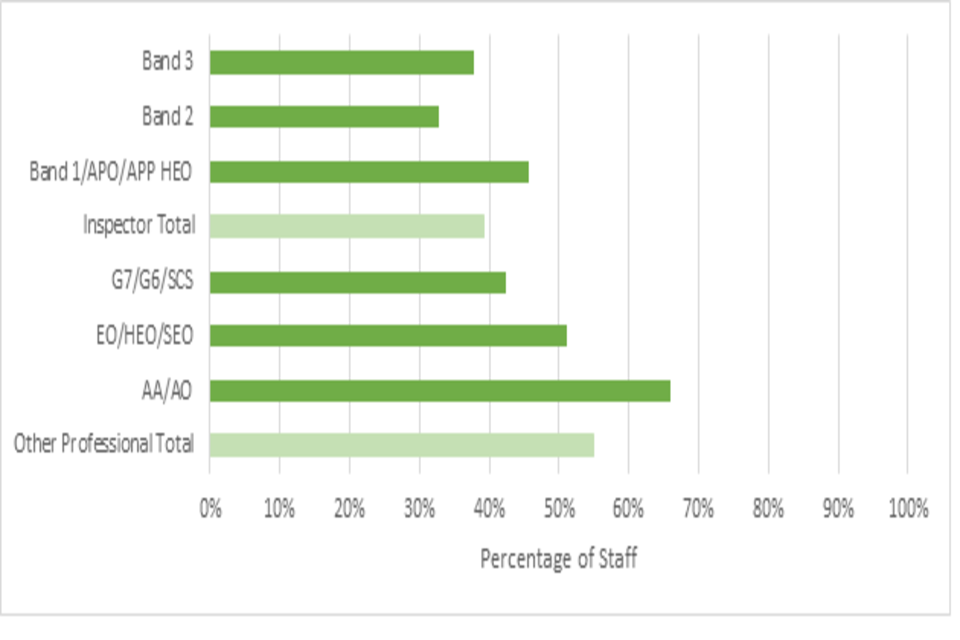
Source: SAP HR
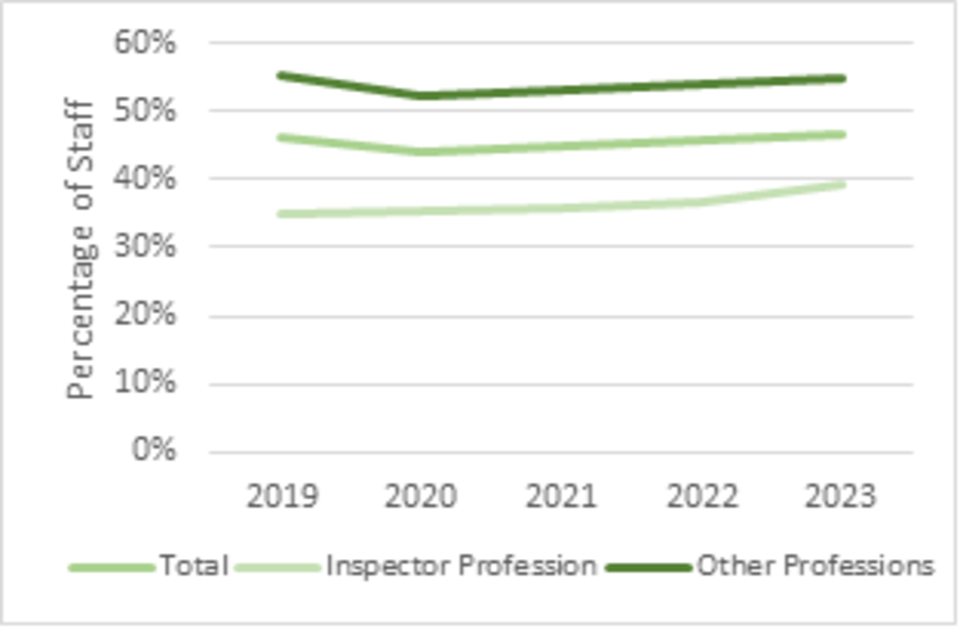
The percentage of female staff in the Inspectorate has remained relatively stable over the past 5 years. The number of female staff employed has risen over the same period. (Figure 10 & Table 13).
Table 13 – Number and Percentage of Female Staff, 2019 – 2023
| Number of Female Staff | 2019 | 2020 | 2021 | 2022 | 2023 |
|---|---|---|---|---|---|
| Total | 345 | 358 | 384 | 367 | 415 |
| Inspector Profession | 115 | 139 | 144 | 143 | 182 |
| Other Professions | 230 | 219 | 240 | 224 | 233 |
| % Female | 2019 | 2020 | 2021 | 2022 | 2023 |
| Total | 46.2% | 44.1% | 44.9% | 45.7% | 46.8% |
| Inspector Profession | 34.8% | 35.3% | 35.7% | 36.8% | 39.3% |
| Other Professions | 55.2% | 52.4% | 53.1% | 54.1% | 55.0% |
Source: SAP HR Note: Data as of 31/03 each year
Figure 10 - Number and Percentage of Female Staff, 2019 to 2023
Source: SAP HR
4.5 Religion/Belief
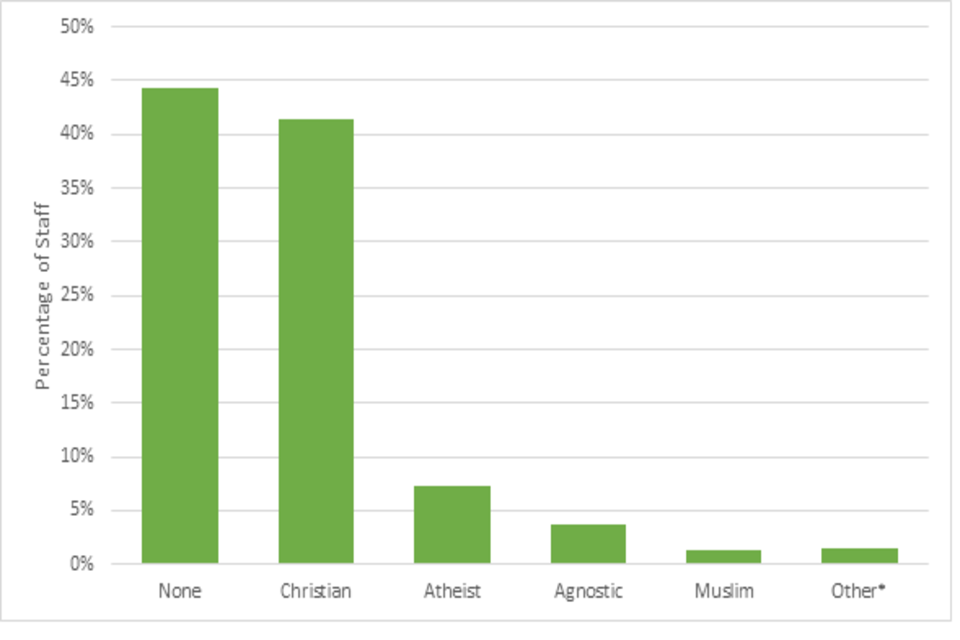
Where staff have declared their religion, most are either of no religion (44%) or Christian (41%). A further 1% of staff are Muslim and 2% of staff are of any other religions: there are fewer than 10 staff in each of the religions included in the other category (see Figure 11 and Table 12 below).
As a contrast, across the Civil Service, 46% of staff are Christian; 41% are of No Religion; and 13% Other.
Figure 11 - Religion of Planning Inspectorate Staff as of 31 March 2023
Source: SAP HR
Table 14 - Planning Inspectorate staff by Religion as of 31 March 2023
| Religion | % of Staff | Number of Staff |
|---|---|---|
| None | 44% | 293 |
| Christian | 41% | 274 |
| Atheist | 7% | 48 |
| Agnostic | 4% | 25 |
| Muslim | 1% | 9 |
| Other* | 2% | 13 |
| Total | 662 |
Source: SAP HR
Note: *Includes any other religious group where fewer than 5 staff members have disclosed their religion.
Table 15 – Change in Percentage of Staff, 2019 – 2023
| Number Christian | 2019 | 2020 | 2021 | 2022 | 2023 |
|---|---|---|---|---|---|
| Total | 43% | 44% | 40% | 42% | 41% |
| Inspector Profession | 51% | 51% | 50% | 50% | 48% |
| Other Professions | 32% | 35% | 30% | 33% | 33% |
| Number Other Religion | 2019 | 2020 | 2021 | 2022 | 2023 |
| Total | 4% | 4% | 4% | 3% | 3% |
| Inspector Profession | <3% | 3% | 2% | 2% | 2% |
| Other Professions | 7% | 6% | 7% | 5% | 4% |
| Number No Religion | 2019 | 2020 | 2021 | 2022 | 2023 |
| PINS Total | 53% | 52% | 55% | 55% | 55% |
| Inspector Profession | 48% | 47% | 48% | 49% | 50% |
| Other Professions | 61% | 59% | 64% | 62% | 62% |
Source: SAP HR; Note: Data as of 31/03 each year
Note: No Religion includes None, Atheist and Agnostic.
4.6 Sexual Orientation
Table 16 below shows the sexual orientation of Planning Inspectorate staff. Overall, 5% of staff identify as being lesbian, gay, bisexual or other (LGBO). This is below the civil service average of 6%.
The proportions are similar across Inspectors and other professions. Further inference is limited due to the risk of disclosure.
Table 16 – Planning Inspectorate Staff Sexual Orientation as of 31 March 2023
| % LGBO | Heterosexual/Straight | LGBO | Total | |
|---|---|---|---|---|
| Planning Inspectorate Total | 5% | 636 | 31 | 667 |
| Other Professional Total | 5% | 280 | 14 | 294 |
| AA/AO | ~% | 82-86 | <5 | 86 |
| EO/HEO/SEO | 6% | 150 | 9 | 159 |
| G7/G6/SCS | ~% | 45-49 | <5 | 49 |
| Inspector Total | 5% | 356 | 17 | 373 |
| BAND 1 / APO / APP HEO | ~% | 133-137 | 8-12 | 145 |
| BAND 2 | ~% | 116-120 | <5 | 120 |
| BAND 3 | 5% | 103 | 5 | 108 |
Source: SAP HR ~ indicates a supressed figure. See Confidentiality and Transparency for more detail.
In 2023 there are 31 staff who identify as being lesbian, gay, bisexual or other sexuality (not including heterosexual) (Table 17). The figures for 2019-2021 do not include staff identifying as ‘other’ so cannot be compared with 2022 and 2023.
Table 17 – Change in Number and Percentage of Staff LGB, 2019 – 2023
| Number of LGB Employees | 2019 | 2020 | 2021 | 2022 | 2023 |
|---|---|---|---|---|---|
| Total | 19 | 18 | 23 | 28 | 31 |
| Inspector Profession | 9 | 8 | 10 | 14 | 17 |
| Other Professions | 10 | 10 | 13 | 14 | 14 |
| % LGB (of total disclosed) | 2019 | 2020 | 2021 | 2022 | 2023 |
| Total | 5.1% | 3.8% | 3.8% | 4.7% | 4.6% |
| Inspector Profession | 4.3% | 2.9% | 3.1% | 4.5% | 4.6% |
| Other Professions | 6.1% | 5.0% | 4.4% | 5.0% | 4.8% |
Source: SAP HR; Note: Data as of 31/03 each year
4.7 Socio-economic Background
Statistics on the socio-economic background of the Inspectorate’s staff helps the Inspectorate understand and address barriers to social mobility. Two elements of socio-economic background are included.
Table 18 below shows how people in the Planning inspectorate were educated. The majority (63%) attended state-run, non-selective schools; a further 23% attended state-run selective schools.
A higher proportion of those in the Inspector profession attended state-run selective schools (27%) and independent schools (10%) than those in the other professions (18% and 8%).
Table 18 – Education of Planning Inspectorate Staff, 31 March 2023
| Education | Insp. profession | Insp % | Other profession | Other % | Total | Total % |
|---|---|---|---|---|---|---|
| State run – non-selective | 213 | 59% | 189 | 67% | 402 | 63% |
| State run - selective | 98 | 27% | 51 | 18% | 149 | 23% |
| Independent | 35 | 10% | 23 | 8% | 58 | 9% |
| Other (including outside uk) | 15 | 4% | 18 | 6% | 33 | 5% |
| Prefer not to say/ Not known | 102 | 143 | 245 |
Source: SAP HR
As seen in Table 19 below, 39% of those in the Planning Inspectorate have a parent with a degree or higher. A further 43% have one or both parents with a qualification below degree level. There were 18% of staff whose parents did not have a formal qualification. There is little difference in these proportions when comparing the inspector profession to other professions.
Table 19 – Parental Qualification of Planning Inspectorate Staff, 31 March 2023
| Parental Qualification | Insp. profession | Insp % | Other profession | Other % | Total | Total % |
|---|---|---|---|---|---|---|
| At least degree | 138 | 41% | 91 | 37% | 229 | 39% |
| Qualification below degree | 140 | 41% | 109 | 45% | 249 | 43% |
| No formal qualification | 60 | 18% | 43 | 18% | 103 | 18% |
| Prefer not to say/ Not known | 125 | 181 | 306 |
Source: SAP HR
Note: “Other” included in “Prefer not to say/ Not known”
4.8 Working Pattern (Full Time / Part Time)
The proportion of staff working part-time is higher among Inspectors (37%) than among other professions (24%). More detail is given in Table 20 below. This shows that both the number and proportion of staff working part-time has been relatively steady between 2019 and 2023.
Table 20 – Change in Number and Percentage of Staff working Part Time, 2019 – 2023
| Number of Part time Employees | 2019 | 2020 | 2021 | 2022 | 2023 |
|---|---|---|---|---|---|
| Total | 242 | 257 | 256 | 252 | 274 |
| Inspector Profession | 143 | 159 | 157 | 155 | 171 |
| Other Professions | 99 | 98 | 99 | 97 | 103 |
| % Part time | 2019 | 2020 | 2021 | 2022 | 2023 |
| Total | 32.4% | 31.7% | 29.9% | 31.4% | 30.9% |
| Inspector Profession | 43.3% | 40.4% | 39.0% | 39.8% | 36.9% |
| Other Professions | 23.7% | 23.4% | 21.9% | 23.4% | 24.3% |
Source: SAP HR Note: Data as of 31/03 each year
5. How Characteristics Relate
The section above looked at staff numbers by characteristic, with each factor looked at independently of the others. This section looks at whether those characteristics are independent or linked.
A series of statistical tests have been carried out to test whether there is any link between different aspects of diversity. These are detailed at Annex B; and in the Background Quality Report.
Many of the characteristics do have a link, with some examples given below. Whether someone is in the Inspector Profession is clearly an important factor in relation to diversity. There is a significant difference in profiles between Inspectors and other professions, for: age; disability; ethnicity, sex, religion; and working pattern. The only characteristic which shows no difference across professions is sexual orientation (meaning Inspectors are no more or less likely to be LGBO than other professions).
Note that the results do not mean that one factor causes the difference in the other – there can be very complex explanations to the lack of independence, for instance both being related to a third factor. Also, because the numbers in some groups is low, small differences in reporting, even by just one person, can have an impact on the tests.
Some of the results are shown below – note that not all characteristics found to be related are shown.
| Significant results | Finding |
|---|---|
| Ethnicity and profession | Inspector professions less likely to be from an ethnic minority background; other professions less likely |
| Disability and profession | Inspector profession less likely to have a disability; other professions more likely to have a disability |
| Religion and Profession | Inspector profession disproportionately higher numbers Christian; disproportionately fewer atheist/ agnostic/ no religion and fewer other religions. |
| Work Pattern and Inspector Grade | Band 1 more likely to work full time; Band 3 more likely to work part time. |
| Sex and other Professional Grade | AA/AO more likely to be female; EO/HEO/SEO more likely to be male. |
| Disability and other Professional Grade | AA/AO more likely to be disabled and other grade groups less so |
The following aspects of diversity were found to be independent of each other – meaning there was no evidence to suggest the characteristics are related. For example, an Inspector’s grade is not related to their sex.
| Found to be independent when tested | |
|---|---|
| Profession and Sexual orientation | Profession and parental qualification |
| Inspector grade and sex | Inspector grade and parental qualification |
| Inspector grade and school attended | Other professional grade and work pattern |
| Other professional grade and parental qualification |
Some relationships could not be included in the tables above because the low numbers expected in some groups makes the statistical test used (Chi-squared test) unreliable.
5.1 Diversity Clusters
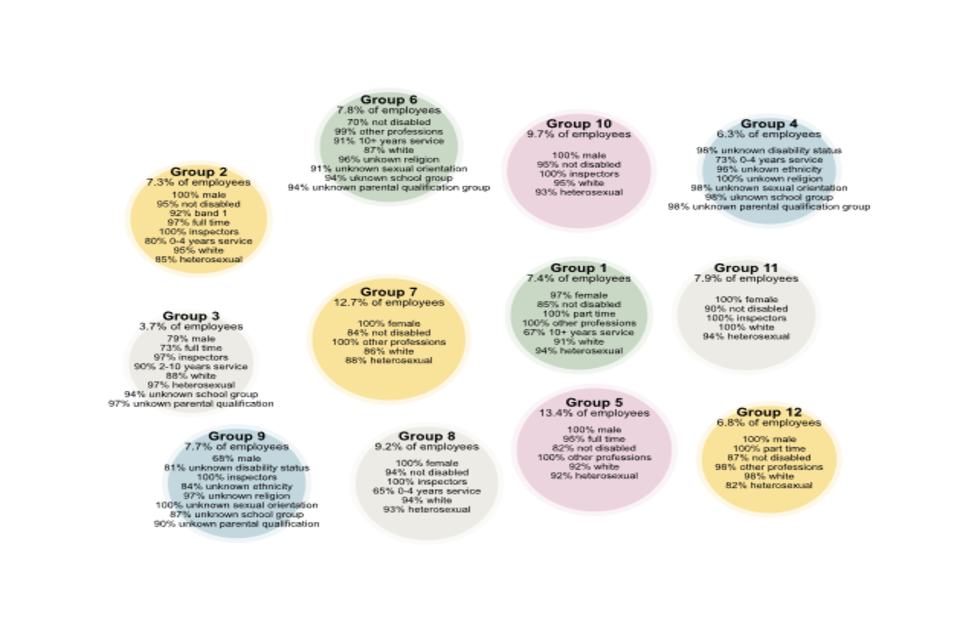
Repeating a similar process to last year’s release, additional insight into the relationships between characteristics has been sought out via cluster analysis. This can be helpful in identifying complex underlying patterns which are not obvious when looking at the characteristics one at a time. Twelve groups are identified in Figure 12, which provides an infographic representation of the clustering results. Group number, colour, and position is arbitrary. The size of the bubbles are proportional to the percentage of employees in each cluster
Figure 12: Groups of employees identified by clustering analysis, using data from 2022
Text only version of above Figure
Group 1: 7.4% of employees
97% female, 85% not disabled, 100% part time, 100% other professions, 67% 10+ years service, 91% white, 94% heterosexual
Group 2: 7.3% of employees
100% male, 95% not disabled, 92% band 1, 97% full time, 100% inspectors, 80% 0-4 years service, 95% white, 85% heterosexual
Group 3: 3.7% of employees
79% male, 73% full time, 97% inspectors, 90% 2-10 years service, 88% white, 97% heterosexual, 94% unknown school group, 97% unknown parental qualification
Group 4: 6.3% of employees
98% unknown disability status, 73% 0-4 years service, 96% unkown ethnicity, 100% unkown religion, 98% unknown sexual orientation, 98% uknown school group, 98% unknown parental qualification group
Group 5: 13.4% of employees
100% male, 95% full time, 82% not disabled, 100% other professions, 92% white, 92% heterosexual
Group 6: 7.8% of employees
70% not disabled, 99% other professions, 91% 10+ years service, 87% white, 96% unkown religion, 91% unknown sexual orientation, 94% uknown school group, 94% unknown parental qualification group
Group 7: 12.7% of employees
100% female, 84% not disabled, 100% other professions, 86% white, 88% heterosexual
Group 8: 9.2% of employees
100% female, 94% not disabled, 100% inspectors, 65% 0-4 years service, 94% white, 93% heterosexual
Group 9: 7.7% of employees
68% male, 81% unknown disability status, 100% inspectors, 84% unknown ethnicity, 97% unknown religion, 100% unknown sexual orientation, 87% unknown school group, 90% unknown parental qualification
Group 10: 9.7% of employees
100% male, 95% not disabled, 100% inspectors, 95% white, 93% heterosexual
Group 11: 7.9% of employees
100% female, 90% not disabled, 100% inspectors, 100% white, 94% heterosexual
Group 12: 6.8% of employees
100% male, 100% part time, 87% not disabled, 98% other professions, 98% white, 82% heterosexual
Source: SAP HR
To prevent the figure from being overcrowded with text, only the majority instances – with a few exceptions – have been displayed. Note that it is not compulsory for employees to disclose any information relating to protected characteristics, so the cluster descriptions do not give complete information. For example, Group 2 consisting of 95% non-disabled does not necessarily imply that the remaining 5% are all disabled.
While the clustering algorithm has prominently leaned on certain variables, it’s evident that other characteristics such as disability status, ethnicity, and sexual orientation also exhibit distinct patterns across clusters. These clusters highlight several interesting observations:
- Groups 2, 3, 8, 9, 10, and 11 are dominated by inspectors. Among these, groups 2, 3, 9, and 10 predominantly consist of males, while group 8 and 11 exclusively comprises of females.
- Groups 1, 4, 5, 6, 7 and 12 are dominated by other professions. Among these groups 5 and 12 predominantly consist of males, while groups 1 and 7 predominantly consist of females.
- Group 1 identifies a clear subset of female staff from other professions, working part-time with over 10 years of service.
- Group 2 reveals a group of full-time male inspectors who are relatively new in service, with 80% having 0-4 years of service. This is consistent with 92% of them being in Band 1.
- Several clusters indicate groups where employee characteristics remain undisclosed. Clusters with high percentages of missing information include:
- Group 3, which is predominant in unknown values across school group, and parental qualification.
- Groups 4 and 9 stand out with undisclosed values for disability status, ethnicity, religion, sexual orientation, school group, and parental qualification.
- Group 6, with unknown values for religion, sexual orientation, school group and parental qualification.
- Groups 2, 4, and 8 contain a large percentage or relatively new employees (0-4 years of service) at 80% and 73% and 65%, respectively. Group 4 has members who didn’t disclose several characteristics, likely because they were not presented with the opportunity to input that information during initial data capture.
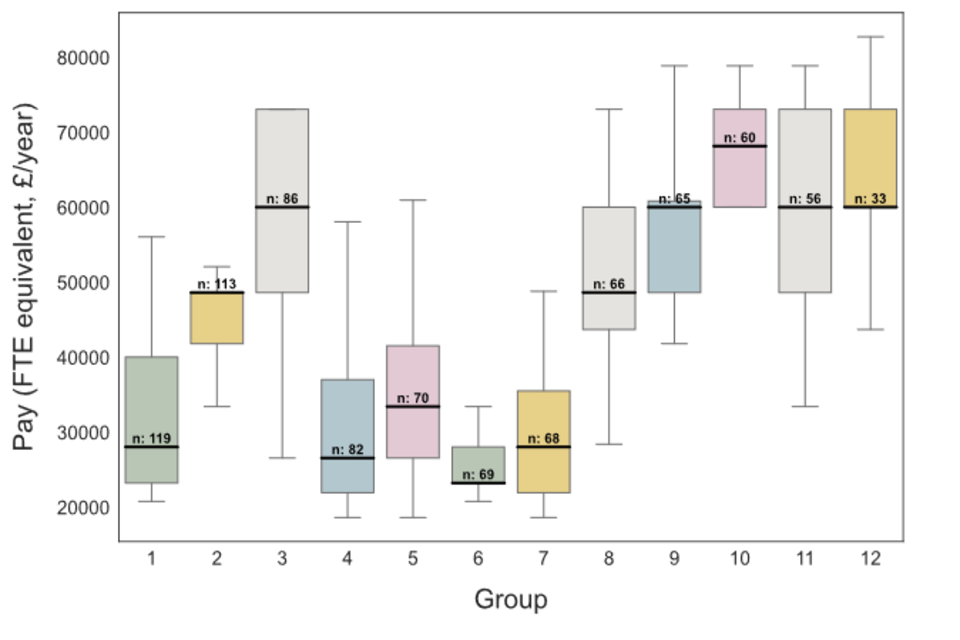
The distribution of pay per group is also investigated, as seen in Figure 13, where boxplots have been assigned the same colour as their respective clusters. Datapoints lying outside 1.5 times the interquartile range have been omitted from the figure for disclosure reasons. Pay is taken to be the FTE pay in £ per year.
Note that the y-axis does not start from zero and the number of people per group is specified above the median line. Some boxes do not appear to feature a median line because the median is either the same, or very close to, the lower or upper quartile. The median line has been made bold to make these instances visible.
Figure 13: Pay (FTE equivalent, £/year) distributions of grouped employees identified by clustering analysis, using data from 2022.
Source: SAP HR
The distribution of pay is different across the identified groups. There are some factors that are reasonably expected to affect pay, such as grade and tenure, while some factors should be unrelated, such as disability status and ethnicity.
5.2 Modelling Pay Using Linear Regression
To further investigate whether any statistically significant conditional relationships exist between pay and protected characteristics, a log-linear regression is used to model pay as a function of numerous variables.
Two separate regression models are fitted – one that accounts for grade and one that doesn’t – with the expectation that the model accounting for grade will have a good fit to the data and no protected characteristics will be statistically significant. If any such characteristics are determined to be statistically significant, this will be evidence to suggest that there is a pay disparity within grade that can be predicted using these characteristics.
Aside from the variable const (the intercept) all other values can be interpreted as the percentage change in pay, conditional on all other variables. For continuous variables, this is relative to a one-unit increase. For categorical variables, this is relative to the reference cases which in this instance are:
- Sex = Male
- Grade = AA
- Ethnicity = White
- Religion = Atheist/Agnostic
- Disability = None
- Sexual Orientation = Heterosexual
- School Group = State run (non-selective)
- Highest Parental Qualification = No formal qualification
From the first table in Annex C, several protected characteristics—age, disability, ethnicity, sex, parental qualification, and religious belief—emerge as statistically significant predictors of pay when grade is not controlled for. However, the second table reveals that only age and sex remain significant predictors of pay once grade is factored in. This observed significance of age aligns with the commonly accepted understanding that increased years of experience, often correlated with age, tend to be associated with higher compensation. This indicates evidence of pay disparity within grades based on age and sex. Specifically, after controlling for grade, a one-unit increase in age corresponds to an average pay increase of 0.03%. Similarly, a one-unit shift in the variable “gender_Female” (from 0, representing male, to 1, representing female) corresponds to an average pay decrease of 0.91%. Another way to understand this is that females, on average, experience a pay disparity of 0.91%. The significance observed in the model without grade control for factors such as disability, ethnicity, parental qualification, and religious beliefs might stem from these characteristics serving as proxies for grade. Additionally, it’s notable that the model accounting for grade demonstrates an exceptionally strong fit, boasting an r-squared value of 0.99.
Overall, the contrasting results between the two models underscore that compensation within the same grade exhibits variances attributable to age and gender. Specifically, within any given grade, older males appear to receive the highest compensation, while younger females are at the opposite end of the spectrum. It’s also pertinent to highlight that certain characteristics, including age, disability, ethnicity, gender, and sexual orientation, demonstrate disproportionate representation across grades. Such disparities have been comprehensively detailed in tables found in sections 1-4 and 6 of the “Staff Diversity by Protected Characteristics” report.
6. Approach to Equality, Diversity and Inclusion
The following section has been supplied by the Inspectorate’s Equality, Diversity and Inclusion Officer, who is a member of the Human Resources team, to give context to the statistics and an indication of the Inspectorate’s approach.
In September 2020 the Planning Inspectorate launched its five-year Equality, Diversity and Inclusion approach and plan. This was developed using the data available to us about our employees, our vision of where we would like to be in 5 years’ time and following best practice from the Chartered Institute of Personnel and Development (CIPD). It is not a static document as we recognise that 5 years is a long time, and it has been continuously updated and evolving with our work. It is very clear that we are not yet the diverse organisation we would wish to be but we have continued to build upon some foundational and fundamental steps towards improving this in the last couple of years.
Our Executive Team have continued to make Equality, Diversity and Inclusion a key priority in the business plan throughout 23/24 and it will continue to be a priority whilst we continue to embed this into our organisational culture.
With this in mind, we have carried out a number of diversity and inclusion activities in the last year:
- Recruitment of a dedicated ED&I Officer to support in review and delivery of our ED&I strategy.
- Continued promotion of our employee networks, including how we support the networks. We have had two new networks begin, the Christian Network and the Wellbeing Network. We have seen promising growth and real momentum from several networks over the past year.
- Connecting with our Networks to gain feedback from staff groups on ED&I work, policies, and other areas.
- Our work on Apprenticeships and Outreach has expanded, with further work on building an interest in the Planning Sector as a career.
- Expansion in our Learning and Development team meaning the embedding of ED&I across this work area.
- Continued work in the Planning Inspectorate gender pay gap figures, increases in recruitment of female Planning Inspectors, and exploration of further work to be done.
- Celebration of Pride Month and Black History Month across the organisation and participation in Bristol Pride.
- Updates on policies for staff by our Human Resources team, in line with best practice and the Civil Service.
- Expansion on our undertaking of Equality Impact Assessments for all projects and events.
- Working with the Employer’s Network for Equality and Inclusion (ENEI) as members, to further our resources for ED&I work. Delivery on recommendations from this partnership and expanding on previous consultancy work.
- Applying for ENEI’s Talent, Inclusion and Diversity Evaluation benchmarking awards, to compare our ED&I work across eight areas with other organisations in our sector, region and country. We won a Bronze award, showing how far we have come with our ED&I work, but that we still have room for further work and improvement.
There is still so much to do to drive the diversity and inclusion agenda forward. We have undertaken a lot of activity in the last year, however we understand that we must continue this work if we want to meet our diversity and inclusion targets. We are committed to continually prioritising ED&I to ensure this happens.
7. Data Sources
The statistics provided in this publication has used data from:
SAP HR – The Human Resources system database used to store all information regarding members of staff. This data source has been used to provide statistics on the demographics and Socio-economic background of staff employed by the Planning Inspectorate as at 31 March 2023.
Note that where information is based on self reporting, there is the possibility of mis-reporting (whether accidental or deliberate) While this is considered unlikely to be widespread, where percentages are very low, a small number of individuals would have noticeable impacts on the results. Thus the impact of mis-reporting on these figures could be high.
The Inspectorate regularly review the quality of information held and will continue to encourage regular updates by their employees, however an element of non-response can still be expected.
8. Definitions
Glossary
| Term | Explanation |
|---|---|
| Ethnic Minority | Person identifying themselves as being from an ethnic minority background, in this case not including white minority backgrounds |
| Disability | The Equality Act 2010 defines disability as a physical or a mental condition which has a substantial and long-term impact on your ability to do normal day to day activities. |
| The SAP HR system asked staff to select if they are disabled or not disabled. The Equality Act definition was not provided, and therefore there may be some under-reporting. | |
| Full Time | See Working Pattern |
| FTE | Full Time Equivalent – a count of employees where those working part time are counted in proportion with their contracted hours. |
| Headcount | Total number of staff employed regardless of how many hours they work (i.e. the number of different individuals). |
| Inspector Profession | This includes Planning Inspectors, Appeals Planning Officers, and Apprentice HEOs. |
| LGBO | Lesbian, gay, bisexual, other |
| Part Time | See Working Pattern |
| Protected Characteristic | A characteristic protected by the 2010 Equality Act. These include age, disability, ethnicity, religion or belief, sex and sexual orientation. |
| SAP | The Planning Inspectorate’s Human Resources database |
| Working Pattern | A full time member of staff is one contracted to work 37 hours a week throughout the year. Staff contracted to work less than 37 hours a week, or not contracted to work for the whole year, are part time. |
8.1 Compliance with the Code of Practice for Statistics
These statistics have been published in accordance with the Code of Practice for Statistics, which cover trustworthiness, quality, and value. They have been pre-announced, and publication is overseen by the Head of Profession.
8.2 Confidentiality and transparency
The tables in the report were scrutinised to ensure individual identities were not revealed inadvertently. Suppression has been applied to ensure individuals were not inadvertently identified dependent on their risk of exposure. Numbers less than five and the related percentages were suppressed and presented as ‘<5’ and ‘~%’. Where there was only one cell in a row or column that was less than five, another value or a range of values were also supressed so that numbers cannot simply be derived from totals.
8.3 Technical Notes
A Background Quality Report is published alongside this Statistical Release. It provides more detail on the quality of statistics in this publication.
9. Future Statistics
9.1 Forthcoming statistical releases
Information on Gender Pay Gap was last published by the Cabinet Office in November 2002. Figures for 2023 have not yet been published. https://www.gov.uk/government/publications/dluhc-gender-pay-gap-report-and-data-2022/dluhcs-gender-pay-gap-report-2022.
Some of the data provided in this release is also available in the Annual Civil Service Employment Statistics https://www.gov.uk/government/statistics/civil-service-statistics-2023
The Planning Inspectorate publish statistics on casework (mostly appeals) each month. The next such statistics will be published on the 21st September.
9.2 Feedback and enquiries
The Planning Inspectorate welcome feedback on our statistical products. If you have any comments or questions about this publication or about our statistics in general, you can contact us as follows:
Public enquiries email statistics@planninginspectorate.gov.uk
Media enquiries 0303 444 5004 email press.office@planninginspectorate.gov.uk
Please note we are always looking for opportunities to improve our statistics with a view to making them as clear and helpful as possible for users. We would be delighted if you could contact us via the address below with any views on this approach; particularly on what content would be most useful and why.
email statistics@planninginspectorate.gov.uk
If you require information which is not available within this or other available publications, you may wish to submit a Request for Information under the Freedom of Information Act 2000 to the Planning Inspectorate. For more information, see: https://www.gov.uk/make-a-freedom-of-information-request/the-freedom-of-information-act
10. Annex A - Grades within the Planning Inspectorate
Included within the Planning Profession: (From most senior to most junior)
| Band 3 | Band 3 Planning Inspector (Highest level of Inspector) |
|---|---|
| Band 2 | Band 2 Planning Inspector |
| Band 1 | Band 1 Planning Inspector |
| APO | Appeals Planning Officer |
| APP HEO | Apprentice Higher Executive Officer |
Included within other Professions: (From most senior to most junior)
| G5+ | Senior Civil Servant - Planning Inspectorate CEO and Directors |
|---|---|
| G6 | Grade 6 Senior Manager |
| G7 | Grade 7 Senior Manager |
| SEO | Senior Executive Officer |
| HEO | Higher Executive Officer |
| EO | Executive Officer |
| AO | Administrative Officer |
| AA | Administrative Assistant |
11. Annex B - Tests of Independenceof Diversity Statistics
The table below shows whether there is a significant result when Chi-squared tests for independence was carried out (indicated by Y); or whether the factors were found to be independent (indicated by N). Some relationships could not be tested because there would not be sufficiently large expected values for each group to support the use of Chi-square.
| Age | Disability | Ethnicity | Sex | Religion | Sexual Orientation | Socio-Economic: School | Socio-Economic: Parental Qual. | Working Pattern | |
|---|---|---|---|---|---|---|---|---|---|
| Profession | Y | Y | Y | Y | Y | N | Y | N | Y |
| Inspector Grade | Y | N | N | Y | |||||
| Other Professional Grade | Y | Y | N | N |
12. Annex C - Regression Variables and Percentage Changes
Note that the values, lower confidence intervals, and upper confidence intervals have been rounded to two decimal places. The p-values have been rounded to four decimal places, so any values appearing as 0 doesn’t necessarily indicate the true value is 0. Any statistically significant variables at the 5% level have been marked with a triple asterisk.
Table for the non-grade-controlled model. R-Squared of 0.35
| Variable | Value | Lower Confidence Interval (95%) | Upper Confidence Interval (95%) | P Value | Significant (5% level) |
|---|---|---|---|---|---|
| const | 23970.36 | 19251 | 29846.66 | 0 | *** |
| fte | -0.03 | -0.18 | 0.12 | 0.6988 | |
| years_in_pins | -1.25 | -1.53 | -0.97 | 0 | *** |
| age_of_employee | 1.78 | 1.53 | 2.02 | 0 | *** |
| sex_Female | -12.59 | -16.57 | -8.42 | 0 | *** |
| disability_DISABLED | -14.85 | -22.69 | -6.22 | 0.0011 | *** |
| disability_Unknown | 0.87 | -7.39 | 9.86 | 0.8425 | |
| ethnicity_BME | -15.11 | -24.71 | -4.28 | 0.0075 | *** |
| ethnicity_Unknown | 21.73 | 9.34 | 35.51 | 0.0003 | *** |
| religion_Christian | 4.5 | -1.12 | 10.45 | 0.1182 | |
| religion_Other Religion | 7.64 | -9.05 | 27.39 | 0.3913 | |
| religion_Unknown | -13.61 | -21.7 | -4.68 | 0.0036 | *** |
| sexual_orientation_LGB | 1.75 | -10.42 | 15.58 | 0.7891 | |
| sexual_orientation_Unknown | -6.92 | -15.67 | 2.75 | 0.1548 | |
| school_group_Independent | 0.06 | -9.27 | 10.35 | 0.9905 | |
| school_group_Other (including outside uk) | -5.38 | -16.64 | 7.41 | 0.3925 | |
| school_group_State run - selective | 2.17 | -4.37 | 9.17 | 0.524 | |
| school_group_Unknown | 2.86 | -6.61 | 13.29 | 0.5669 | |
| highest_parent_qual_At least degree | 5.52 | -2.85 | 14.62 | 0.2023 | |
| highest_parent_qual_Qualification below degree | 2.35 | -5.56 | 10.93 | 0.5707 | |
| highest_parent_qual_Unknown | -11.72 | -20.2 | -2.34 | 0.0156 | *** |
Table for the grade-controlled model. R-Squared of 0.99.
| Variable | Value | Lower Confidence Interval (95%) | Upper Confidence Interval (95%) | P Value | Significant (5% level) |
|---|---|---|---|---|---|
| const | 20533.14 | 19774.52 | 21320.87 | 0 | *** |
| fte | -0.04 | -0.05 | -0.02 | 0 | *** |
| years_in_pins | 0.13 | 0.09 | 0.16 | 0 | *** |
| age_of_employee | 0.03 | 0 | 0.06 | 0.0412 | *** |
| grade_AO | 10.32 | 7.11 | 13.63 | 0 | *** |
| grade_APO | 66.09 | 60.28 | 72.1 | 0 | *** |
| grade_APP AO | -5.61 | -9.07 | -2.03 | 0.0024 | *** |
| grade_APP EO | 13.51 | 5.22 | 22.46 | 0.0011 | *** |
| grade_APP HEO | 42.41 | 37.12 | 47.91 | 0 | *** |
| grade_BAND 1 | 130.07 | 123.36 | 136.98 | 0 | *** |
| grade_BAND 2 | 196.79 | 188.13 | 205.7 | 0 | *** |
| grade_BAND 3 | 258.27 | 247.83 | 269.02 | 0 | *** |
| grade_EO | 32.14 | 28.24 | 36.16 | 0 | *** |
| grade_G6 | 234.37 | 222.13 | 247.07 | 0 | *** |
| grade_G7 | 175.04 | 166.61 | 183.75 | 0 | *** |
| grade_HEO | 66.05 | 61.15 | 71.1 | 0 | *** |
| grade_PL | 300.26 | 284.25 | 316.94 | 0 | *** |
| grade_SCSPB1 | 299.93 | 283.93 | 316.61 | 0 | *** |
| grade_SCSPB2 | 521.61 | 475.82 | 571.04 | 0 | *** |
| grade_SEO | 104.9 | 98.72 | 111.27 | 0 | *** |
| sex_Female | -0.91 | -1.4 | -0.42 | 0.0003 | *** |
| disability_DISABLED | 0.78 | -0.24 | 1.81 | 0.1352 | |
| disability_Unknown | 0.38 | -0.51 | 1.28 | 0.4046 | |
| ethnicity_BME | -0.26 | -1.5 | 1.01 | 0.6891 | |
| ethnicity_Unknown | -0.8 | -1.91 | 0.33 | 0.1645 | |
| religion_Christian | 0.15 | -0.43 | 0.73 | 0.6103 | |
| religion_Other Religion | 1.47 | -0.3 | 3.27 | 0.1042 | |
| religion_Unknown | -0.5 | -1.52 | 0.53 | 0.3391 | |
| sexual_orientation_LGB | -0.04 | -1.36 | 1.29 | 0.9517 | |
| sexual_orientation_Unknown | 0.66 | -0.38 | 1.7 | 0.213 | |
| school_group_Independent | -0.16 | -1.18 | 0.86 | 0.7524 | |
| school_group_Other (including outside uk) | 0.32 | -0.99 | 1.66 | 0.6307 | |
| school_group_State run - selective | 0.29 | -0.4 | 0.98 | 0.4117 | |
| school_group_Unknown | 0.55 | -0.46 | 1.58 | 0.2867 | |
| highest_parent_qual_At least degree | 0.14 | -0.72 | 1.02 | 0.7438 | |
| highest_parent_qual_Qualification below degree | 0.12 | -0.72 | 0.97 | 0.7746 | |
| highest_parent_qual_Unknown | -0.13 | -1.18 | 0.94 | 0.8124 |