Personal Incomes Statistics 2019 to 2020: Summary Statistics
Published 16 March 2022

© Crown copyright 2022
This publication is licensed under the terms of the Open Government Licence v3.0 except where otherwise stated. To view this licence, visit nationalarchives.gov.uk/doc/open-government-licence/version/3 or write to the Information Policy Team, The National Archives, Kew, London TW9 4DU, or email: psi@nationalarchives.gov.uk.
Where we have identified any third party copyright information you will need to obtain permission from the copyright holders concerned.
This publication is available at https://www.gov.uk/government/statistics/personal-incomes-statistics-for-the-tax-year-2019-to-2020/personal-incomes-statistics-2019-to-2020-summary-statistics
Throughout this summary, individual figures have been rounded independently to three significant figures. Therefore, the sum of component items may not necessarily add to the totals shown.
1. Taxpayer numbers
-
there were 31.5 million taxpayers in the tax year 2019 to 2020, of those 17.9 million were male and 13.5 million female (Table 3.2 and Table 3.3)
-
this represents a decrease of 200,000 taxpayers since the 2018 to 2019 tax year
-
the number of male taxpayers decreased by 0.8%, while the number of female taxpayers is about the same
2. Total Income Breakdown
-
the total income before tax received by taxpayers in the tax year 2019 to 2020 was £1,160 billion (Table 3.3)
-
this is 3.3% higher than the total income reported in the previous tax year
Figure 2.1: Amount of income in the tax year ending 2020 and percentage change since tax year ending 2019 (Table 3.5 and Table 3.6)
| Type of income | Amount of income in billions | Percentage change since 2019 |
|---|---|---|
| Self-employment | £87 | +3.3% |
| Employment | £814 | +3.5% |
| Pension | £157 | +1.6% |
| Property, interest, dividend and other | £97 | +4.8% |
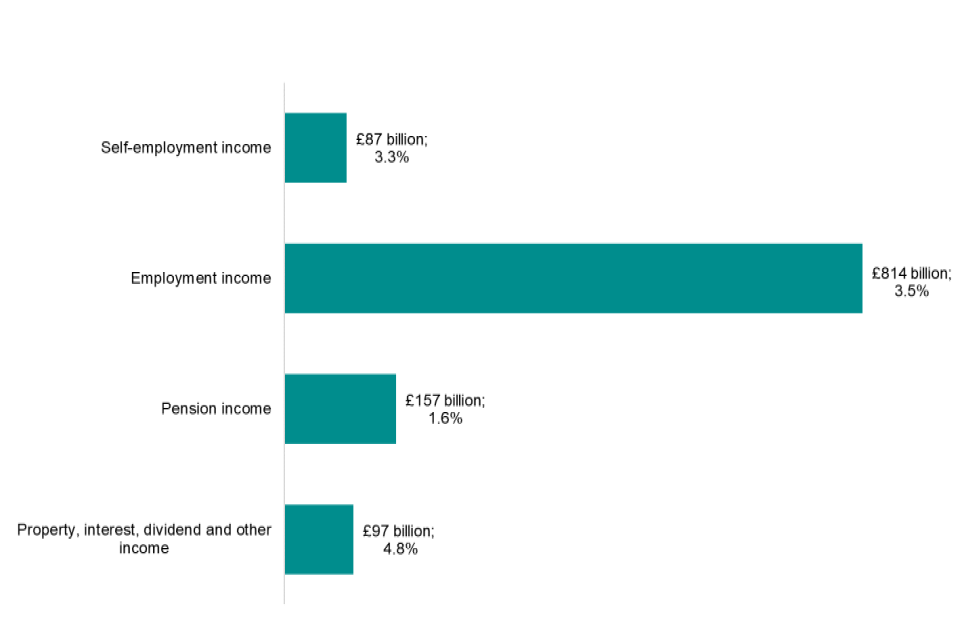
Bar chart showing amount of income in the tax year ending 2020 and percentage change since tax year ending 2019
Figure 2.2: Proportion of income by type
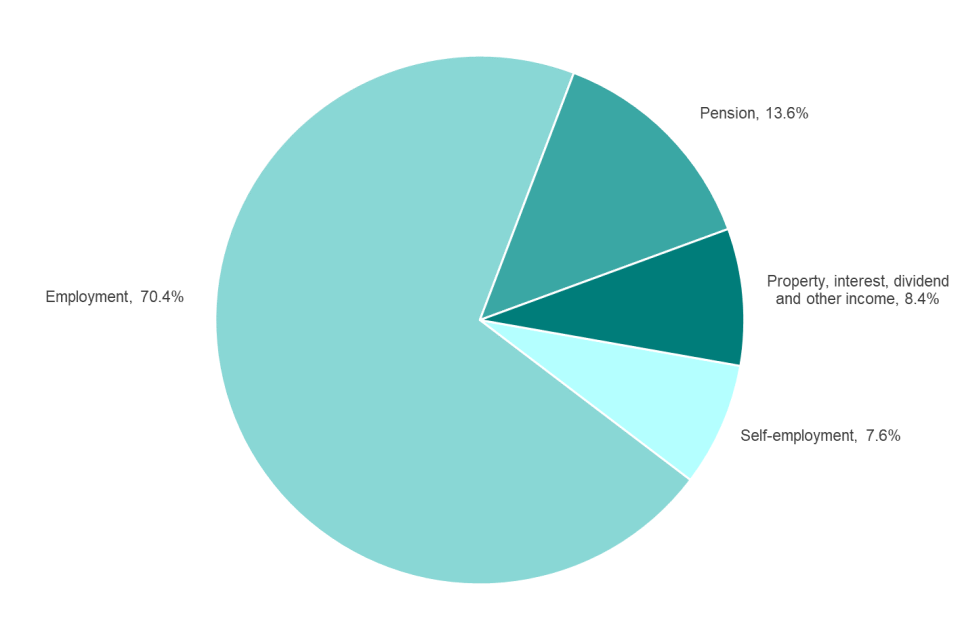
Pie chart showing proportion of income by type
-
there were increases in all types of income over the tax year 2019 to 2020, with increases of 3.3% for self-employment income, 3.5% for employment income, 1.6% for pension income and 4.8% for property, interest, dividend and other income (Table 3.5 and Table 3.6)
- self-employment income accounts for the smallest proportion of total income at 7.6%
- employment income accounts for the largest proportion of total income at 70.4%
- pension income is 13.6% of total income
- property, interest, dividend and other income is 8.4% of the total income
3. Income Tax liabilities breakdown by tax rate
-
Income Tax liabilities for tax year 2019 to 2020 were £189 billion (Table 3.4)
-
total Income Tax liabilities increased by around £2.5 billion (1.4%) compared to the previous tax year
| Tax rate | Number in millions | Percentage of taxpayers | Percentage of total tax |
|---|---|---|---|
| Basic rate | 26.5 | 84% | 34.3% |
| Higher rate | 3.8 | 12% | 33.0% |
| Additional rate | 0.4 | 1% | 32.2% |
| Savers rate | 0.7 | 2% | 0.5% |
Figure 3.1: The breakdown of Income Tax by the number of taxpayers and estimated tax liability for each marginal rate of tax
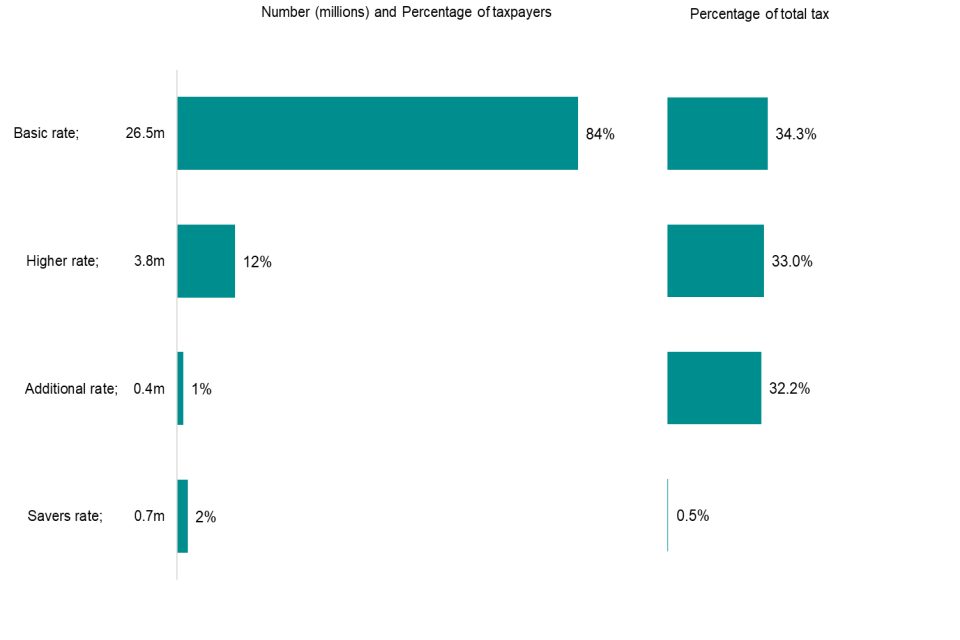
Bar chart showing the breakdown of Income Tax by the number of taxpayers and estimated tax liability for each marginal rate of tax
-
there were 26.5 million basic rate taxpayers who accounted for 84% of taxpayers and 34.3% of total tax
-
there were 3.8 million higher rate taxpayers who accounted for 12% of taxpayers and 33.0% of total tax
-
there were 0.4 million additional rate taxpayers who accounted for 1% of taxpayers and 32.2% of total tax
-
there were 0.7 million savers rate taxpayers who accounted for 2% of taxpayers and 0.5% of total tax
4. Total Income by Region/Country
-
the region with the highest number of taxpayers was again the South East region with around 4.6 million (15%) of the total figure
-
the region with the highest amount of total income was London, which saw an increase of around £6 billion since the tax year ending 2019 and reached £219 billion, however its share of total income remains unchanged at 19% (Table 3.11)
Figure 4.1: Type of Income by Region/Country
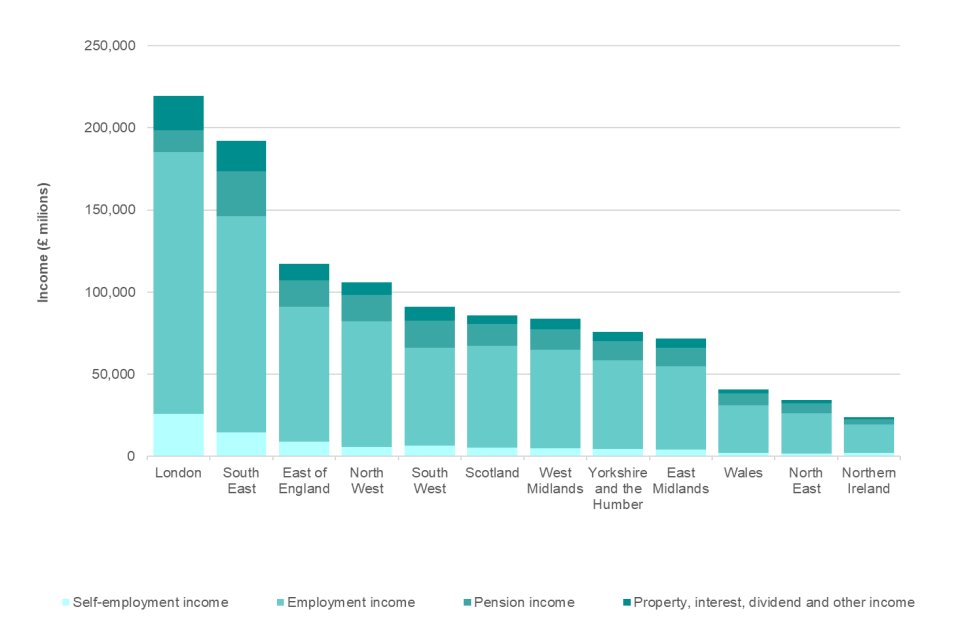
Column chart showing type of Income by Region/Country