Private pension statistics commentary: July 2026
Updated 30 July 2026

© Crown copyright 2026
This publication is licensed under the terms of the Open Government Licence v3.0 except where otherwise stated. To view this licence, visit nationalarchives.gov.uk/doc/open-government-licence/version/3 or write to the Information Policy Team, The National Archives, Kew, London TW9 4DU, or email: psi@nationalarchives.gov.uk.
Where we have identified any third party copyright information you will need to obtain permission from the copyright holders concerned.
This publication is available at https://www.gov.uk/government/statistics/personal-and-stakeholder-pensions-statistics/private-pension-statistics-commentary
This publication is the annual update of HMRC’s Private pension statistics. This commentary presents information from Tables 2, 6, 7 and 9, providing detailed statistics on the most recent data on personal pensions, annual allowance breaches, taxable flexible pension payments and the estimated cost of pension Income Tax and National Insurance contribution relief.
Most of the tables in this release include figures using new outturn data for 2024 to 2025.
1. Reported annual individual contributions to personal pension schemes
Table 2 includes individual contributions made to personal pensions and individual contributions made by self-employed members from 2013 to 2014 to 2024 to 2025. These figures include the basic rate relief claimed on these contributions.
From the September 2022 publication onwards, Table 2 no longer includes figures on employer contributions. This is because HMRC no longer requires schemes to report employer contributions. As a result, schemes reported a large decrease in employer contributions for 2020 to 2021.
When interpreting these figures, it is worth noting that members are concentrated among a small number of large schemes. Changes to these large schemes heavily influence the trends observed at an aggregated level. Schemes can amend their returns: therefore, this table can include revisions to historic years.
-
£15.9 billion of individual contributions were made to personal pensions in 2024 to 2025, up from £14.6 billion in 2023 to 2024
-
£3 billion of individual contributions were made by self-employed members in 2024 to 2025, up from £2.8 billion reported in 2023 to 2024
Chart 1: The value of individual contributions to personal pension schemes from 2014 to 2015 to 2024 to 2025
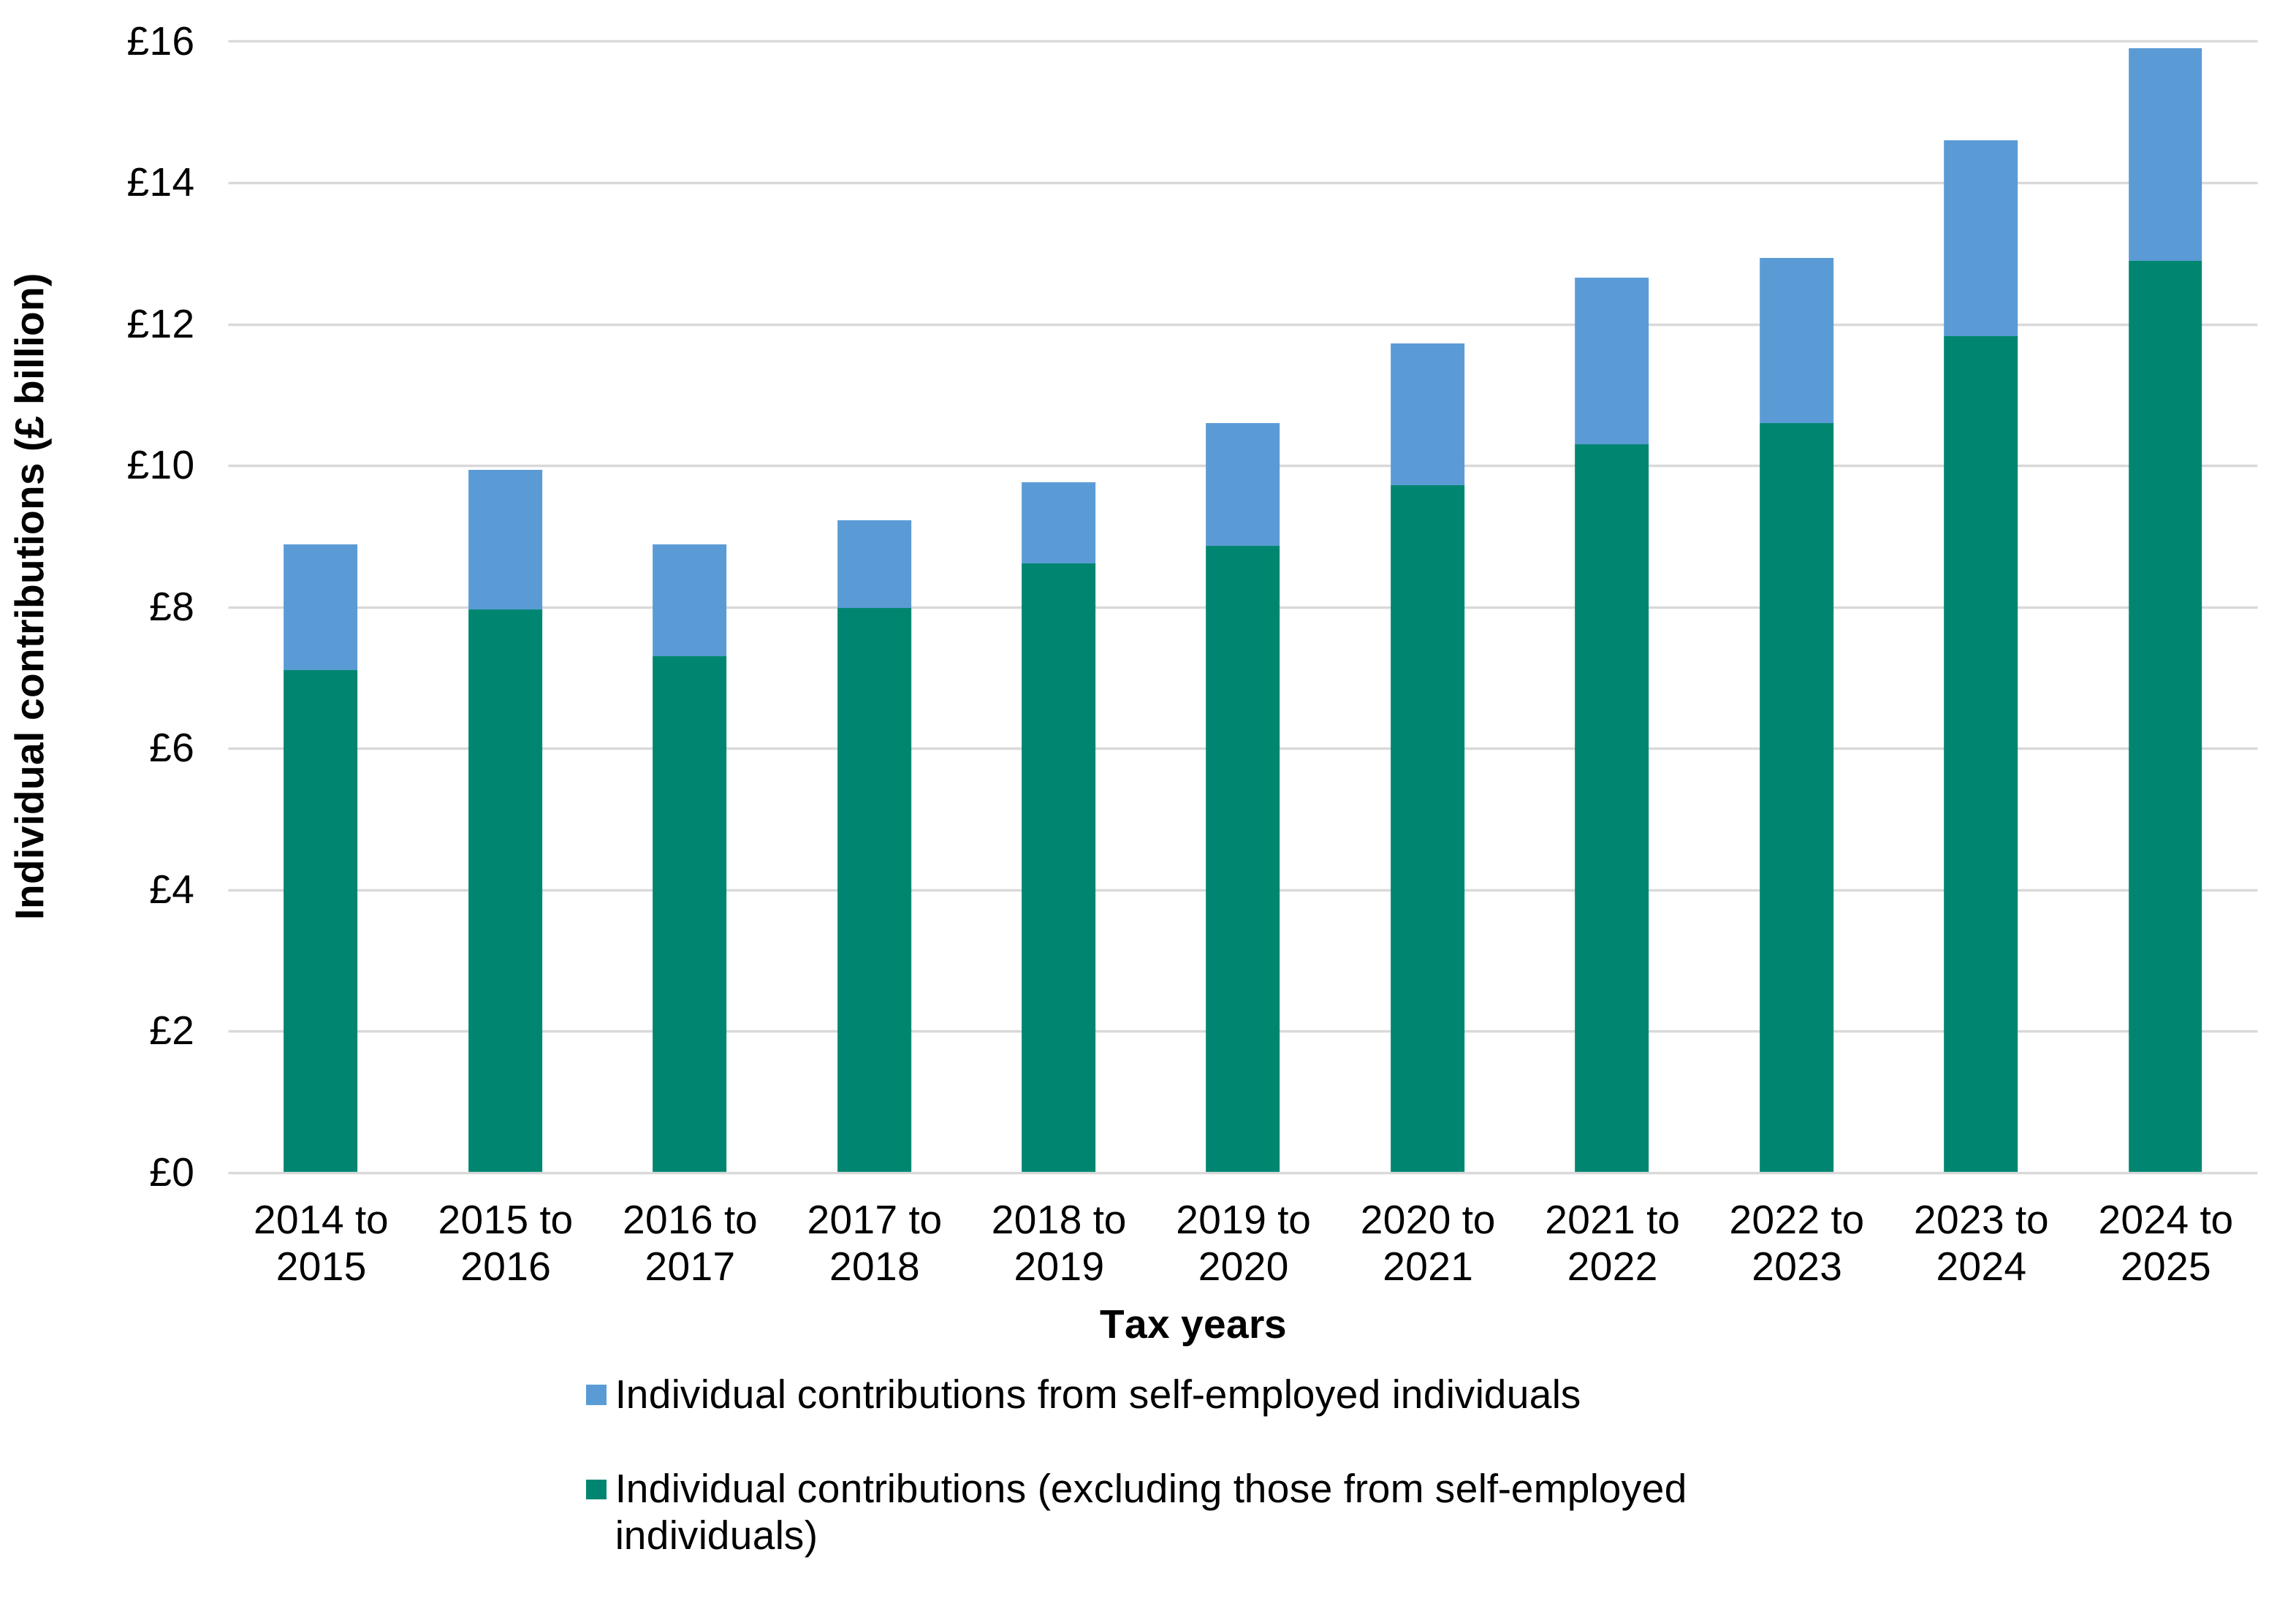
Chart 1 uses data from Table 2 and shows the value of individual contributions to personal pension schemes broadly increasing since 2014 to 2015. The value of individual contributions to personal pension schemes is the highest at £15.9 billion in 2024 to 2025, the most recent year in the chart. The chart also shows the value of individual contributions made by self-employed individuals from 2014 to 2015 to 2024 to 2025.
2. Reported number of members of personal pension schemes
Table 2 includes the number of members of personal pensions from 2013 to 2014 to 2024 to 2025. This table also includes the number of members who are self-employed. From 2018 to 2019 onwards member estimates only include those who have made individual contributions to personal pensions in the given tax year. Prior to this, estimates also included members who only had employer contributions made to their personal pensions or had no contributions in a given tax year.
-
the number of members making individual contributions to a personal pension has decreased to 6.4 million in 2024 to 2025 from 6.8 million in 2023 to 2024
-
the number of self-employed individuals making individual contributions to a personal pension has increased to 370,000 in 2024 to 2025 from 360,000 in 2023 to 2024
Chart 2: The number of members and average individual contributions made to personal pensions from 2013 to 2014 to 2024 to 2025
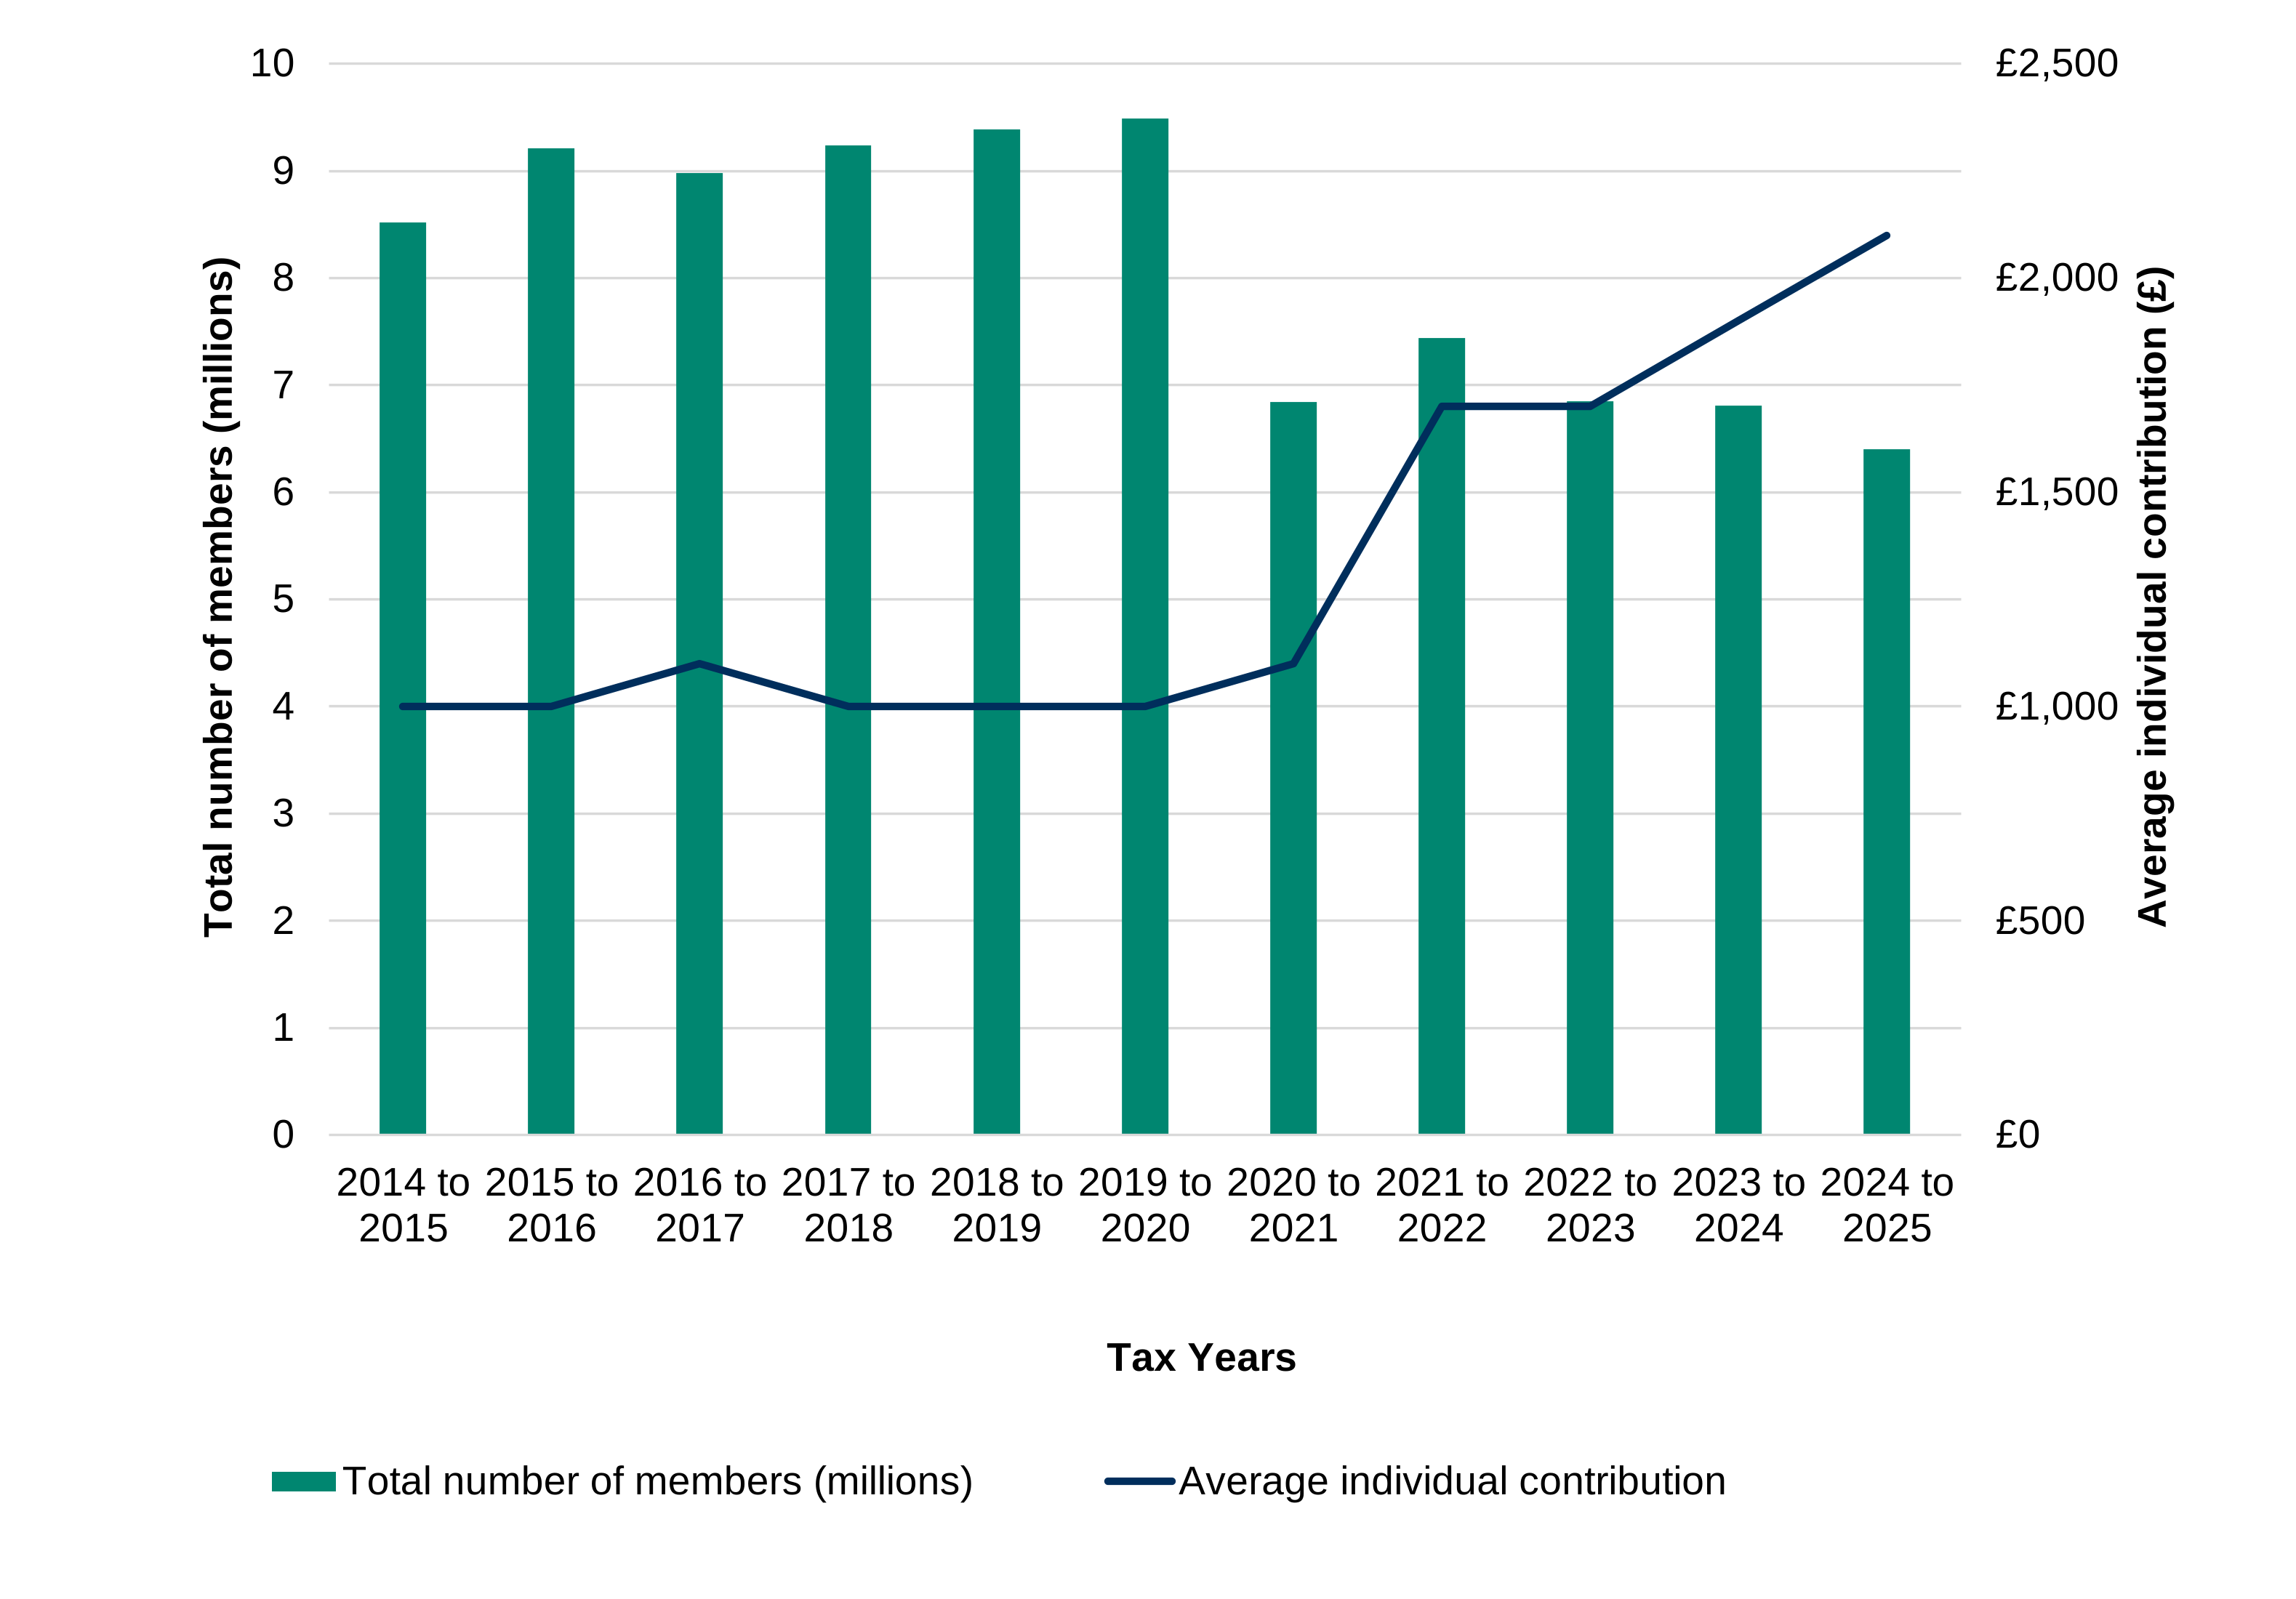
Chart 2 uses data from Table 2 and shows the number of members contributing to personal pensions (rounded to the nearest 10,000), and the average (mean) individual contribution to personal pensions (rounded to the nearest £100). The number of members has decreased over the last four tax years presented. From 2021 to 2022 to 2022 to 2023, the number fell by 8% from 7.44 million to 6.85 million. The number then fell by a further 1% to 6.81 million in 2023 to 2024. In 2024 to 2025, the number of members decreased by 6% to 6.4 million. Average contributions have increased for the last three tax years. Between 2021 to 2022 and 2022 to 2023, average contributions rose by 11% to £1,900 and then rose by 13% to £2,100 in 2023 to 2024. In 2024 to 2025, average contributions have increased by 16%, peaking at £2,480.
3. The estimated cost of pension relief
Some of the figures in Table 6 for the tax years 2019 to 2020, 2020 to 2021, 2021 to 2022, 2022 to 2023, and 2023 to 2024 have been revised to include improvements to the methodology and the most recent outturn data available. More information on these revisions can be found in the Background and methodology.
3.1 Estimated cost of pension Income Tax and National Insurance contribution (NIC) relief
Table 6 includes an estimate of gross and net pension Income Tax and NICs relief and the elements used to calculate this for tax years 2019 to 2020 to 2024 to 2025. Gross pension Income Tax and NICs relief includes estimates of Income Tax relief on total contributions to registered private pension schemes, Income Tax relief on investment income of pension funds, and Class 1 primary and secondary NICs on employer contributions. Net relief is estimated by calculating gross relief less Income Tax on pensions in payment, annual allowance charges, and lifetime allowance charges.
-
gross pension Income Tax and NICs relief in 2024 to 2025 is estimated to be £83.9 billion, up from £79 billion in 2023 to 2024
-
Class 1 Primary and Class 1 Secondary National Insurance contributions (NICs) relief on employer contributions (including those made via salary sacrifice) is estimated to be £23.5 billion in 2024 to 2025, down from £24.2 billion in 2023 to 2024
-
Income Tax paid on payments from registered private pensions is reported to be £30.1 billion in 2024 to 2025, up from £25.6 billion in 2023 to 2024
-
the estimated net cost of pension Income Tax and NICs relief is estimated to be £53.8 billion in 2024 to 2025, up from £53.4 billion in 2023 to 2024
Chart 3: Estimated gross and net pension Income Tax and NIC relief, 2019 to 2020 to 2024 to 2025, £ billions.
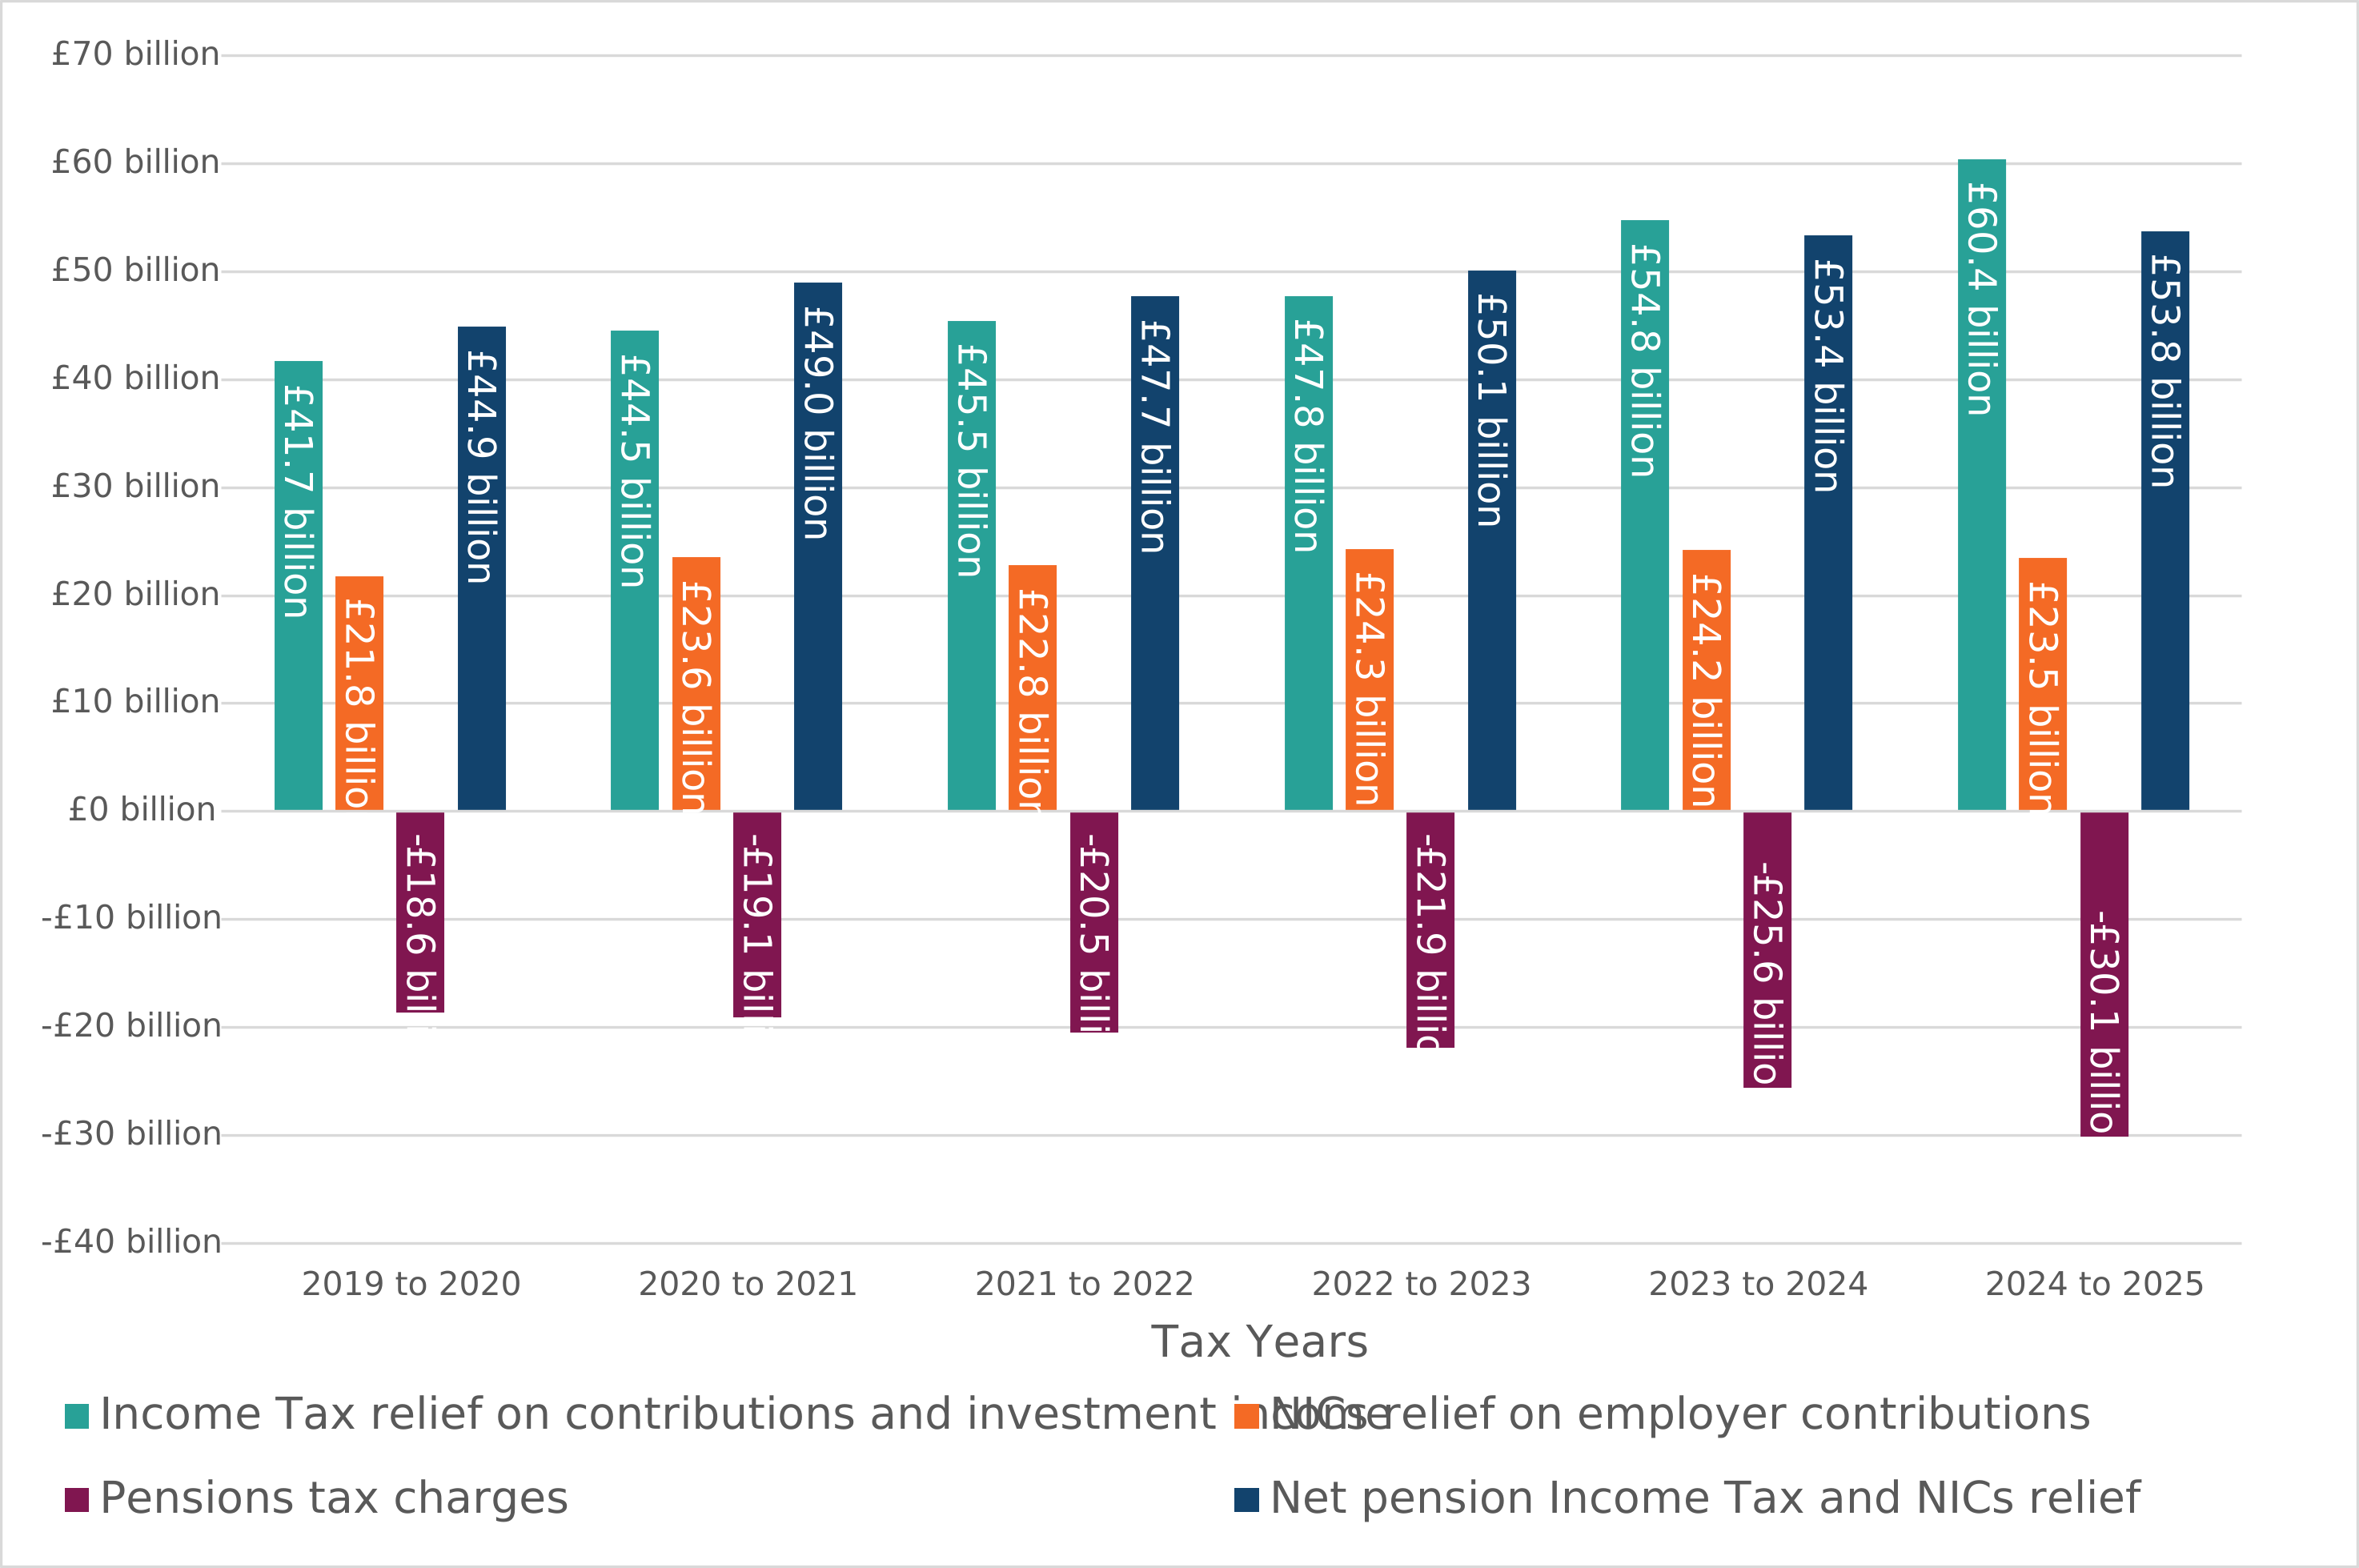
Chart 3 uses data from Table 6 and shows gross Income Tax relief, NIC relief, pension tax charges and net Income Tax and NIC relief for 2019 to 2020 up to 2024 to 2025. Net Income Tax and NIC relief is £53.8 billion in 2024 to 2025.
Chart 4: The estimated proportion of Income Tax relief on pension contributions and investment income in 2024 to 2025, £ billions.
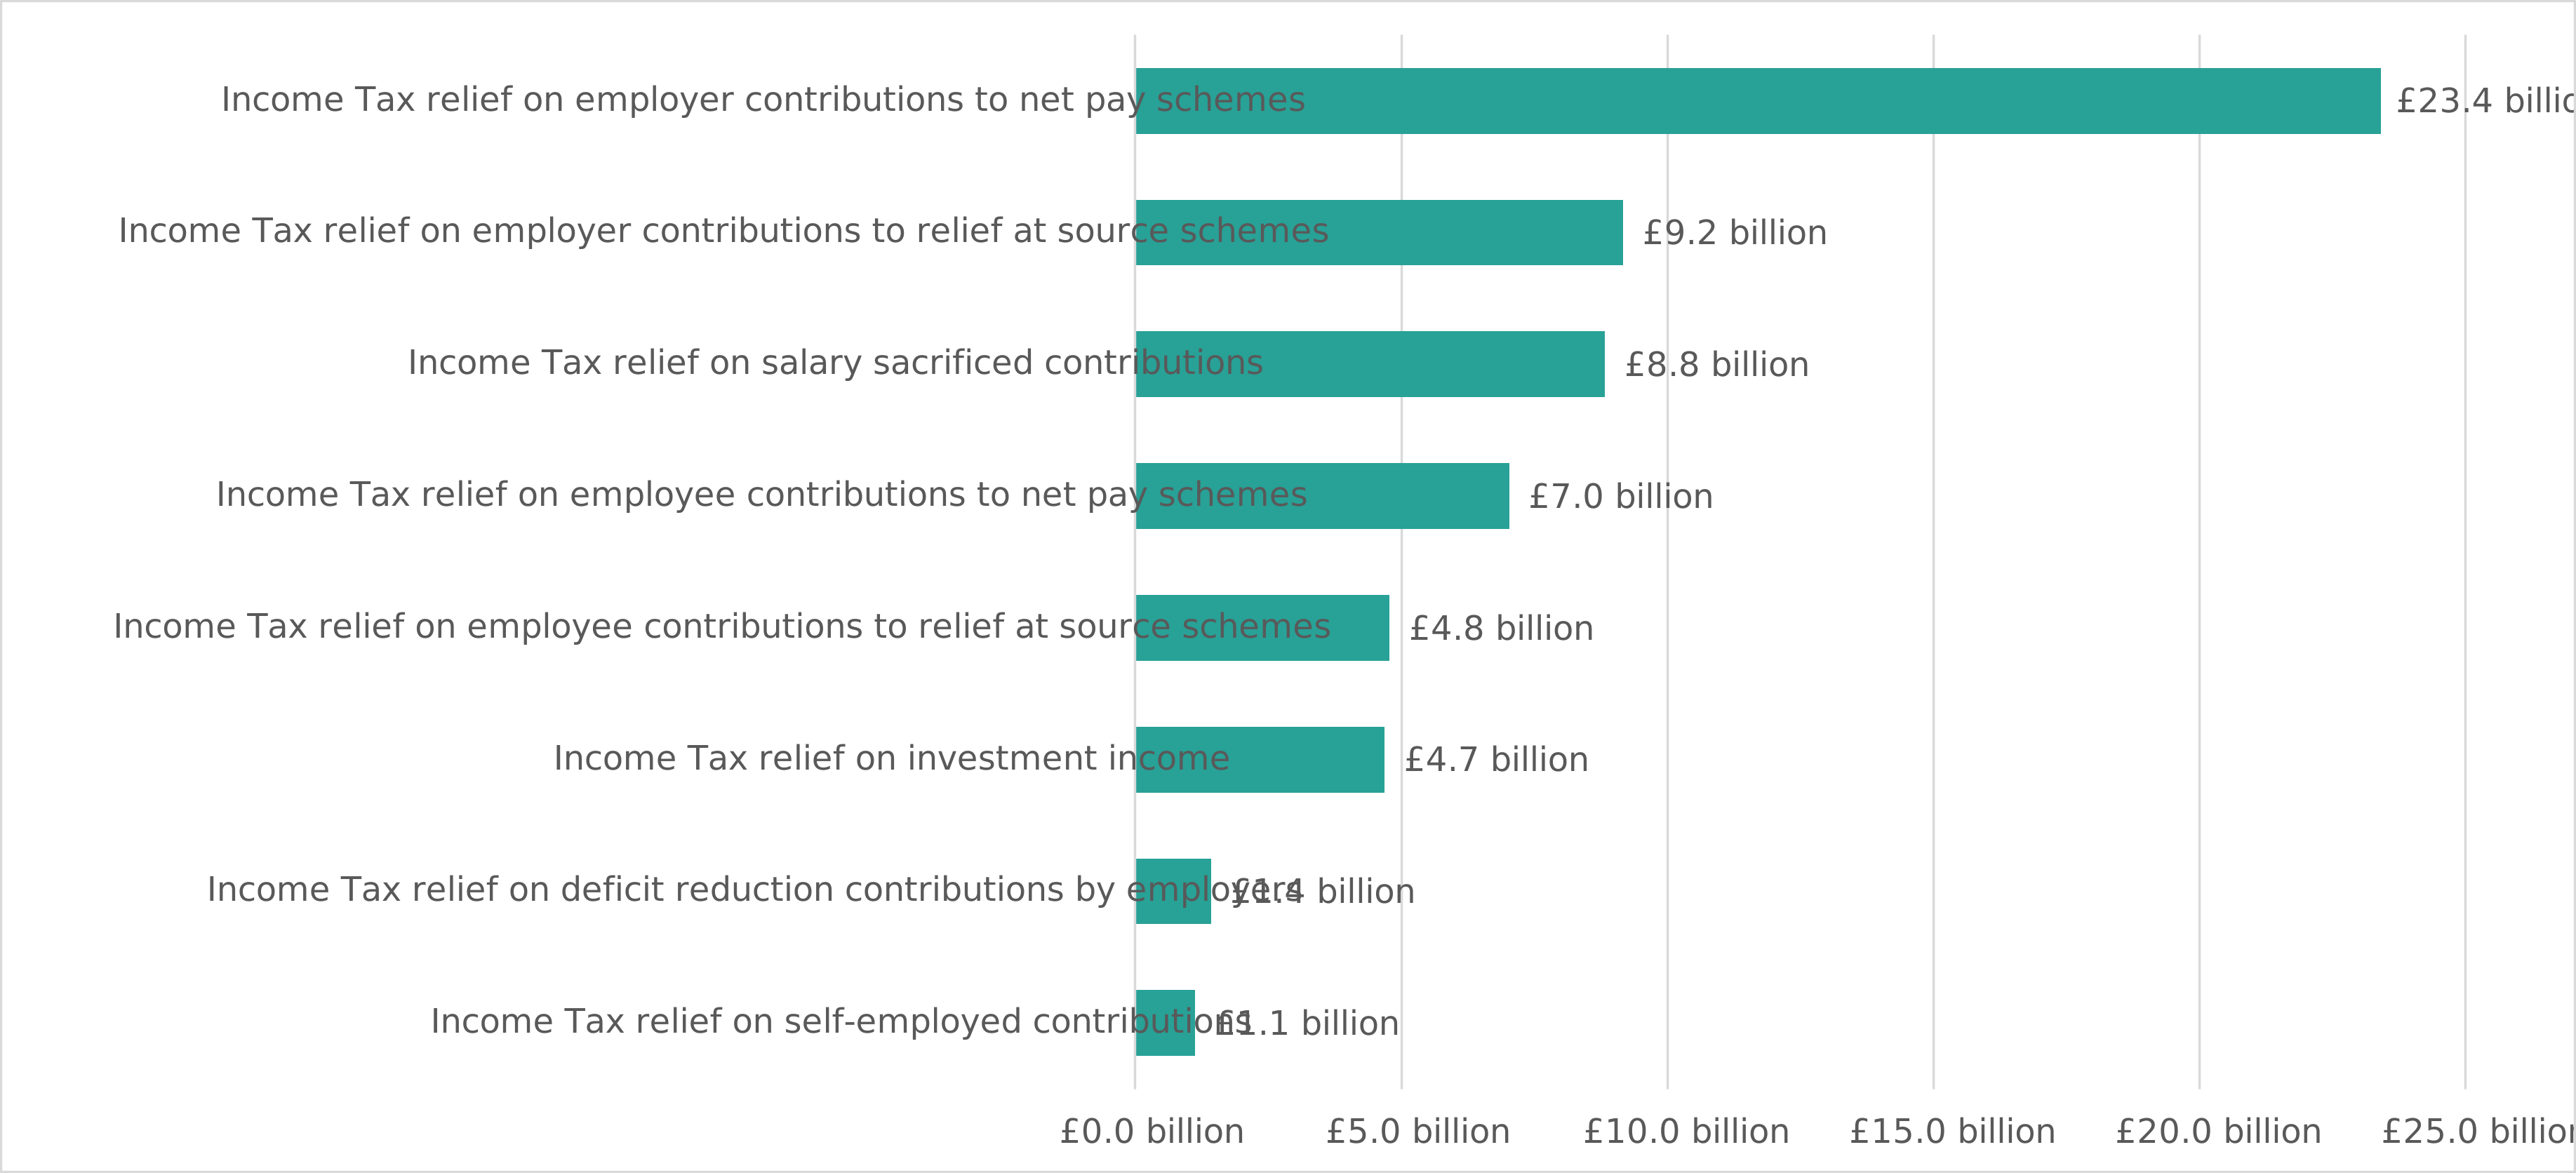
Chart 4 uses data from Table 6 and shows the split of Income Tax relief on pension contributions and investment income by the type of contribution for 2024 to 2025. Income Tax relief on employer contributions to net pay schemes is the largest type of Income Tax relief at £23.4 billion. Income Tax relief on self-employed contributions is the smallest type of Income Tax relief at £1.1 billion.
3.2 Pension Income Tax relief split by sector, scheme type and rate of relief
Table 6.1 includes the estimated Income Tax relief on individual and employer contributions split by relief mechanism, sector, scheme type and marginal tax rate.
-
in 2024 to 2025 65% of Income Tax relief on total pension contributions is estimated to be relieved on contributions to personal or private sector occupational schemes
-
in 2024 to 2025 58% of Income Tax relief on total pension contributions is estimated to be relieved on contributions to defined contribution schemes
Chart 5: The estimated proportion of Income Tax relief on total pension contributions in 2024 to 2025 by the rate of relief
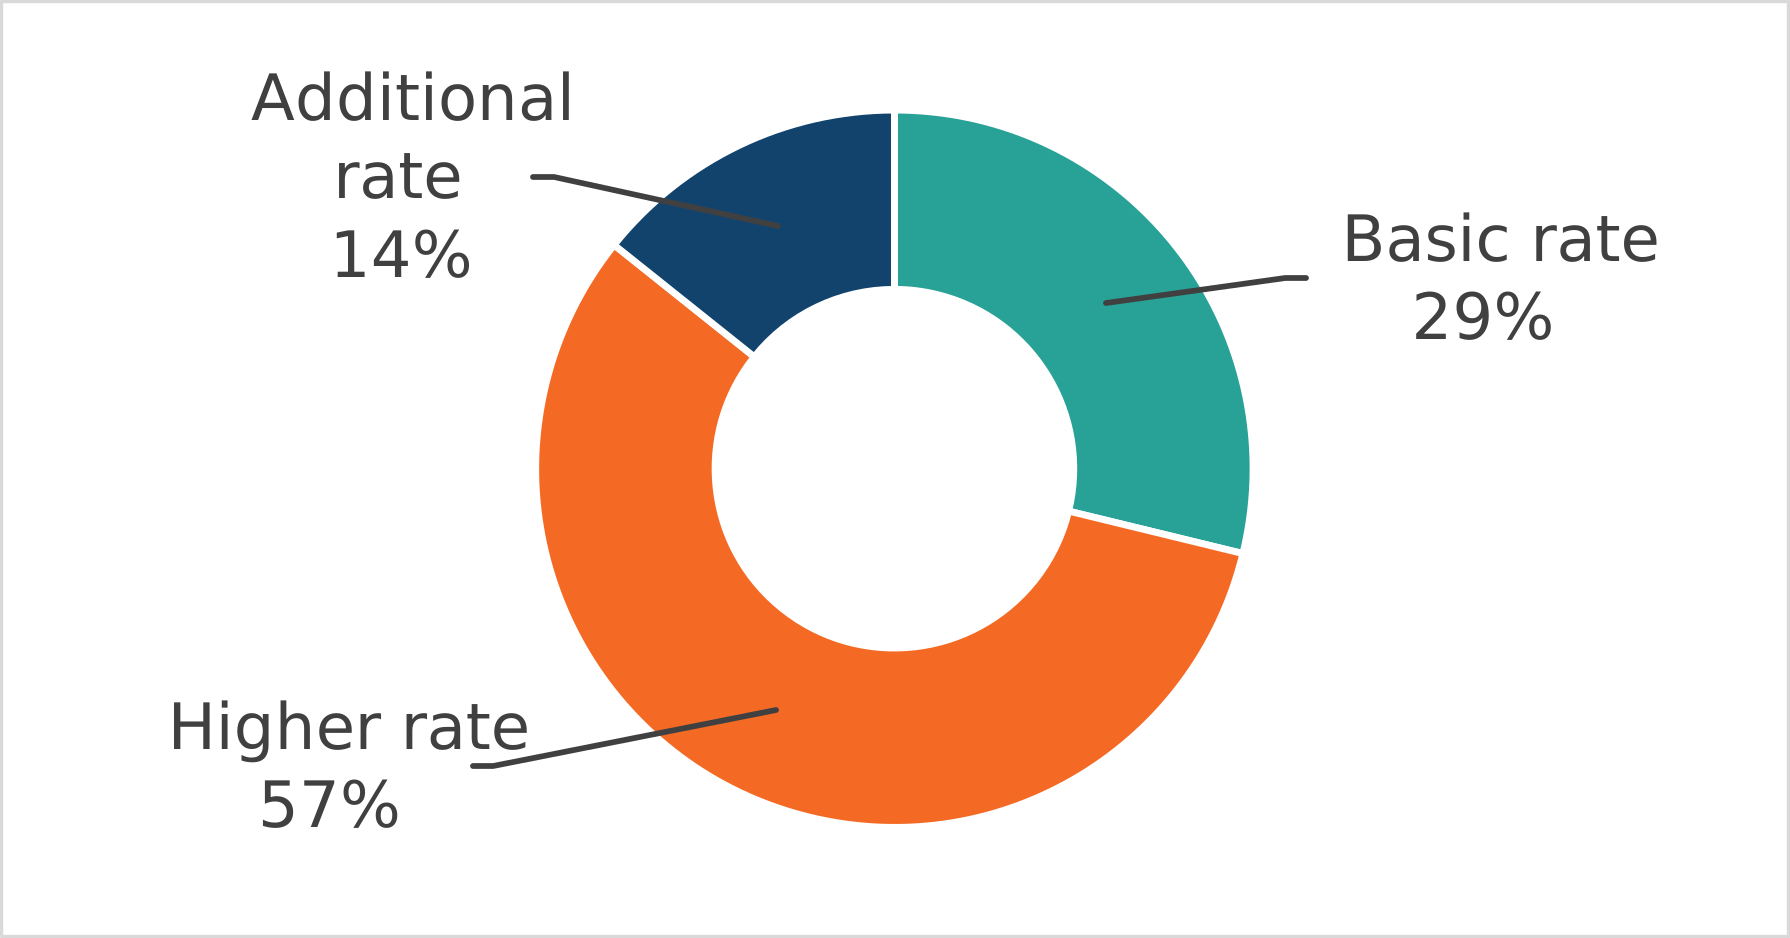
Chart 5 presents information from Table 6.1 of the statistics showing that in 2024 to 2025 it is estimated that 14% of Income Tax relief on total pension contributions was relieved at the additional rate of Income Tax, 57% at the higher rate, and 29% at the basic rate.
3.3 Pension National Insurance contribution (NIC) relief split by sector, scheme type and rate of relief
Table 6.2 includes the estimated Class 1 primary (C1P) and Class 1 secondary (C1S) NIC relief on employer contributions, including salary sacrificed contributions, split by relief mechanism, sector, scheme type and marginal NIC rate.
C1P NICs relief on employer contributions:
-
in 2024 to 2025 44% of C1P NICs relief on employer contributions is estimated to be relieved on contributions to personal or private sector occupational schemes
-
in 2024 to 2025 53% of C1P NICs relief on employer contributions is estimated to be relieved on contributions to defined contribution schemes
-
in 2024 to 2025 75% of C1P NICs relief on employer contributions are estimated to be relieved at the primary threshold rate and 25% at the upper earnings limit rate
C1S NICs relief on employer contributions:
-
in 2024 to 2025 62% of C1S NICs relief on employer contributions is estimated to be relieved on contributions to personal or occupational schemes in the private sector
-
in 2024 to 2025 56% of C1S NICs relief on employer contributions is estimated to be relieved on contributions to defined contribution schemes
4. Annual allowance
Table 7 includes the number of annual allowance (AA) charges reported to HMRC through Accounting for Tax (AfT) returns and Self Assessment (SA) returns. The table also includes the value of annual allowance charges reported through AfT, and the value of AA breaches (that is, the value of contributions in excess of the AA) reported through SA.
Excluding individuals who were affected by the public service pensions remedy (also known as McCloud – see below), all individuals are required to report contributions in excess of the AA through SA. This includes individuals who have used Scheme Pays (where the individual’s pension scheme pays some or all of the AA charge liability on the individual’s behalf, in return for an appropriate reduction in the individual’s pension benefits). However, not all individuals using Scheme Pays report through SA in practice. Individuals who have not used the Scheme Pays option, but have reported their breach through SA, will be included in the SA figures but not the AfT figures. There is also a lag between when AA charges are incurred and when they are reported in the AfT return. There are therefore differences between the AfT and SA figures. Furthermore, amendments have been made to the number and value of AA charges reported via both SA and AfT, therefore the figures published this year do not exactly match the figures published in previous years. This also means that figures published this year may be revised in future publications. Revisions may be particularly substantial for the 2024 to 2025 AfT figures as there have been delays in some public sector pension schemes, especially those implementing the McCloud remedy, and the deadline for reporting many 2024 to 2025 Scheme Pays cases is February 2027.
-
in 2024 to 2025, 30,440 individuals reported pension contributions exceeding their personalised AA through SA. This has increased from 24,950 individuals in 2023 to 2024
-
the total value of contributions in excess of the AA that were reported via SA was £672 million in 2024 to 2025. This has increased from £505 million in 2023 to 2024
HMRC published guidance titled Changes in your annual allowance following the public service pensions remedy for individuals affected by the public service pensions remedy (also known as McCloud). Affected individuals were instructed to report any annual allowance charges for the 2022 to 2023 tax year through the Calculate your public service pension scheme adjustment service, rather than through SA. As anticipated, as a significant number of AA charges come from public service scheme members, this contributed to a large year-on-year decline in the number and value of contributions in excess of the AA as reported by SA in the 2022 to 2023 tax year compared to the 2021 to 2022 tax year.
-
in 2024 to 2025, 15,250 AA charges were reported by schemes through AfT returns. This has decreased from 49,790 in 2023 to 2024
-
the total value of AA charges reported by schemes via AfT for tax year 2024 to 2025 was £164 million. This has decreased from £353 million reported in 2023 to 2024
Chart 6: Number of AA charges and value of pension contributions in excess of the AA reported through SA, 2006 to 2007 to 2024 to 2025
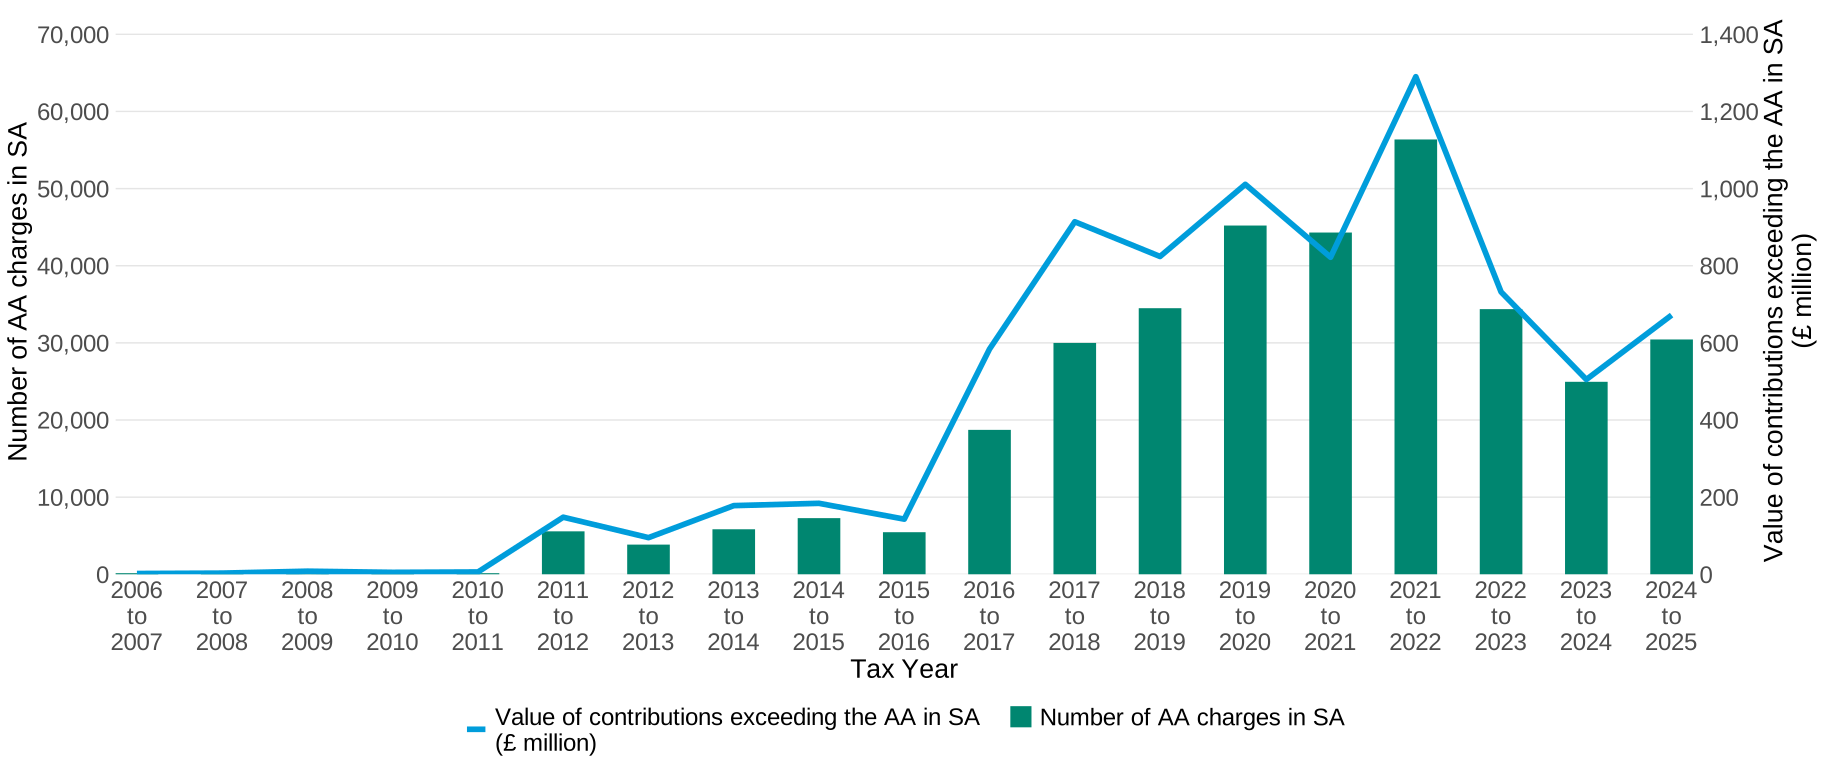
Chart 6 presents information from Table 7, showing the number of individuals reporting AA charges through SA, and the total value of contributions in excess of the AA reported through SA. Both the number of AA charges and value of contributions in excess of the AA increased between 2023 to 2024 and 2024 to 2025.
The number of individuals reporting AA charges through SA decreased by 27% between 2022 to 2023 and 2023 to 2024, while the value of contributions in excess of the AA decreased 31%. Between 2023 to 2024 and 2024 to 2025, the number of reporting individuals increased by 22%, and the total value of contributions above the AA increased by 33%.
Chart 7: Number of AA charges and value of AA charges reported through AfT, 2012 to 2013 to 2024 to 2025
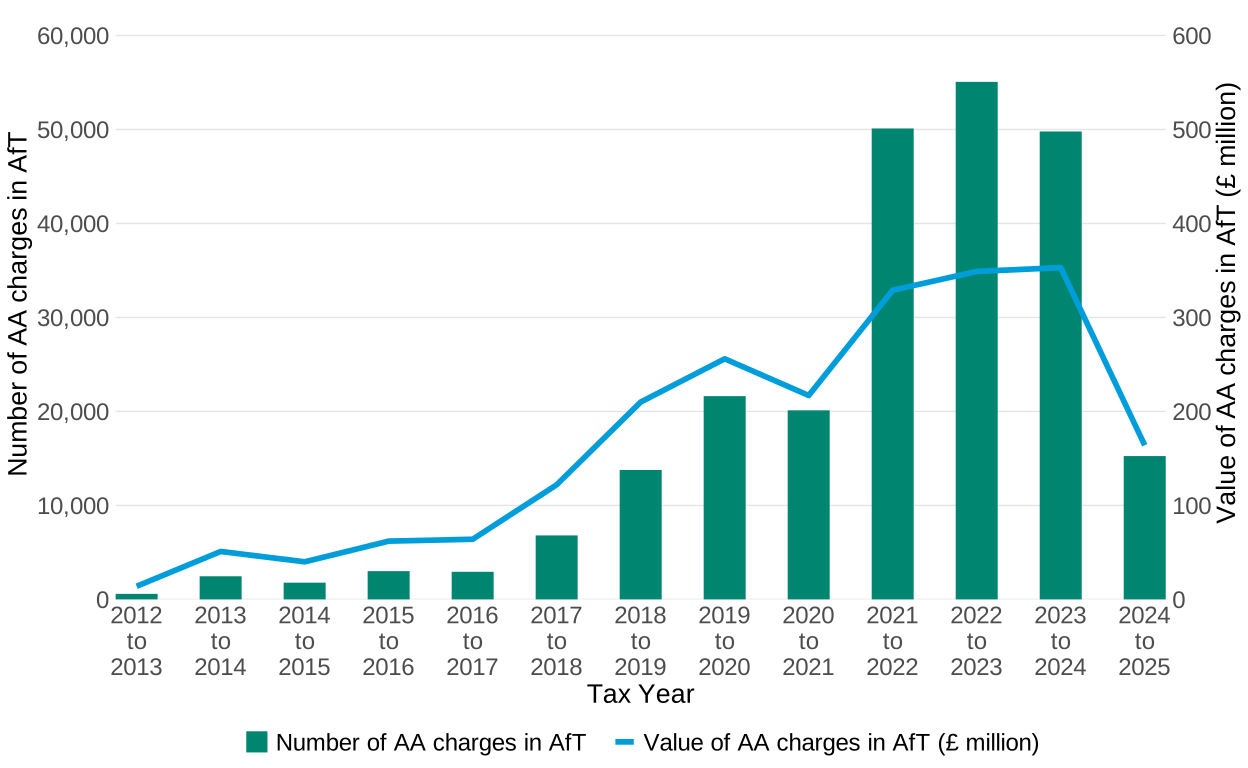
Chart 7 presents information from Table 7, showing the number and the value of AA charges as reported via AfT. Between 2023 to 2024 and 2024 to 2025, the number of AA charges reported through AfT decreased and the value of AA charges reported in AfT decreased.
The number of AA charges reported through AfT decreased by 10% between 2022 to 2023 and 2023 to 2024, while the value of AA charges increased by 1%. Between 2023 to 2024 and 2024 to 2025, the number of reported charges decreased by 69%, and the total value of AA charges decreased by 54%.
5. Pension flexibility
Figures provided on taxable flexible payments from pensions are not comparable to those published before September 2023 due to methodological improvements. More information can be found in the Background and Methodology.
Table 9 includes the value of taxable flexibly accessed pension payments, the number of payments and individuals taking payments by quarter and tax year from Q2 of 2015 to Q1 of 2026. Figures disaggregated by age and gender are also included. Non-taxable elements of flexibly accessed payments are not included in this table as it is optional for schemes to report these to HMRC
-
the total value of taxable payments withdrawn flexibly from pensions since flexibility changes were introduced in 2015 has exceeded £124.7 billion
-
in 2025 to 2026, £22.4 billion in taxable payments was withdrawn from pensions flexibly. This has increased from £18.6 billion in 2024 to 2025 and £15.3 billion in 2023 to 2024
-
between 1 January 2026 and 31 March 2026, £5.9 billion of taxable payments was withdrawn from pensions flexibly by 770,000 individuals across 1.9 million payments. The average taxable withdrawal per person was £7,700 in this period. There was an 18% increase in the value of payments withdrawn in this quarter compared to the same quarter in 2025, and a 15% increase in the number of individuals withdrawing
Chart 8: The reported value of taxable flexibly accessed payments and number of individuals accessing these payments by quarter from Q2 of 2017 to Q1 of 2026
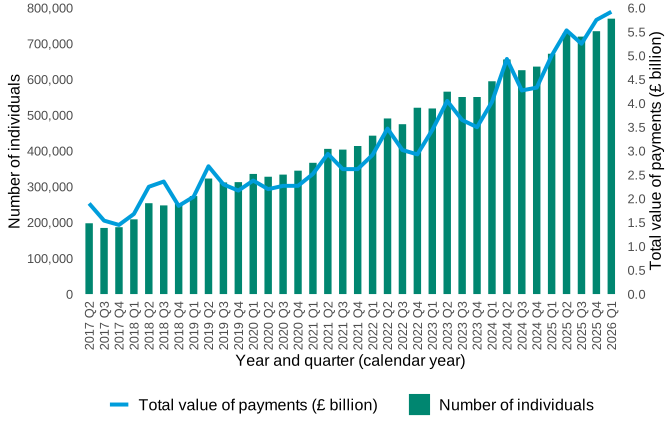
Chart 8 presents information from Table 9 of the statistics, showing that the reported value of taxable flexibly accessed pensions and number of individuals accessing these payments generally falls in Q3 and Q4 and rises in Q1 and Q2. The value of withdrawals in 2026 Q1 was £5.9 billion withdrawn by 770,000 individuals.
5.1 Taxable flexibly accessed pension payments, split by age
Table 9.1 includes the value of taxable flexibly accessed pension payments, the number of payments and individuals taking payments by quarter and tax year from Q2 of 2015 to Q1 of 2026, split by the age of the individual withdrawing flexibly.
- 42% of individuals who have received taxable flexible pension payments since flexibility changes were introduced in 2015 made their first withdrawal while aged 55-59. 27% were aged 60-64, and 20% were aged 65-69, at first withdrawal
Chart 9: The proportion of the reported value of taxable flexibly accessed payments paid to each age category by tax year from 2016 to 2017 to 2025 to 2026
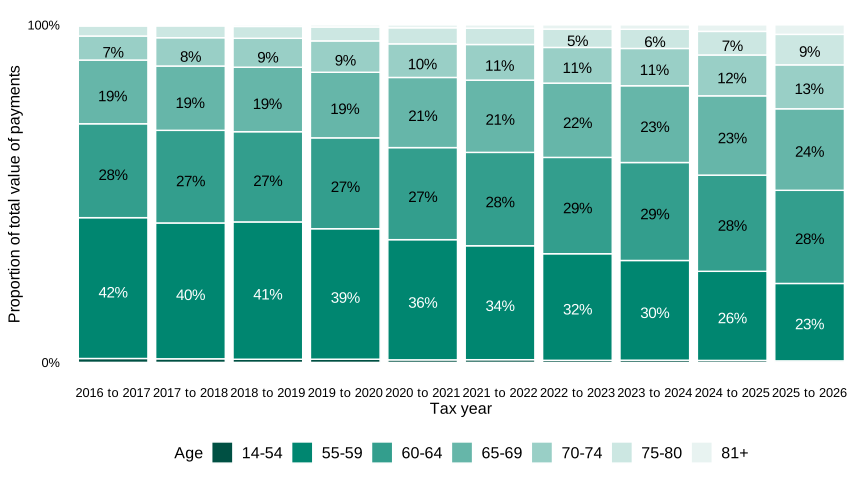
Chart 9 presents information from Table 9.1 of the statistics (Reported taxable flexible payments from pensions split by age), showing the proportion of the value of taxable flexible pension payments paid to different age cohorts. Note that labels have been suppressed for categories making up less than 5% of the total value of taxable flexible pension payments. The proportions paid to individuals in all cohorts aged 64 and below (14-54, 55-59, and 60-64) have decreased over time, while the proportions paid to individuals in all cohorts aged 65 and over (65-69, 70-74, 75-80, 81+) have increased.
In 2016 to 2017, 42% of the total value of taxable flexible pension payments was paid to individuals aged 55 to 59, and 29% was paid to those aged 65 and over. In 2025 to 2026, those proportions of the total value of taxable flexible pension payments were 23% for those aged 55 to 59, and 46% for those aged 65 and over.
5.2 Taxable flexibly accessed pension payments, split by gender
Table 9.2 includes the value of taxable flexibly accessed pension payments, the number of payments and individuals taking payments by quarter and tax year from Q2 of 2015 to Q1 of 2026, split by the gender of the individual receiving the payment.
- in 2025 to 2026, £5.5 billion in taxable payments was withdrawn from pensions flexibly by women (25% of the total value), and £16.9 billion in taxable payments was withdrawn from pensions flexibly by men (75% of the total value)
The statistical contacts for this publication are:
-
B Badaru
-
K Kumar
-
R Oakley-Brown
-
S Law
-
M Jennings
For press queries, please contact HMRC Press Office: news.desk@hmrc.gov.uk