Parental Conflict Indicator 2011 to 2022
Published 12 March 2025

© Crown copyright 2025
This publication is licensed under the terms of the Open Government Licence v3.0 except where otherwise stated. To view this licence, visit nationalarchives.gov.uk/doc/open-government-licence/version/3 or write to the Information Policy Team, The National Archives, Kew, London TW9 4DU, or email: psi@nationalarchives.gov.uk.
Where we have identified any third party copyright information you will need to obtain permission from the copyright holders concerned.
This publication is available at https://www.gov.uk/government/statistics/parental-conflict-indicator-2011-to-2022/parental-conflict-indicator-2011-to-2022
This publication is updated every two years (‘biennial’) in line with the availability of underlying data. However, this latest publication has been delayed from its intended publication date of March 2024. This is because the latest results indicate a change in the relationship distress measure, but some additional analysis we carried out suggested that this could have been caused by non-response bias. The publication was therefore delayed, allowing time for further analysis of the results and a general review of the methodology. The findings of this analysis have been explained in the relevant section of this release. Following the review, the methodology remains unchanged from previous publications.
Some previously reported figures have changed by a small amount in this latest release. This is because the underlying survey weights each response differently to ensure estimates are representative of the overall population, and these weights have been revised since the last release.
All results have been rounded to the nearest 1%.
1. Main Stories
10% of children in couple-parent families had at least one parent who reported relationship distress in the 2021 to 2022 survey period, compared with 12% in 2019 to 2020. However, these figures are calculated from survey data, and we do not believe there is yet sufficient evidence to confirm a reduction in the level of parental relationship distress in the general population.
56% of children in separated families see their non-resident parent regularly, according to the latest survey data gathered in 2021 to 2022. This measure has increased by 5 percentage points since 2015 to 2016. This is likely to represent a real increase in the level of non-resident parent contact amongst separated families.
2. What you need to know
Evidence shows that poor relationships between parents can damage children’s short-term and long-term wellbeing. Frequent, intense, and poorly resolved parental conflict can adversely affect their mental health, overall wellbeing, and future employment.
In 2017, Improving Lives: Helping Workless Families presented evidence demonstrating links between parental conflict and worklessness. This document also set out how the government, at that time, planned to address the root causes of worklessness, and how they planned to monitor and track progress using a set of national indicators.
This publication sets out the methodology underlying one of these indicators, the parental conflict indicator, and reports its latest results.
The parental conflict indicator comprises two measures:
-
the proportion of children in couple-parent families living with parents who report relationship distress; and
-
the proportion of children in separated families who see their non-resident parent regularly
Within couple-parent families, we measure the proportion of children in families where at least one of the adults is experiencing relationship distress, as evidence suggests this adversely affects child outcomes.
Where parents are separated, analysis of the available data on frequency of contact shows that regular contact between the child and their non-resident parent is a good indication of a better relationship between the parents.
The measure of the proportion of children in separated families who see their non-resident parent regularly is therefore used as a proxy for the existence of reasonable relations between parents.
Both measures are calculated from survey data which cover the United Kingdom.
3. Relationship distress in couple-parent families
Based on survey responses from 2021 to 2022, we estimate that 10% of children in couple-parent families were living with at least one parent reporting relationship distress. This compares to 12% in 2019 to 2020. This measure has previously been very stable.
The proportion of children in couple-parent families with at least one parent reporting relationship distress, 2011 to 2022
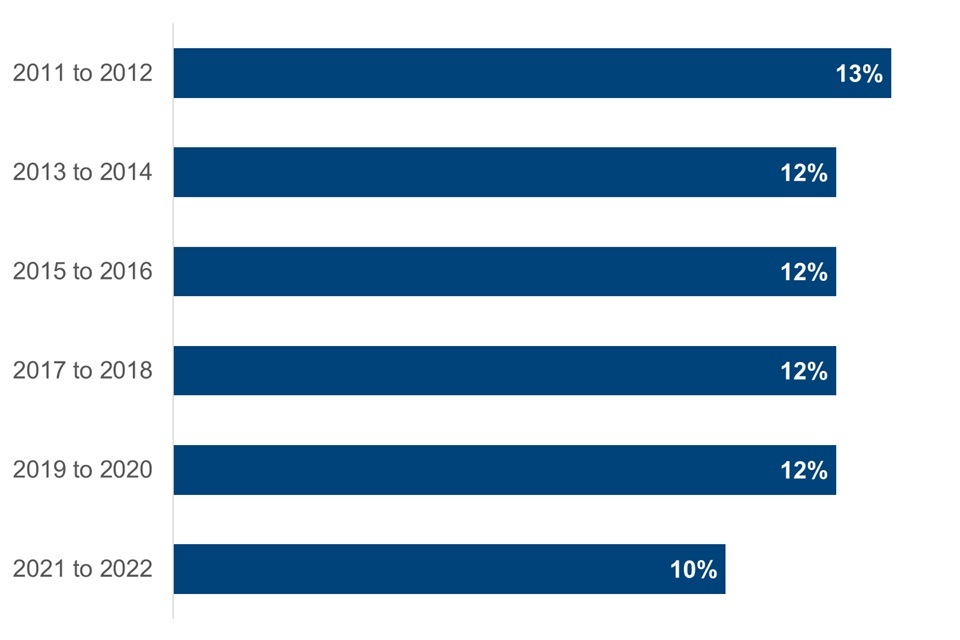
Source: Understanding Society survey, waves 3, 5, 7, 9, 11, and 13
We do not believe there is yet sufficient evidence to confirm a reduction in the level of parental relationship distress in the general population. This is because:
-
these figures are based on survey responses. Survey respondents are never exactly representative of the overall population. This means that that our estimate of the rate of relationship distress in the population will not be exact: this known as sampling error. Our analysis suggests that sampling error could plausibly explain all or most of the recent change
-
some of the reduction in reported relationship distress may also be explained by ‘attrition bias’. This is because our estimates are calculated from a survey which, in general, attempts to interview the same households for each wave of the survey. Our analysis of the survey data shows that those who reported relationship distress in a previous wave were less likely to respond in the next. This may, over time, reduce the proportion of cases in our sample which report relationship distress
Details and methodology
This measure was developed by Department for Work and Pensions (DWP) analysts using cross-sectional analysis of Understanding Society survey data. This means that we are looking at data which shows what is going on at that specific point of time (referred to as a ‘wave’ of data in the survey).
A couple-parent family is defined as a couple who live together (whether married, civil-partnered, or neither) plus any dependent children who live with them. We define a dependent child as a biological or adopted child of either or both partners, who is either under 16, or 16 to 18 and in non-advanced full-time education.
A couple-parent family is classified as experiencing relationship distress if either of the parents responds that, most or all the time, they consider divorce, regret living together, quarrel, or get on each other’s nerves (in response to questions asking about their relationship with their partner).
These questions were chosen from a wider set of relationship questions that were asked as part of the survey, as there was a stronger link between negative responses to these questions and other negative outcomes of interest.
Previous publications have also provided a breakdown of relationship distress in couple-parent families by employment status. This is no longer possible, as the size of the sample is now too small for us to produce comparable estimates of relationship distress for children in couple-parent families where both parents have reported that they are unemployed.
Further information about the development of the measure can be found in the About these statistics section.
4. Regularity of contact in separated families
In 2021 to 2022, 56% of children in separated families saw their non-resident parent regularly – that is, at least fortnightly.
The last truly comparable figure was that for 2015 to 2016. This is because data is not available for 2017 to 2018, and analysis of the 2019 to 2020 data implied that the proportion of non-resident parents with regular contact was suppressed due to the restrictions imposed in response to the COVID-19 pandemic.
The proportion has increased by 5 percentage points since 2015 to 2016 (note: the percentage point change is calculated before rounding figures to the nearest 1%). This is likely to represent a real increase in the level of non-resident parent contact amongst separated families.
The proportion of children in separated families who see their non-resident parent regularly (at least fortnightly during term-time), 2013 to 2022
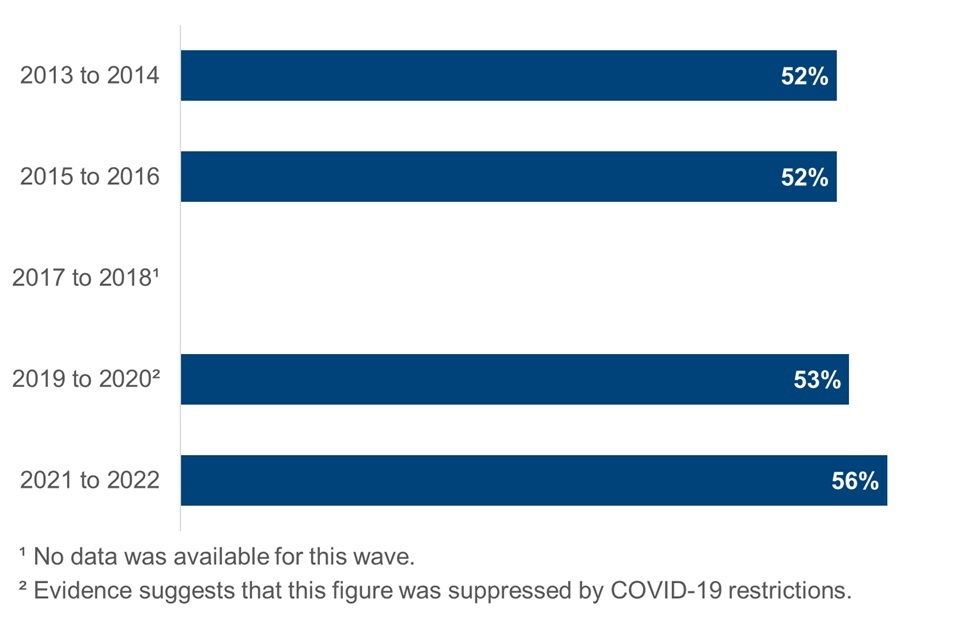
Source: Understanding Society survey, waves 5, 7, 11, and 13
Details and methodology
Information around relationship quality between separated parents is not fully reported in Understanding Society. However, analysis of the available data on frequency of contact shows that regular contact between the child and non-resident parent is a good indication of a better relationship between the parents. This leads us to focus on the frequency of contact between the non-resident parent and child, which is available for most respondents, and serves as a proxy for reasonable quality inter-parental relationships among separated families, as well as being a positive outcome in its own right.
All adult respondents are asked whether they are the parent of a child under 20 where the other parent is not in the household. Those who say ‘yes’ are asked some further questions, including how often the child ‘usually sees’ the non-resident parent in term time and (separately) in holidays. Results are similar in both questions. We have defined regularly as ‘at least fortnightly’ during term time.
Questions about contact in separated families are asked of both resident and non-resident parents in the survey. We are using the views of resident parents for this indicator because research suggests much lower response rates to surveys for non-resident parents that do not have contact with their children (for example, see Peacey and Hunt, 2008 (PDF)). Using responses from non-resident parents is therefore likely to over-estimate the proportion of children who see their non-resident parent regularly.
A change in the underlying survey meant that data were not collected from 2017 to 2018 for every child with a non-resident parent. A further change enabled us to resume production of this statistic from 2019 to 2020, but it will not be possible to retrospectively produce an estimate for 2017 to 2018.
5. About these statistics
How the couple-parent relationship distress measure is derived
The Understanding Society survey collects information about the quality of couple relationships through ten questions. These questions are:
- How often do you have a stimulating exchange of ideas? (IDEAS)
- How often do you calmly discuss something? (DISCUSS)
- How often do you work together on a project? (WORK TOGETHER)
- How often do you and your partner ‘get on each other’s nerves’? (NERVES)
- How often do you consider divorce/separation? (DIVORCE)
- Do you ever regret that you married or lived together? (REGRET)
- How often do you and your partner quarrel? (QUARREL)
- Do you kiss your partner? (KISS)
- Do you and your partner engage in outside interests together? (INTERESTS)
- Overall, how happy are you with your relationship? (HAPPINESS)
Each of the ten questions have been analysed by exploring the association between negative responses to the questions and a range of indicators which are directly or indirectly associated with outcomes of children. There are three type of outcomes we have considered, which are:
- children’s behavioural outcomes: as measured by the Strengths and Difficulties Questionnaire sub-scores: Emotional Symptoms and Conduct Problems
- poor maternal mental health as measured by the 12-item General Health Questionnaire. Poor parental mental health is associated with poorer outcomes for children
- likelihood of separation in the following year of the survey. Parental separation can carry economic risks for both children and parents
For each of the ten relationship quality questions, the parents have been divided into two groups:
- those who responded negatively to the question
- those who did not respond negatively to the question
The average score for each of the three outcomes is measured and compared between the two groups of parents. Results of this comparison were used to score each relationship quality question:
- higher scores were assigned to those questions where a larger difference between the two groups of parents was observed
- no points were given if the result of the comparison was not statistically significant
The results of this comparison are summarised as follows (strongest to weakest relationship):
- REGRET
- DIVORCE
- QUARREL
- NERVES
- DISCUSS
- KISS
- WORK TOGETHER
- IDEAS
- INTERESTS
- HAPPINESS
The top four questions, REGRET, DIVORCE, QUARREL and NERVES were chosen to inform the indicator.
The final measure has been constructed such that, if both adults answer the four questions and either adult answers any of them negatively, the relationship is considered to be ‘distressed’. If either adult did not respond to the four questions, then the quality of the relationship is defined to be ‘unknown’.
Data source – Understanding Society survey
Understanding Society is a nationwide household survey, which has been interviewing up to 40,000 households across the UK annually from 2009 onwards. The survey captures a wide range of information about people’s social and economic circumstances, attitudes, behaviours, and health and contains a rich range of information on families. It is a longitudinal household survey, which means it follows and records information on the same families over time. Questions about relationship quality and frequency of contact for separated parents are asked every 2 years.
Data source – cross sectional analysis
These figures relate to all children for which data is available in the relevant years.
These indicators were originally published in Improving Lives: Helping Workless Families for 2011 to 2012 and 2013 to 2014. For the period 2011 to 2014, children whose families had subsequently dropped out were not included in our sample.
We changed the methodology because, as we increase the number of waves, this approach would increasingly restrict and bias our sample, and it also would mean that previously published figures would change each time a new wave was added.
6. Where to find out more
Read about the Improving Lives: Helping Working Families analysis and the development of the indicators.
Read the policy paper which this evidence base underpins.
7. Contacts
Feedback on the content, relevance, accessibility and timeliness of these statistics and any non-media enquiries should be directed by email to cm.analysis.research@dwp.gov.uk.
For media enquiries, contact DWP press office.
Our statistical practice is regulated by the Office for Statistics Regulation (OSR). OSR sets the standards of trustworthiness, quality and value in the Code of Practice for Statistics that all producers of official statistics should adhere to.
You are welcome to contact us directly (cm.analysis.research@dwp.gov.uk) with any comments about how we meet these standards.
Alternatively, you can contact OSR by emailing regulation@statistics.gov.uk or via the OSR website.
ISBN: 978-1-78659-827-1