Statistical commentary
Updated 22 September 2021

© Crown copyright 2021
This publication is licensed under the terms of the Open Government Licence v3.0 except where otherwise stated. To view this licence, visit nationalarchives.gov.uk/doc/open-government-licence/version/3 or write to the Information Policy Team, The National Archives, Kew, London TW9 4DU, or email: psi@nationalarchives.gov.uk.
Where we have identified any third party copyright information you will need to obtain permission from the copyright holders concerned.
This publication is available at https://www.gov.uk/government/statistics/non-domestic-rating-stock-of-properties-including-business-floorspace-2021/statistical-commentary
1. Stock of Properties in England and Wales Time Series
The following section shows the changes to property counts and total rateable value over time. Each time series covers four distinct rating lists: 2000, 2005, 2010 and 2017 and shows data on the VOA system as at 31 March for each year.
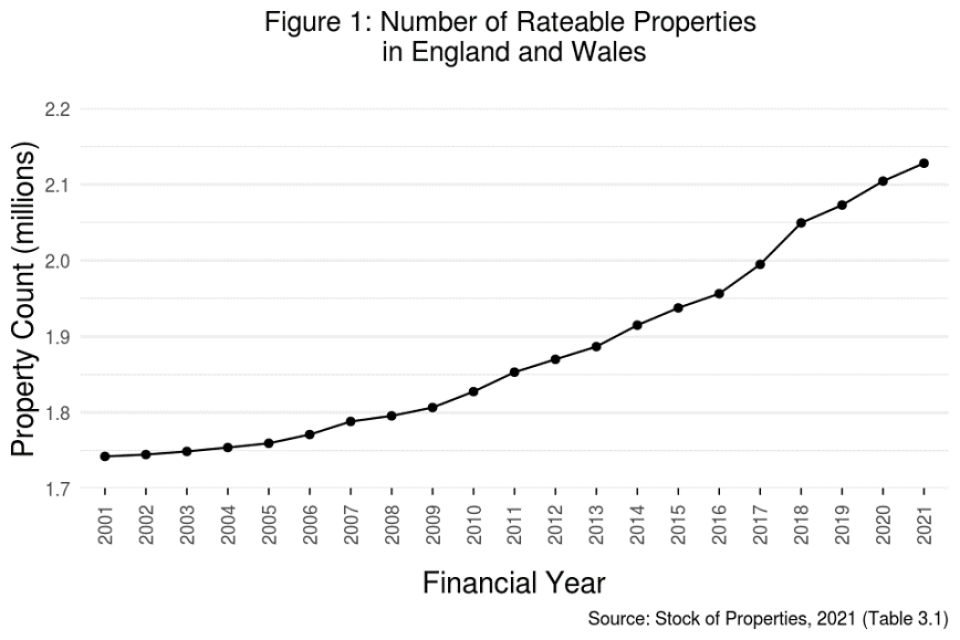
Figure 1: Number of rateable properties in England and Wales
Figure 1 shows the total number of properties in England and Wales as at 31 March each year, from 2001 to 2021. In total, there were 23,590 more properties as at 31 March 2021 compared with the same time last year. This is an increase of 1.1%.
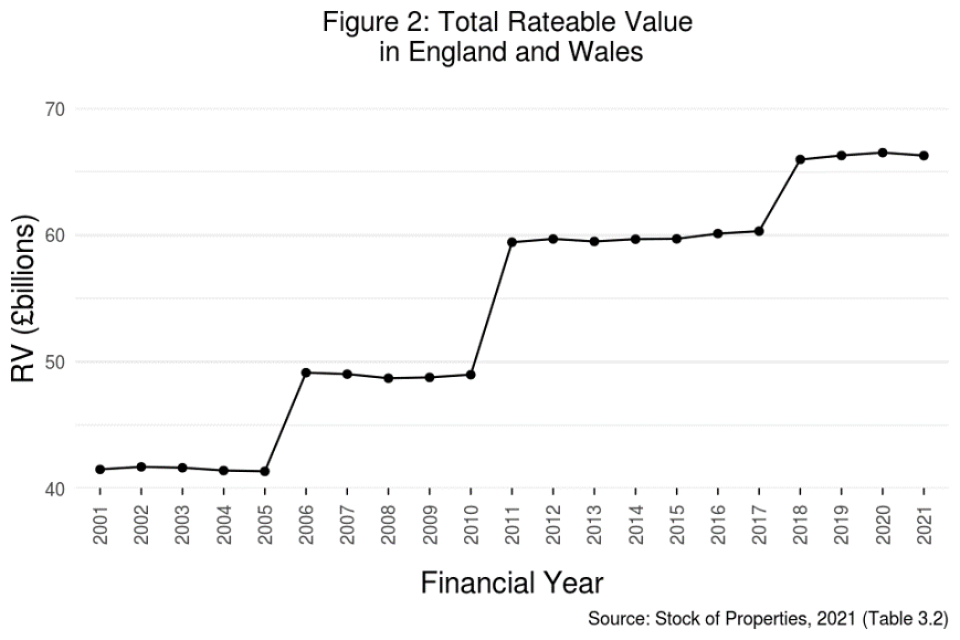
Figure 2: total rateable value in England and Wales
Figure 2 shows total rateable value in England and Wales as 31st March each year, from 2001 to 2021. Each step change in total rateable value coincides with the end of a revaluation cycle and the introduction of a new rating list. In total there was a decrease of £0.2 billion as at 31 March 2021 compared with the same time last year. This is a reduction of 0.4%. Rateable value can change due to properties being deleted from the list, new properties added or amendments to existing properties.
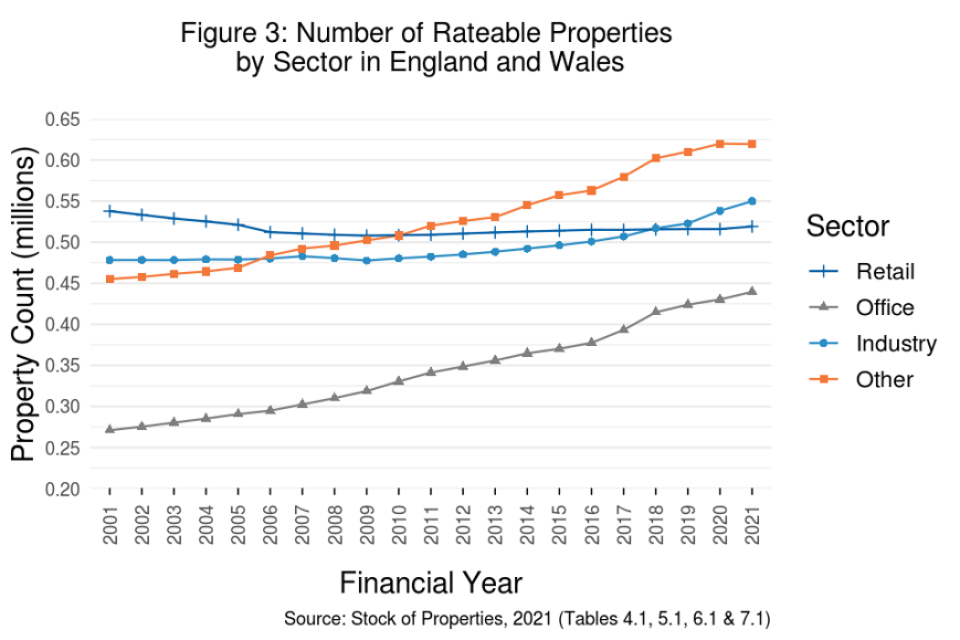
Figure 3:
Figure 3 shows the total number of properties in England and Wales as 31st March each year, from 2001 to 2021 for each sector.
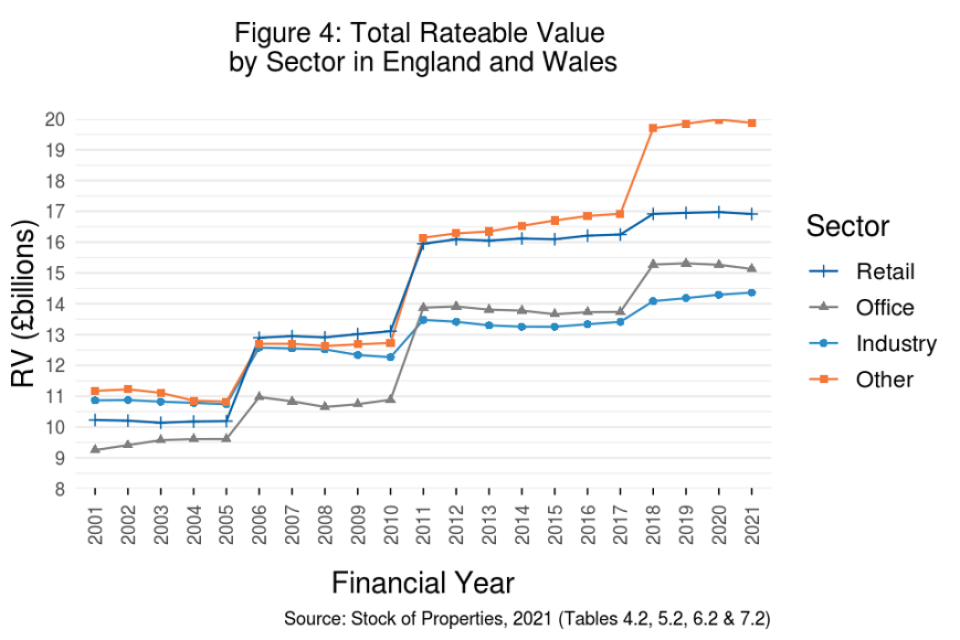
Figure 4
Figure 4 shows total rateable value in England and Wales as 31st March each year, from 2001 to 2021 for each sector. Each step change in total rateable value coincides with the end of a revaluation cycle and the introduction of a new rating list.
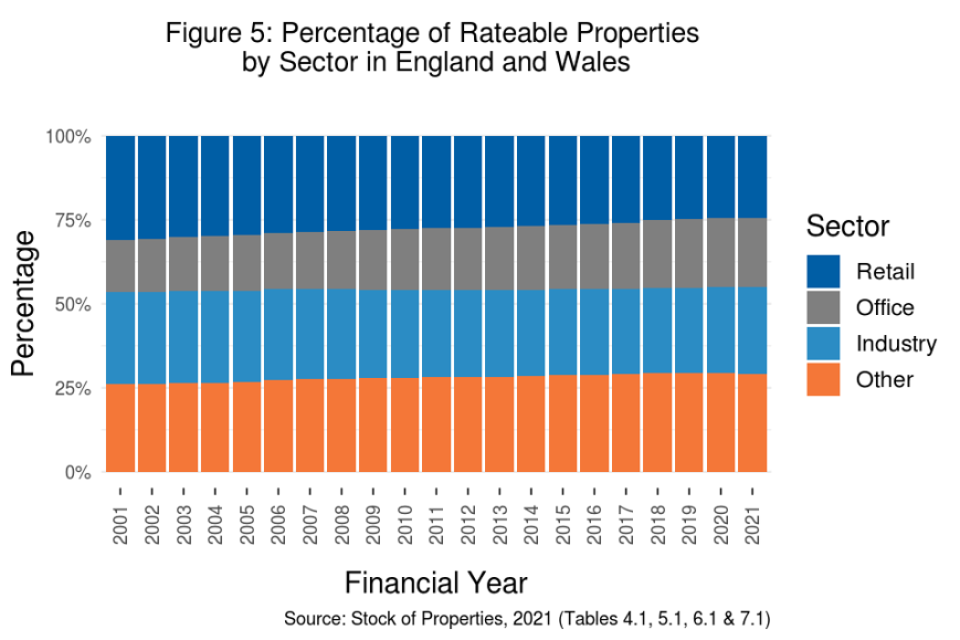
Figure 5
Figure 5 shows the percentage breakdown of total properties by sector in England and Wales as at 31 March each year, from 2001 to 2021. The step changes across each sector, most evident in the Retail and Office sectors, coincide with the end of a revaluation cycle and the introduction of a new rating list.
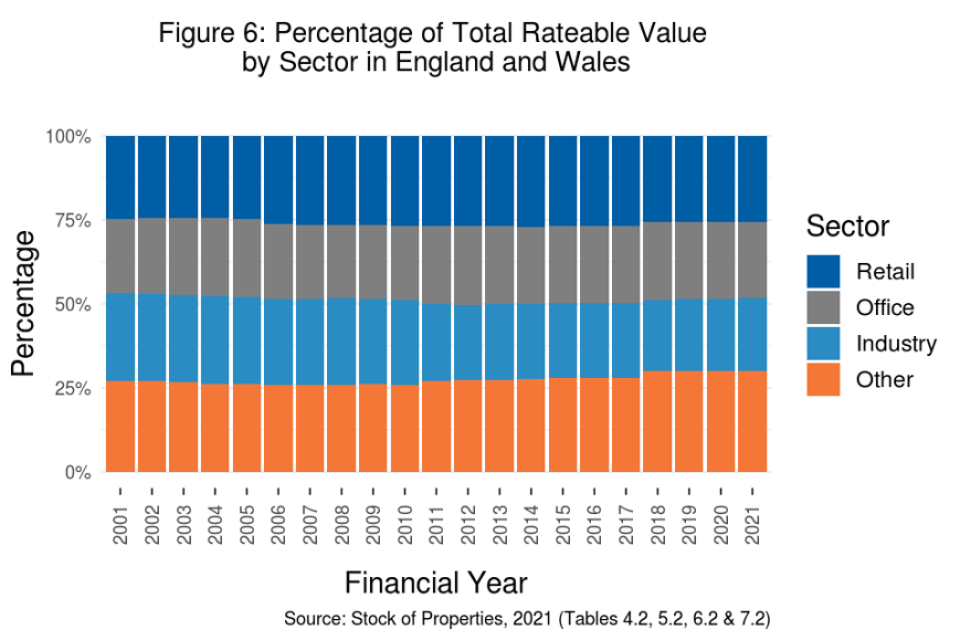
Figure 6
Figure 6 shows the percentage breakdown of total rateable value by sector in England and Wales as at 31 March each year, from 2001 to 2021. The step changes across each sector coincide with the end of a revaluation cycle and the introduction of a new rating list.
2. Stock of Properties in England and Wales as at 31 March 2021
This section shows a more detailed view of the number of rateable properties and total rateable value as at 31 March 2021.

Figure 7
Figure 7 shows property counts by sector and nation as at 31 March 2021. The Other Sector has the highest count with 619,480 properties (29.1%). The special categories (scat) included in this are listed in the stock scat tables.
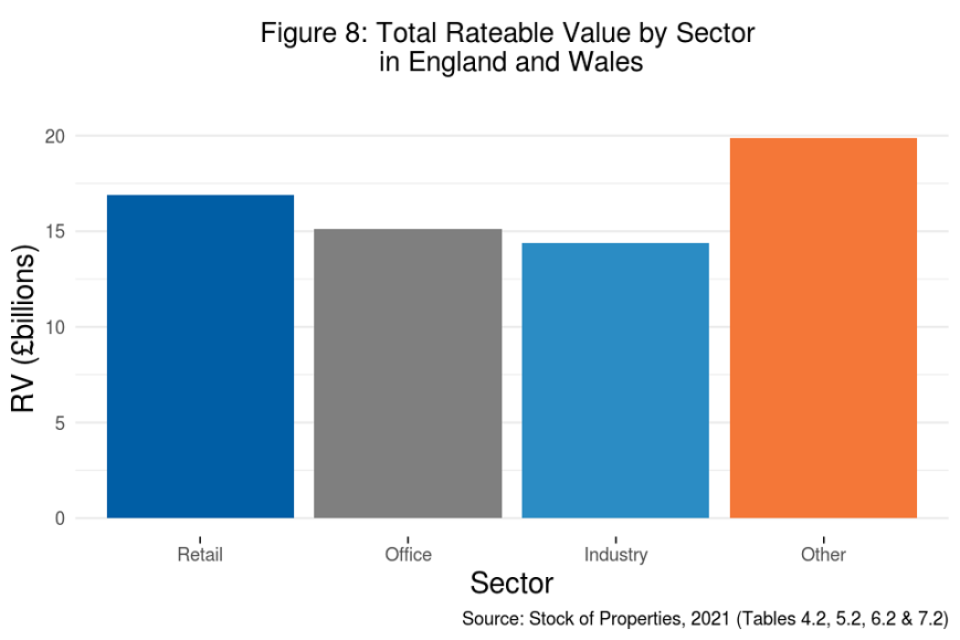
Figure 8
Figure 8 shows total rateable value by sector as at 31 March 2021. The Other Sector has the highest count with £19.9 billion (30%).

Figure 9
Figure 9 shows property counts by sector and geographical area as at 31 March 2021. London has the highest count with 325,240 properties (15.3% of the overall total of England and Wales).
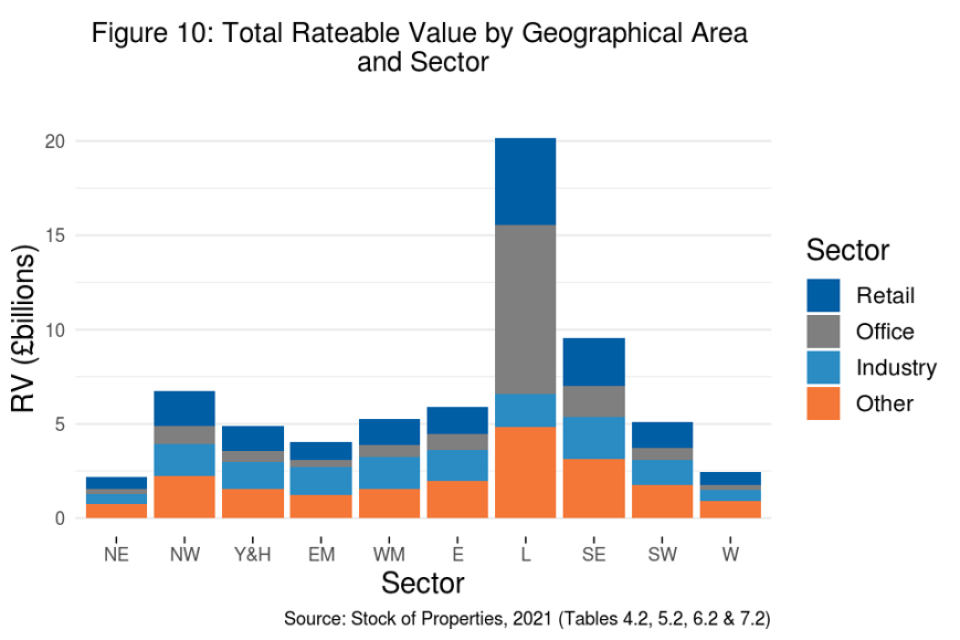
Figure 10
Figure 10 shows total rateable value by sector and geographical area as at 31 March 2021. London has the highest rateable value with £20.2 billion (30.4% of the overall total for England and Wales).
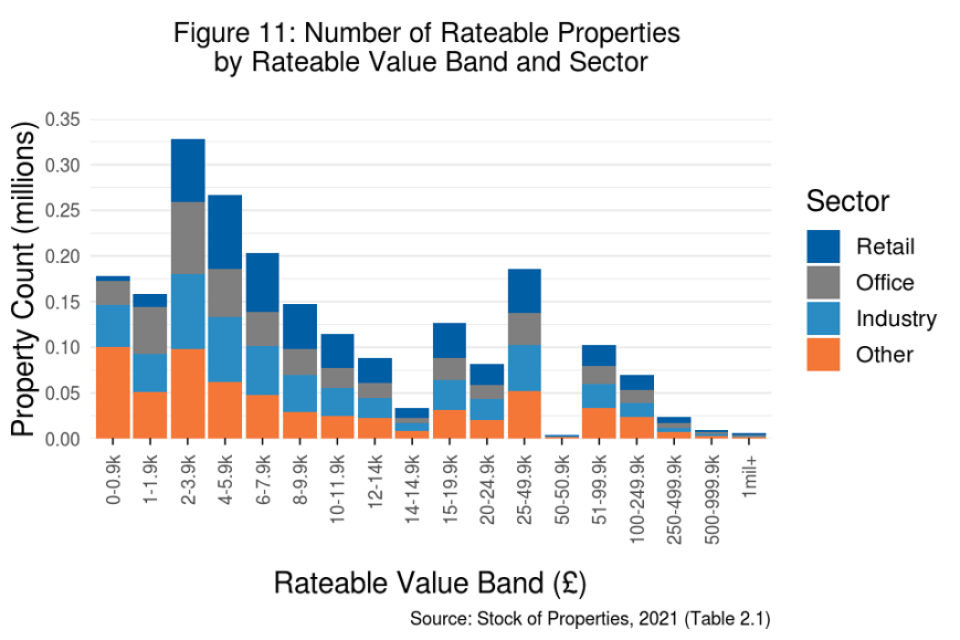
Figure 11
Figure 11 shows property counts by rateable value band in England and Wales as at 31 March 2021. There are 1,396,920 properties (65.6%) with a rateable value of less than £12,000. A further 121,740 properties (5.7%) had a rateable value of £12,000 to £14,999.
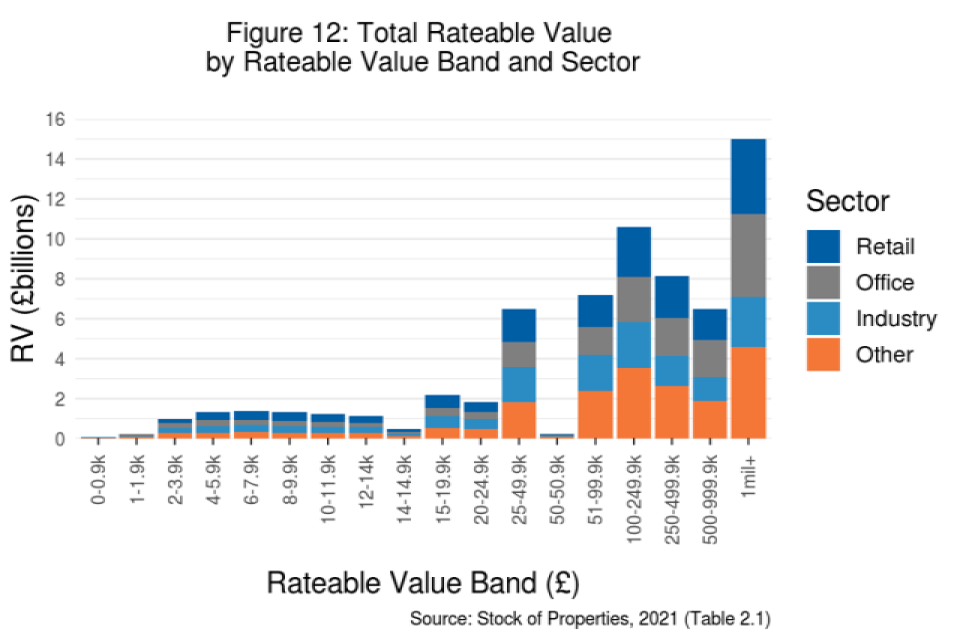
Figure 12
Figure 12 shows total rateable value by rateable value band in England and Wales as at 31 March 2021. Properties with a rateable value of £1 million or greater account for 22.6% (£15 billion) of the overall total.

Figure 13
Figure 13 shows property counts by sub-sector in England and Wales as at 31 March 2021.

Figure 14
Figure 14 shows total rateable value by sub-sector in England and Wales as at 31 March 2021.
3. Business Floorspace in England and Wales Time Series
The following section shows the changes to business floorspace, rateable value per metre squared, the number of properties without a floorspace and their associated rateable value over time. Each time series covers four distinct rating lists: 2000, 2005, 2010 and 2017 and shows data on the VOA system as at 31st March for each year.
Only properties that are valued using their floorspace are included in total floorspace counts and rateable value per metre squared. Counts broken down by special category code (SCat) as to which property types are included and excluded are available as a metadata file.
In England and Wales as at 31 March 2021:
-
A total of 1,700,420 properties across 156 SCat codes were included in total floorspace counts and rateable value per metre squared. This accounts for around 79.9% of all properties
-
517,820 properties in the Retail sector (99.7%)
-
439,620 properties in the Office sector (100%)
-
544,420 properties in the Industry sector (99%)
-
198,560 properties in the Other sector (32.1%)
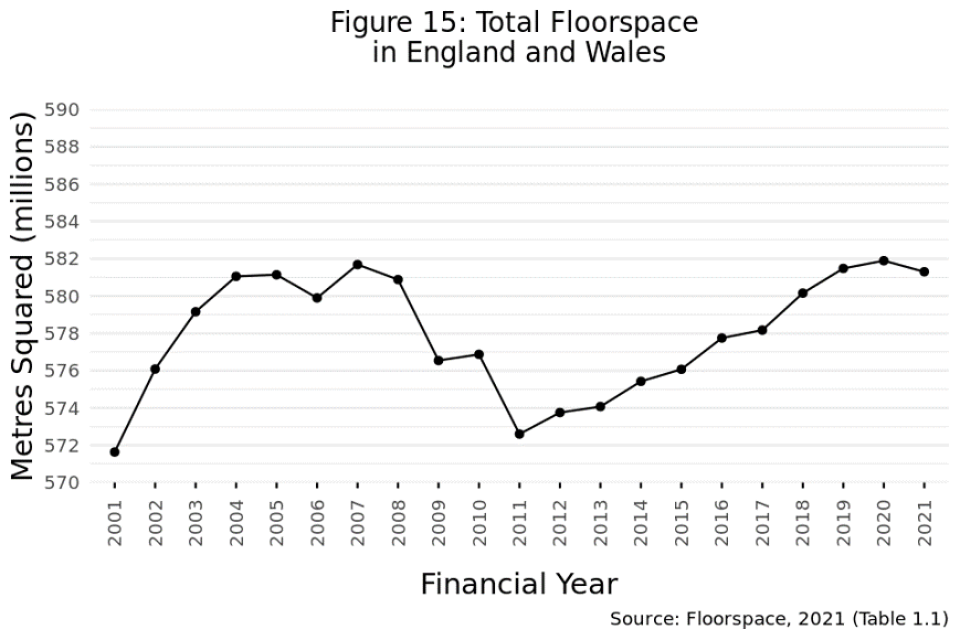
Figure 15
Figure 15 shows the total floorspace in England and Wales as at 31st March each year, from 2001 to 2021.
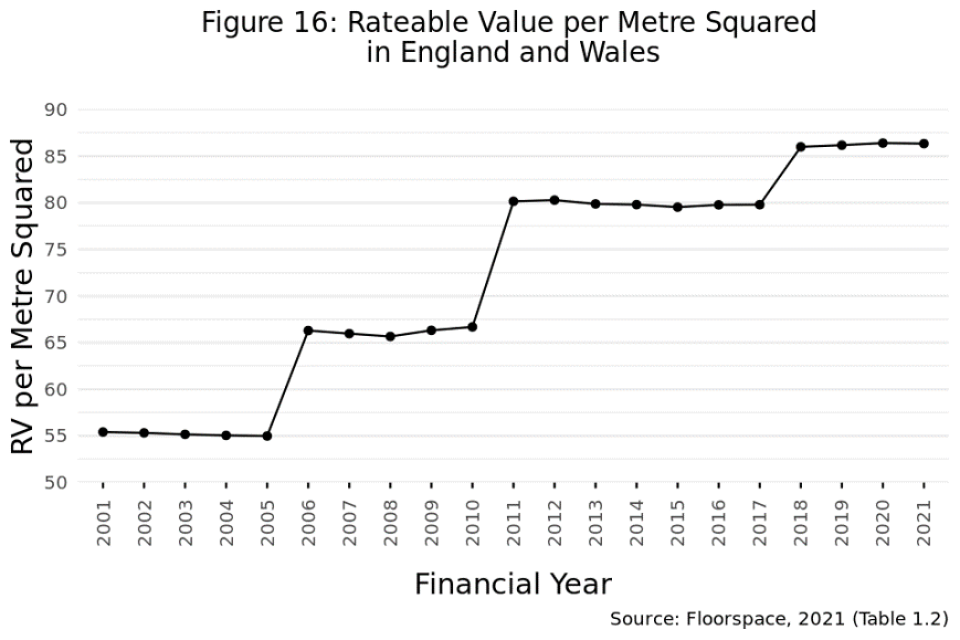
Figure 16
Figure 16 shows the rateable value per metre squared in England and Wales as at 31st March each year, from 2001 to 2021. Each sharp increase in total rateable value coincides with the end of a revaluation cycle and the introduction of a new rating list.

Figure 17
Figure 17 shows the total floorspace in England and Wales as 31st March each year, from 2001 to 2021 for each sector.

Figure 18
Figure 18 shows the rateable value per metre squared in England and Wales as 31st March each year, from 2001 to 2021 for each sector. Each sharp increase in total rateable value coincides with the end of a revaluation cycle and the introduction of a new rating list.

Figure 19
Figure 19 shows the total number of properties without a floorspace in England and Wales as at 31st March each year, from 2001 to 2021.
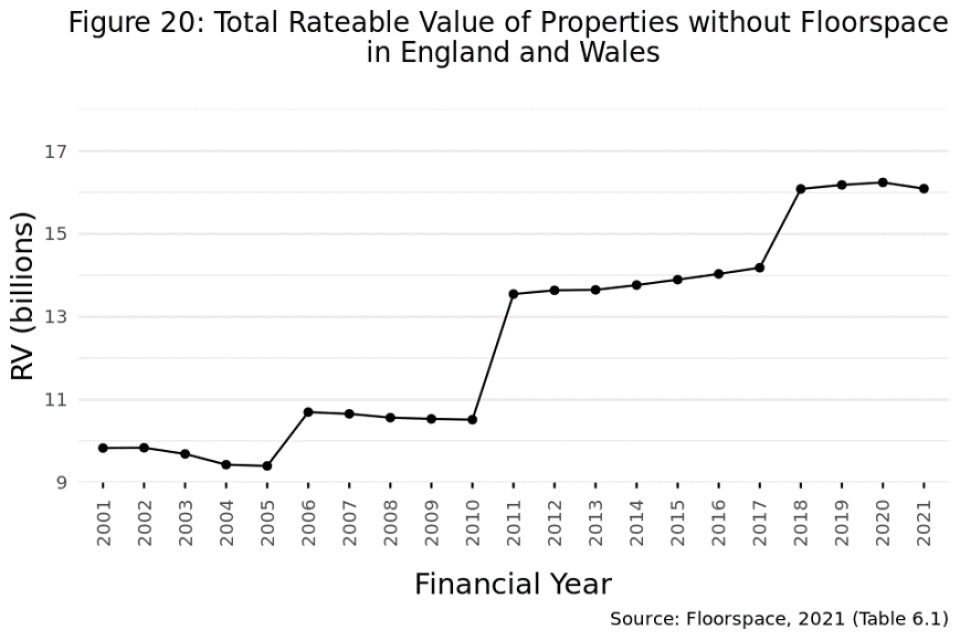
Figure 20
Figure 20 shows the total rateable value of properties without a floorspace in England and Wales as at 31st March each year, from 2001 to 2021. Each sharp increase in total rateable value coincides with the end of a revaluation cycle and the introduction of a new rating list.
4. Background notes
Valuation officers of the Valuation Office Agency (VOA) are required, by the Local Government Finance Act 1988, to compile and maintain rating lists specifying a rateable value (RV) for each relevant non-domestic rateable property (also known as a hereditament) in England and Wales. These rateable values provide the basis for national non-domestic rates bills, which are issued by local billing authorities.
The VOA collects information on rateable properties. A rateable property is a property on which rates may be charged and is the unit to which the VOA assigns rateable value. In general, rateable properties are buildings or premises within buildings, appropriate for or used for single occupation. Rateable properties can be occupied or vacant. This has no impact on rateable value, although it can affect the level of rates levied on a property.
The rateable value (RV) of a property is broadly the value at which a property might be expected to be let for one year. It is based on a range of factors including use, location and age, but a major determinant of rental value is the size (total floorspace) of the property.
Floorspace is defined as the internal area in metres squared used to calculate a property’s rateable value. In most instances, this will not include communal areas such as kitchens and facilities such as toilets. Not all property types are given a rateable value based upon their floorspace.
The floorspace in a particular location or sector can change for a number of reasons, including but not restricted to: demolished properties; new entities; reconstitution and alterations. RV per m2 will further be impacted by the outcome of successful challenges to valuations and Valuation Office Reports (VORs).
Non-domestic rateable properties fall into either a local rating list or a central rating list. There is a single local rating list for each billing authority in England and Wales, and there are two central rating lists, one for England and one for Wales. The central rating lists contain the rating assessments for the network property of major transport, utility and telecommunications undertakings and cross-country pipelines. There is a single entry in one of the rating lists (either for England or Wales) for each company named in the Central Rating List Regulations 2005. There are separate regulations and lists for England and Wales. The current rating lists came into effect on 1 April 2017.
There is a single aggregate rateable value shown for all the property occupied by the named ratepayer that falls within their definition in the regulations. Any property occupied by a central rating list ratepayer that falls outside the definition will be shown individually in a local rating list.
Rates on central rating list rateable properties in England are paid directly to the Ministry of Housing, Communities and Local Government, and in Wales to the Welsh Government.
For the purpose of this release, ‘Sector’ consists of the following categories: Retail, Industrial and Office (RIO), which is a categorization commonly used by those in the surveying profession. Properties are mapped to a RIO sector based on its SCat code, which is an operational code used by the VOA to classify a property’s use for administrative purposes. statisticians have, in conjunction with operational colleagues, mapped each SCat code to one of the three categories. The ‘Other’ category was created to cover SCat codes which could not be readily assigned to ‘Retail’, ‘Office’ or ‘Industry’. the VOA endeavors to keep these codes up-to-date, in some cases there may be a change in a property’s use which the VOA is not made immediately aware of. These statistics are based on the data recorded on the VOA’s systems at 31 March 2021.
5. Further information
More detailed information on the 2017 local rating list is available on the Agency’s website.
Further information on the area codes used in this release please refer to the ONS’s website.
We will keep under review the format of this summary document to improve the presentation of our statistics and welcome feedback from users on the usefulness of the information provided in this summary. Please forward any comments to statistics@voa.gov.uk.