Non-domestic rating: Reval 2023 compiled list, maps showing change in rateable value by area
Updated 18 May 2023

© Crown copyright 2023
This publication is licensed under the terms of the Open Government Licence v3.0 except where otherwise stated. To view this licence, visit nationalarchives.gov.uk/doc/open-government-licence/version/3 or write to the Information Policy Team, The National Archives, Kew, London TW9 4DU, or email: psi@nationalarchives.gov.uk.
Where we have identified any third party copyright information you will need to obtain permission from the copyright holders concerned.
This publication is available at https://www.gov.uk/government/statistics/non-domestic-rating-change-in-rateable-value-of-rating-lists-england-and-wales-2023-revaluation-compiled-list/non-domestic-rating-reval-2023-compiled-list-maps-showing-change-in-rateable-value-by-area
About this release
On 1 April 2023 a revaluation of all non-domestic properties in England and Wales took effect. The rateable value determined by the Valuation Office Agency (VOA) provides the basis for national non-domestic (business) rates bills.
This document has been released alongside comprehensive tables and statistical commentary which break down the change in rateable value between the 2017 and 2023 local rating lists by geography, sector, and distribution of rateable value. The purpose of this document is to present different geographical breakdowns of the impact of Revaluation 2023 through choropleth maps showing how rateable value has changed in each region and administrative area (billing authority) for each sector (retail, industry and office).
The retail, industry and office (RIO) sectors used in this release are part of a categorisation commonly used by those in the surveying profession, as well as in VOA official statistics on NDR Stock and Floorspace. VOA statisticians have mapped Special Category (SCat) codes to one of the three categories, however there are some codes which could not be readily assigned to retail, industry or office which have been combined to create an ‘other’ sector. Statistics for the ‘other’ sector are presented alongside the RIO sectors in the main tables and statistical commentary of this release. However, maps showing change in the ‘other’ sector have been excluded from this document because any apparent trends will reflect multiple different sectors or industries and may be misleading.
Responsible Statistician
Anna McReady
Statistical enquiries
1. Change in rateable value across England and Wales
This section provides maps which show differences in percentage change in rateable value from the 2017 local rating list to the 2023 list by region and administrative area across England and Wales. The maps are presented for rateable properties in all sectors as well as individually within the retail sector, industry sector and office sector. This data is also presented in Table A1 in the Appendix. Due to differences in how rateable values have changed between sectors (for example, the retail sector has decreased on average by 10% and the industry sector has increased on average by 27%), maps for each sector use different scales to highlight change within sector. These scales are consistent across regions to enable geographical comparisons.
The maps showing regional differences use initials to label each region as follows: North East (NE), North West (NW), Yorkshire and the Humber (Y&H), East Midlands (EM), West Midlands (WM), East (E), London (L), South East (SE), South West (SW) and Wales (W).
The maps showing administrative area differences do not include labels or a key with the names of each area due to the varying sizes of these areas on the maps. However, a labelled map alongside a table which provides a key and a full breakdown of percentage change in rateable value can be found for each area in the Appendix.
1.1 Change across all sectors
Figure 1: Percentage change in rateable value (RV) between 2017 and 2023 rating lists for English regions and Wales, all sectors
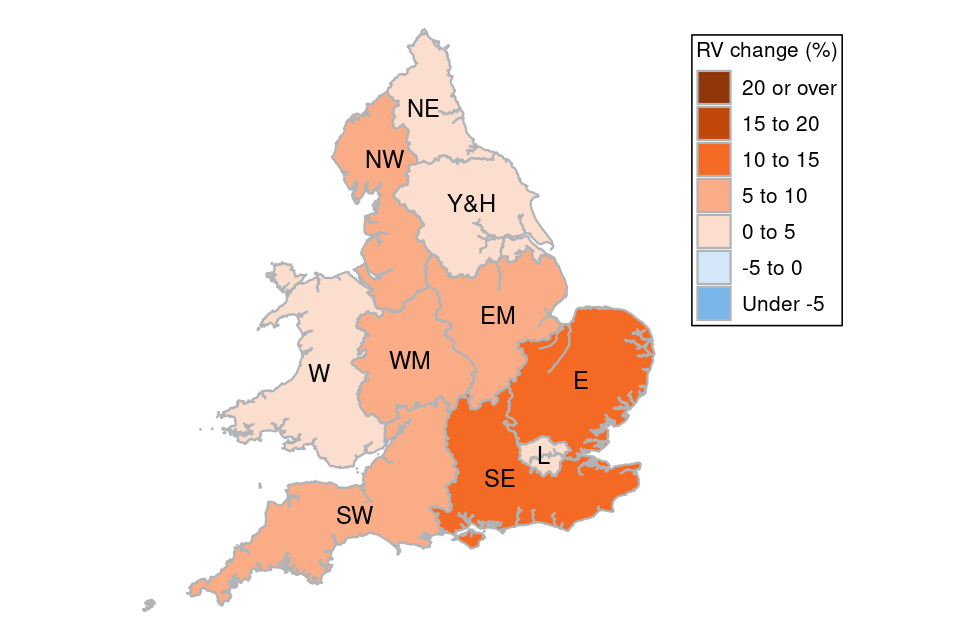
Source: NDR Revaluation 2023 compiled list (Table 1.0)
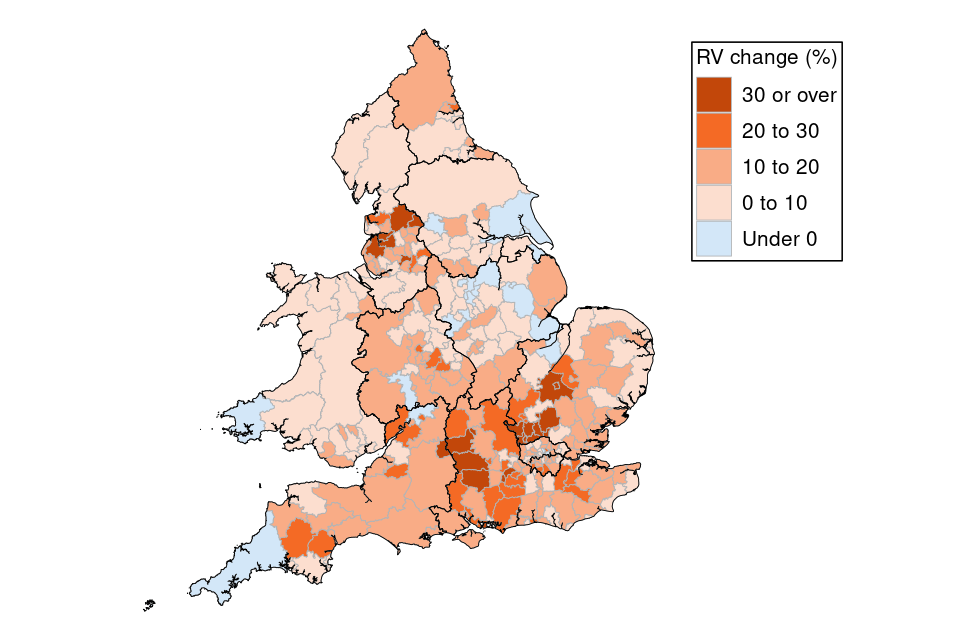
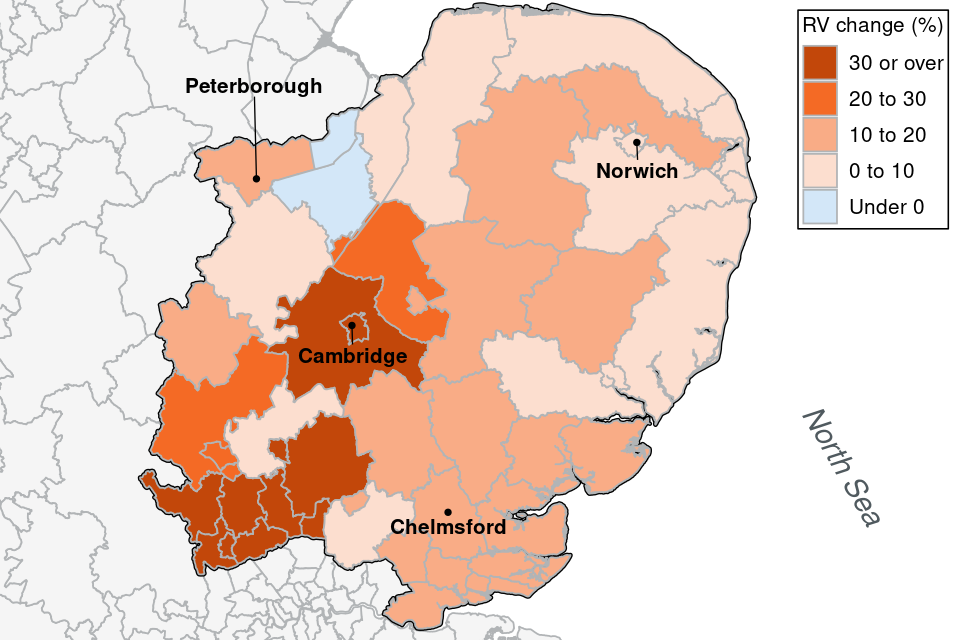
Figure 2: Percentage change in rateable value (RV) between 2017 and 2023 rating lists by administrative area, England and Wales, all sectors
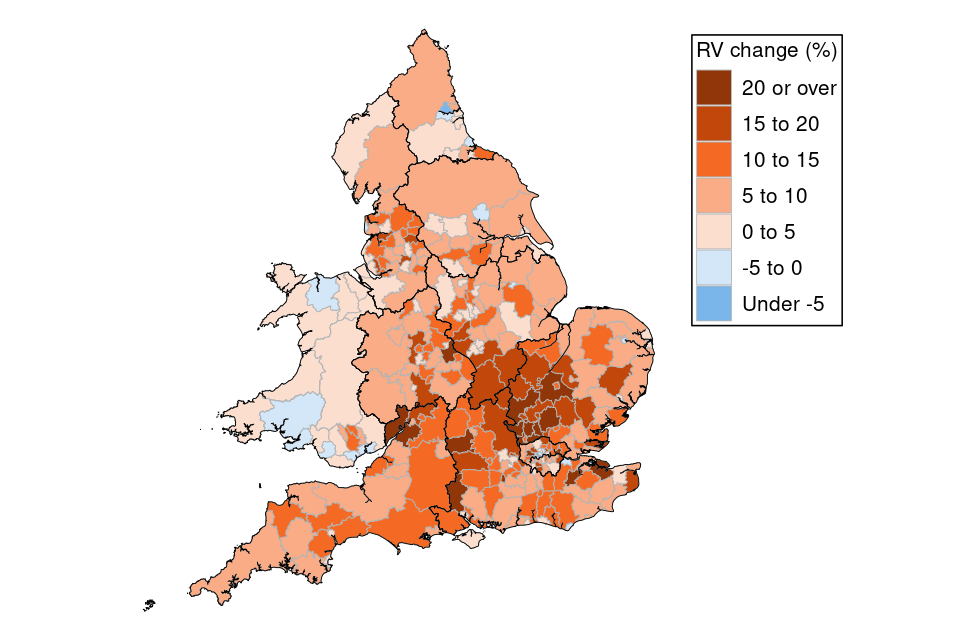
Source: NDR Revaluation 2023 compiled list (Table 2.0)
1.2 Change in the retail sector
Figure 3: Percentage change in rateable value (RV) between 2017 and 2023 rating lists for English regions and Wales, retail sector
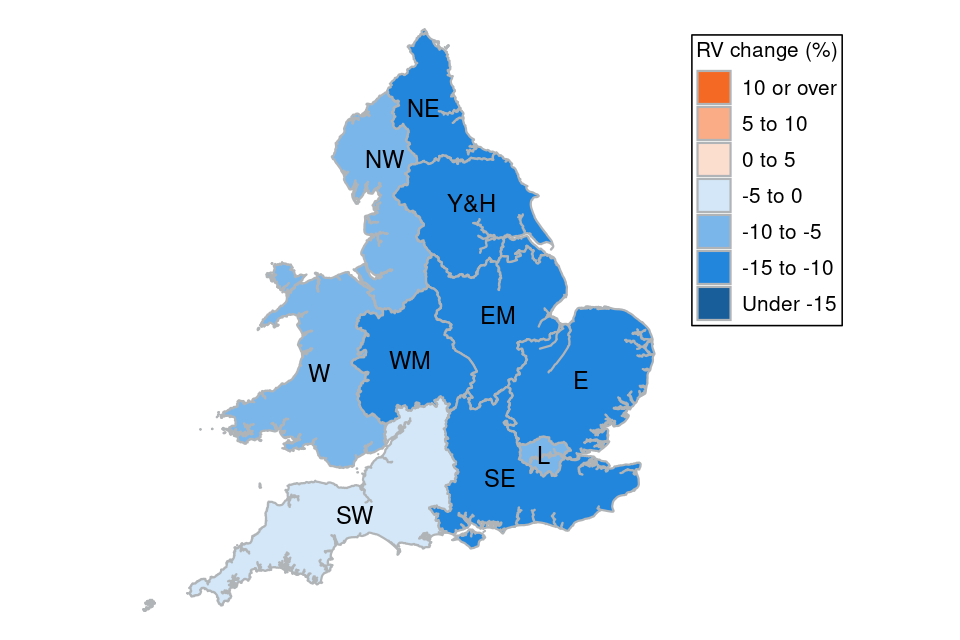
Source: NDR Revaluation 2023 compiled list (Table 1.0)
Figure 4: Percentage change in rateable value (RV) between 2017 and 2023 rating lists by administrative area, England and Wales, retail sector
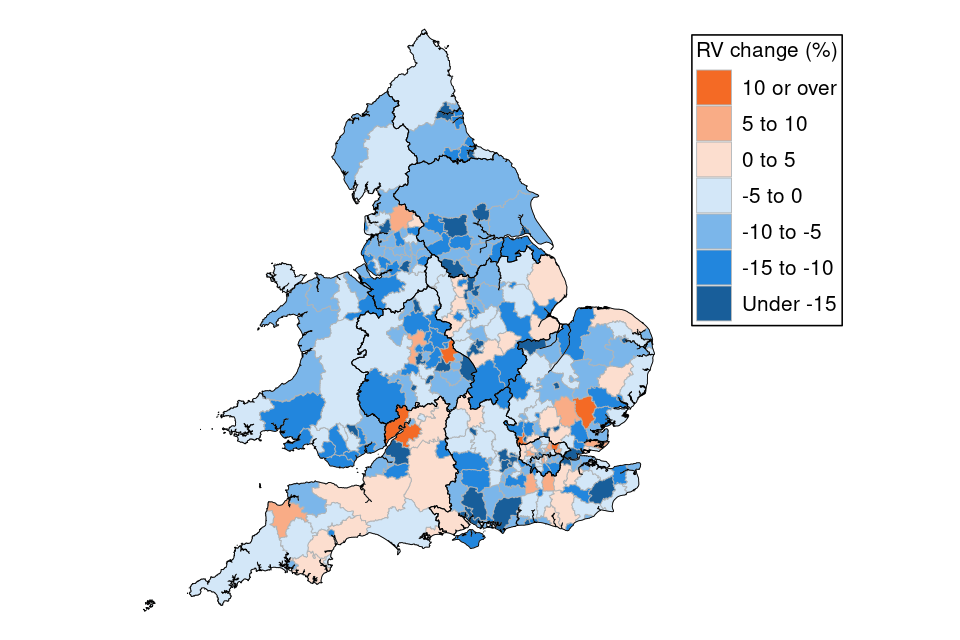
Source: NDR Revaluation 2023 compiled list (Table 2.1)
1.3 Change in the industry sector
Figure 5: Percentage change in rateable value (RV) by region between 2017 and 2023 rating lists for English regions and Wales, industry sector
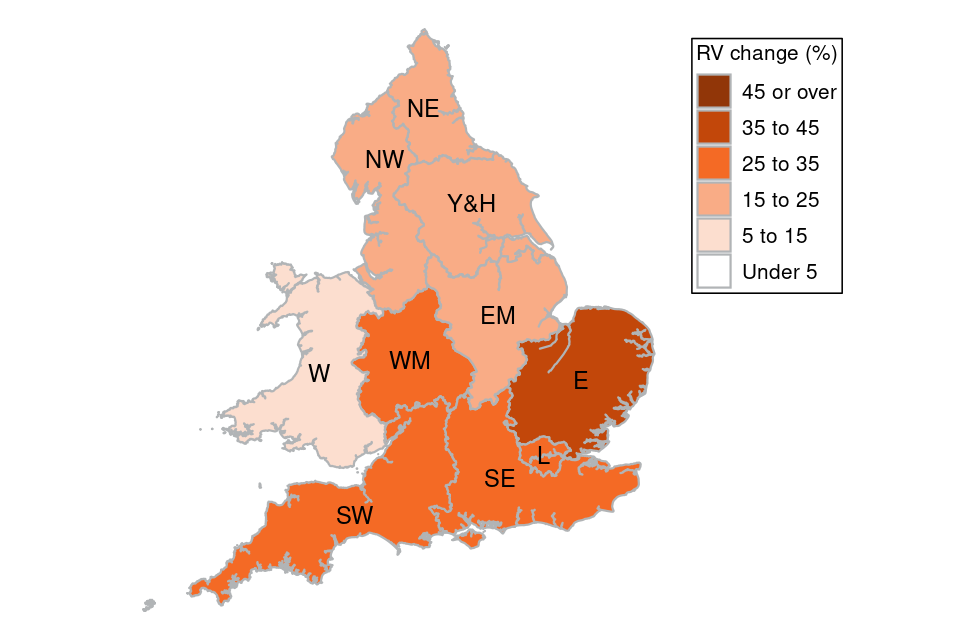
Source: NDR Revaluation 2023 compiled list (Table 1.0)
Figure 6: Percentage change in rateable value (RV) between 2017 and 2023 rating lists by administrative area, England and Wales, industry sector
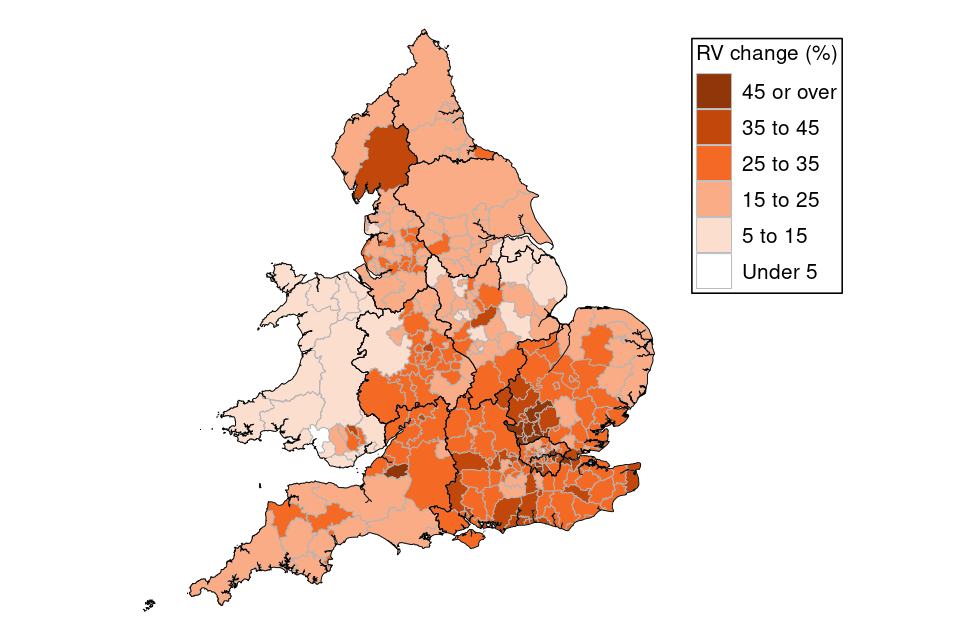
Source: NDR Revaluation 2023 compiled list (Table 2.2)
1.4 Change in the office sector
Figure 7: Percentage change in rateable value (RV) between 2017 and 2023 rating lists for English regions and Wales, office sector
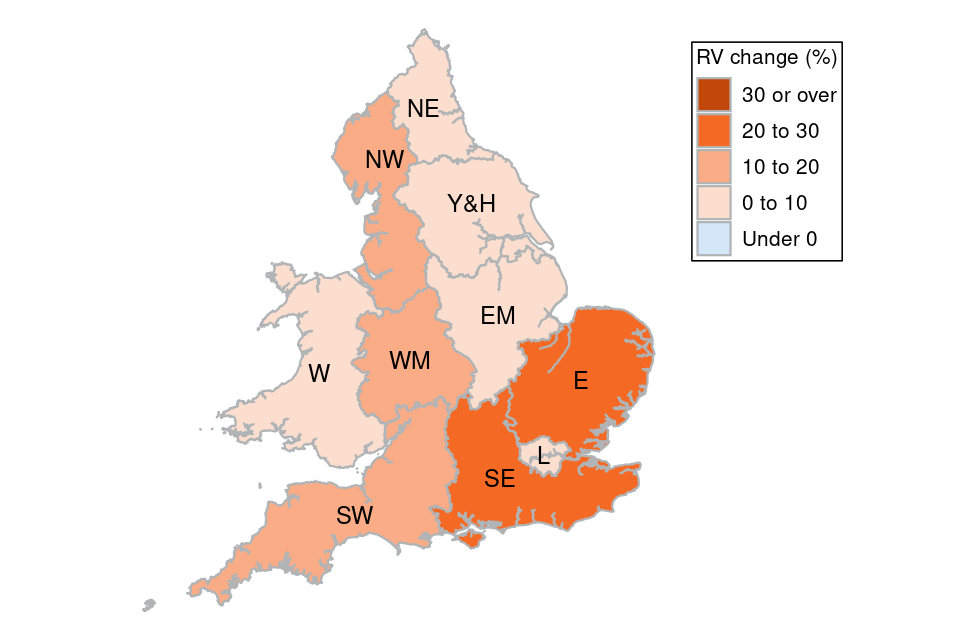
Source: NDR Revaluation 2023 compiled list (Table 1.0)
Figure 8: Percentage change in rateable value (RV) between 2017 and 2023 rating lists by administrative area, England and Wales, office sector
Source: NDR Revaluation 2023 compiled list (Table 2.3)
2. Change in rateable value within the North East region
This section provides maps which show differences in the percentage change in rateable value from the 2017 local rating list to the 2023 list by administrative area across the North East region of England. This data, including the look-up for each administrative area, is also presented in Table A2 in the Appendix.
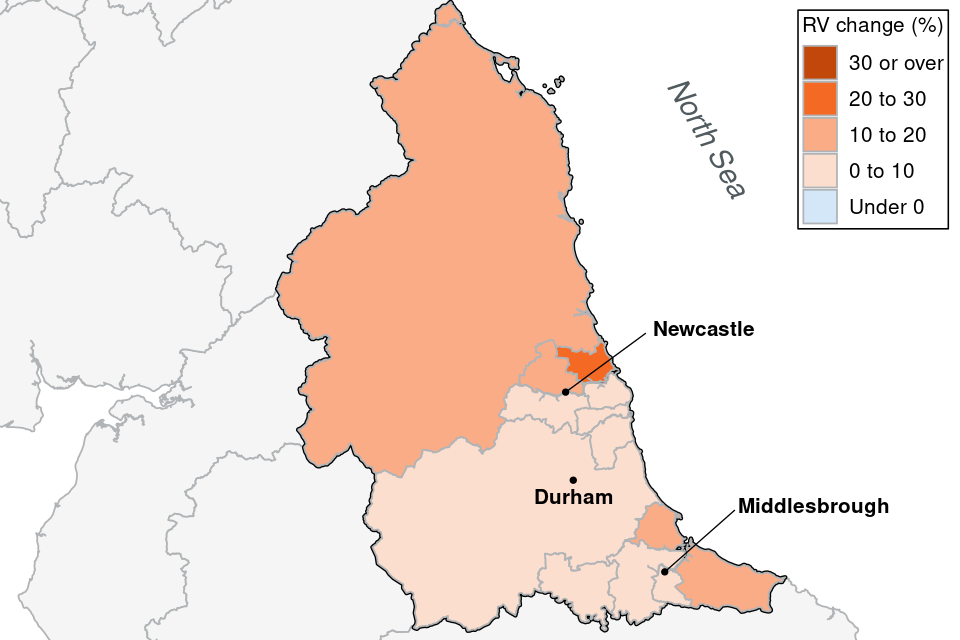
Figure 9: Percentage change in rateable value (RV) between 2017 and 2023 rating lists by administrative area, North East, all sectors
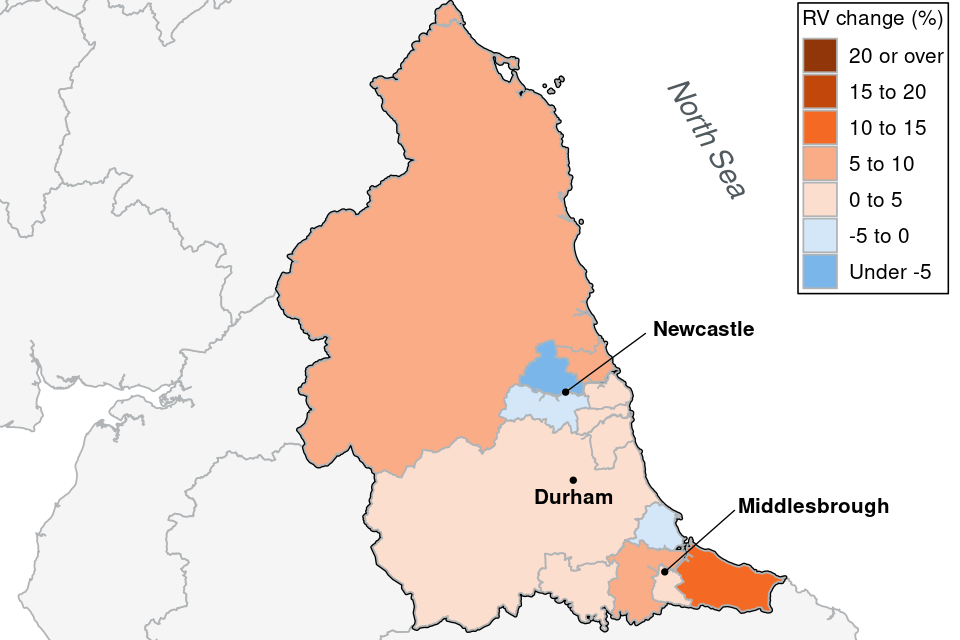
Source: NDR Revaluation 2023 compiled list (Table 2.0)
Figure 10: Percentage change in rateable value (RV) between 2017 and 2023 rating lists by administrative area, North East, retail sector
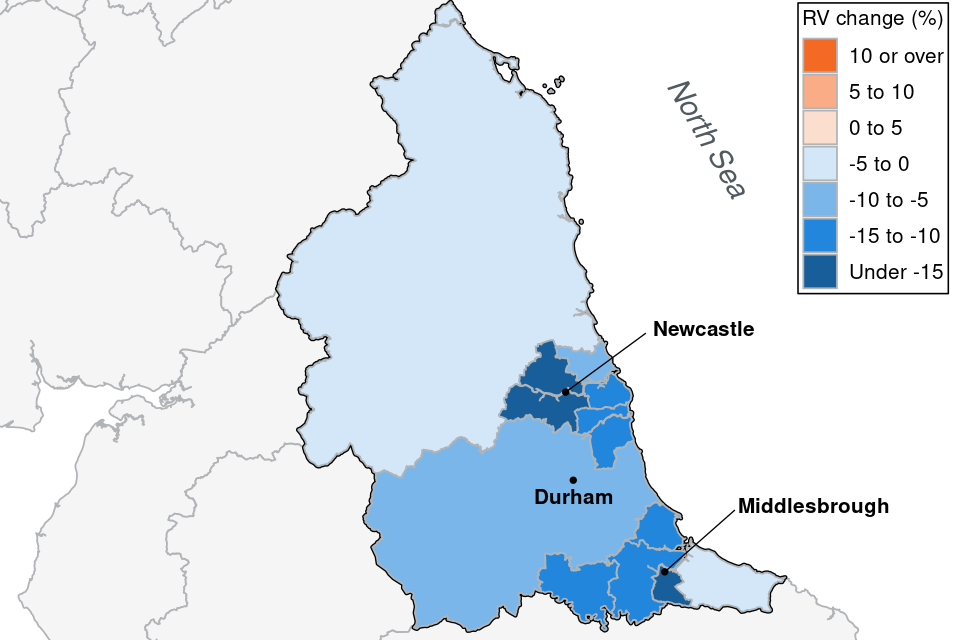
Source: NDR Revaluation 2023 compiled list (Table 2.1)
Figure 11: Percentage change in rateable value (RV) between 2017 and 2023 rating lists by administrative area, North East, industry sector
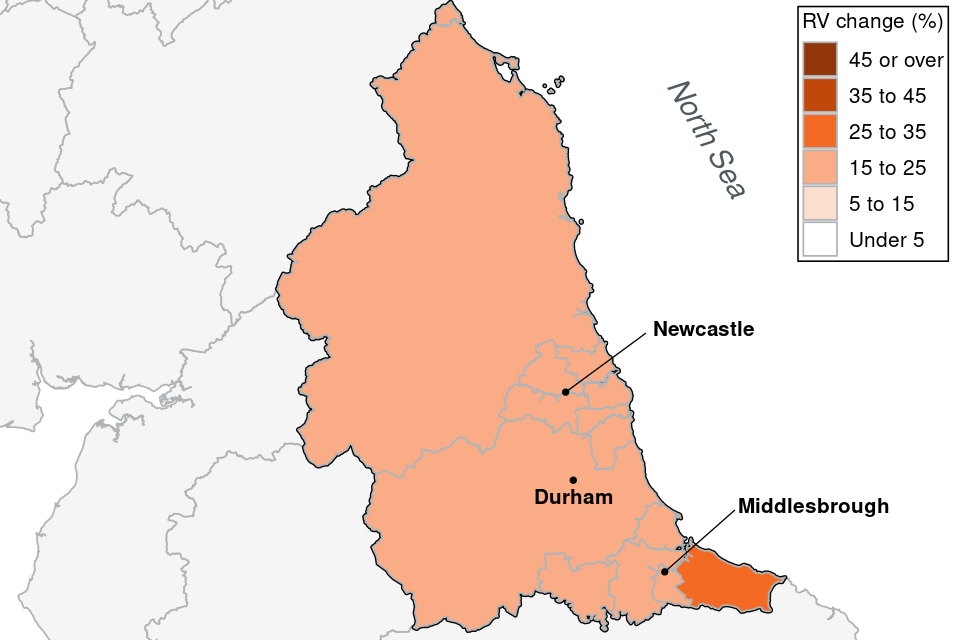
Source: NDR Revaluation 2023 compiled list (Table 2.2)
Figure 12: Percentage change in rateable value (RV) between 2017 and 2023 rating lists by administrative area, North East, office sector
Source: NDR Revaluation 2023 compiled list (Table 2.3)
3. Change in rateable value within the North West region
This section provides maps which show differences in the percentage change in rateable value from the 2017 local rating list to the 2023 list by administrative area across the North West region of England. This data, including the look-up for each administrative area, is also presented in Table A3 in the Appendix.
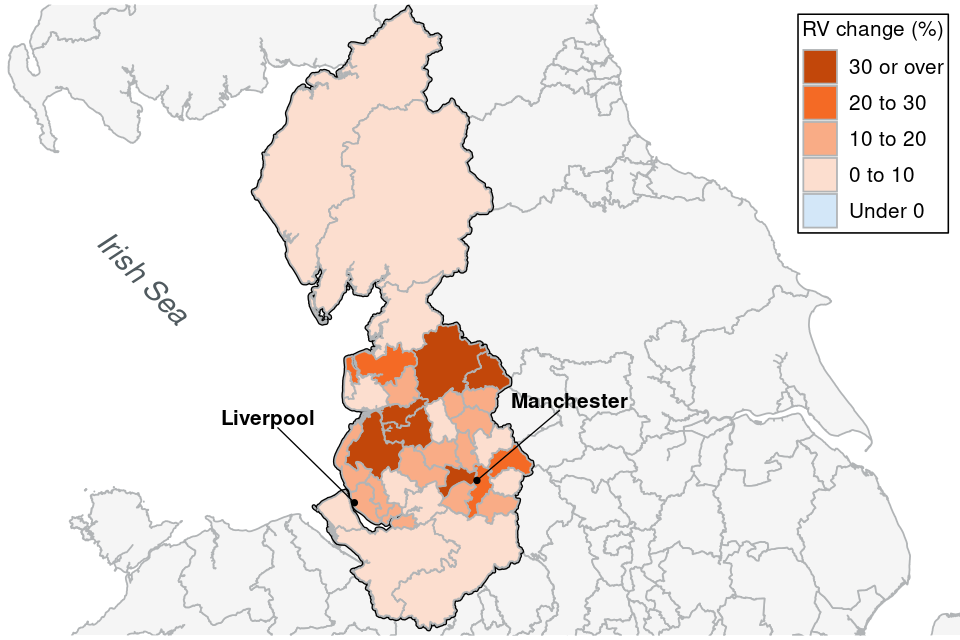
Figure 13: Percentage change in rateable value (RV) between 2017 and 2023 rating lists by administrative area, North West, all sectors
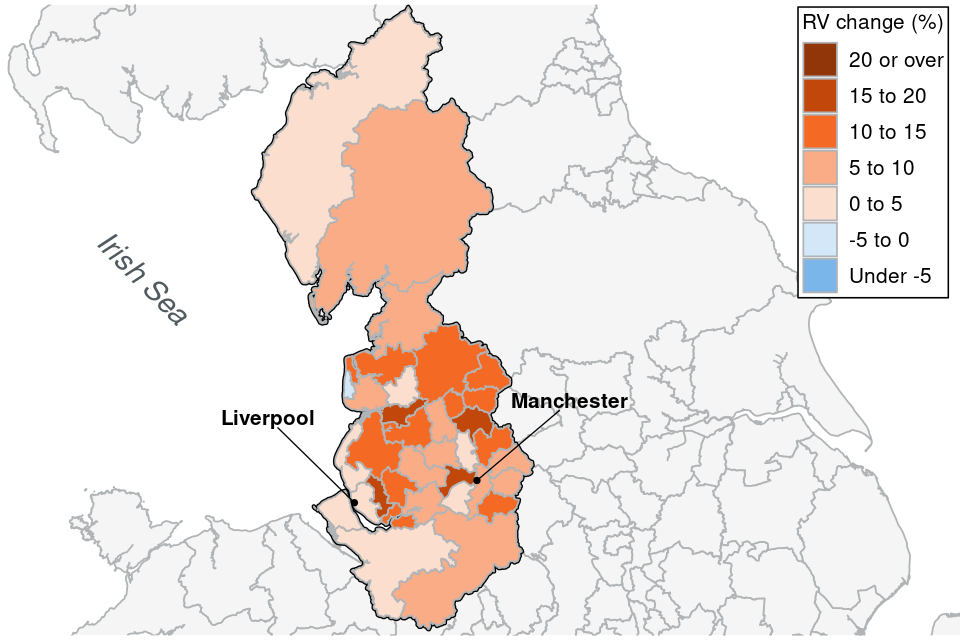
Source: NDR Revaluation 2023 compiled list (Table 2.0)
Figure 14: Percentage change in rateable value (RV) between 2017 and 2023 rating lists by administrative area, North West, retail sector
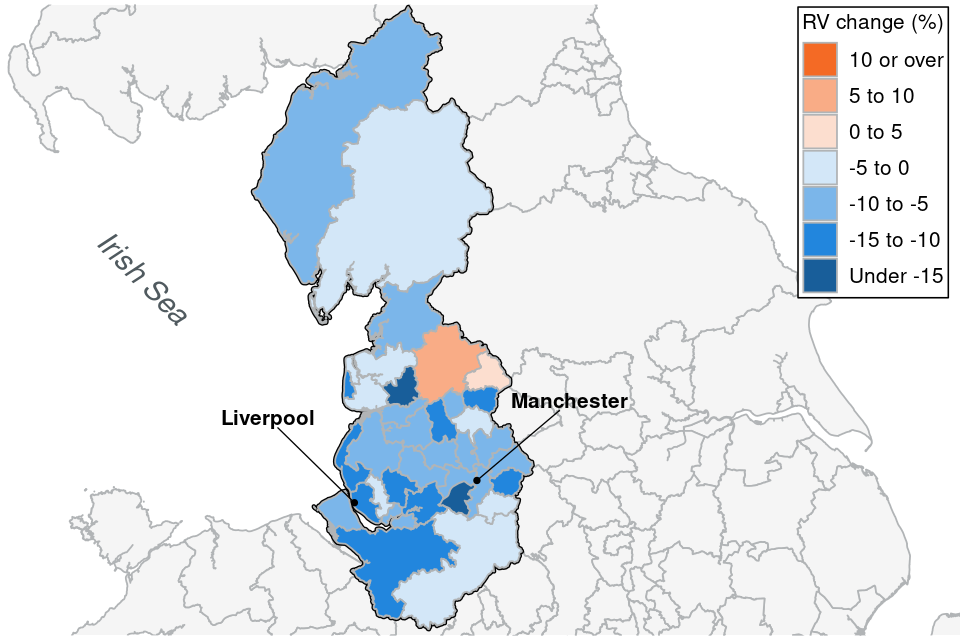
Source: NDR Revaluation 2023 compiled list (Table 2.1)
Figure 15: Percentage change in rateable value (RV) between 2017 and 2023 rating lists by administrative area, North West, industry sector
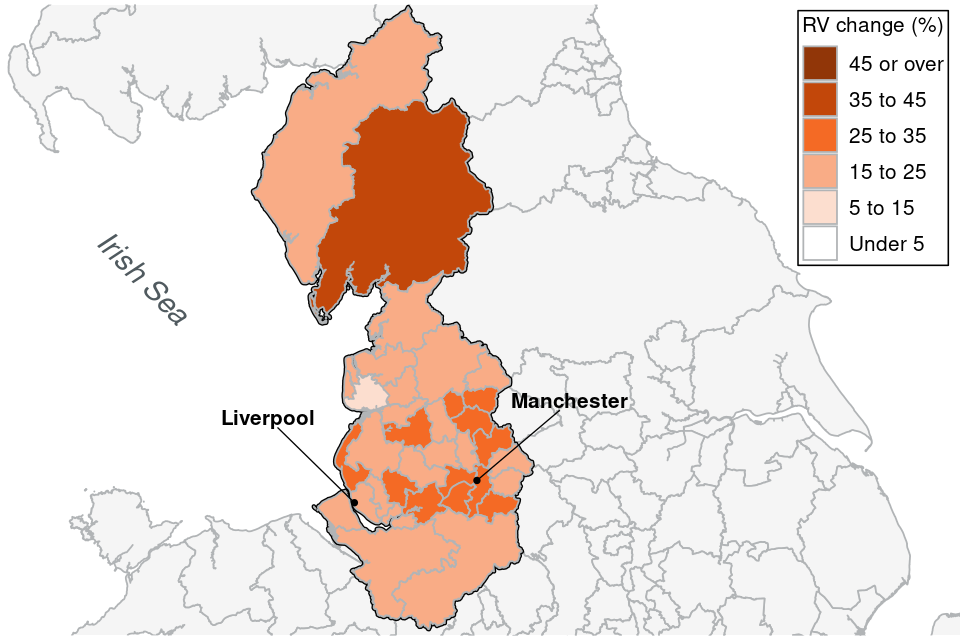
Source: NDR Revaluation 2023 compiled list (Table 2.2)
Figure 16: Percentage change in rateable value (RV) between 2017 and 2023 rating lists by administrative area, North West, office sector
Source: NDR Revaluation 2023 compiled list (Table 2.3)
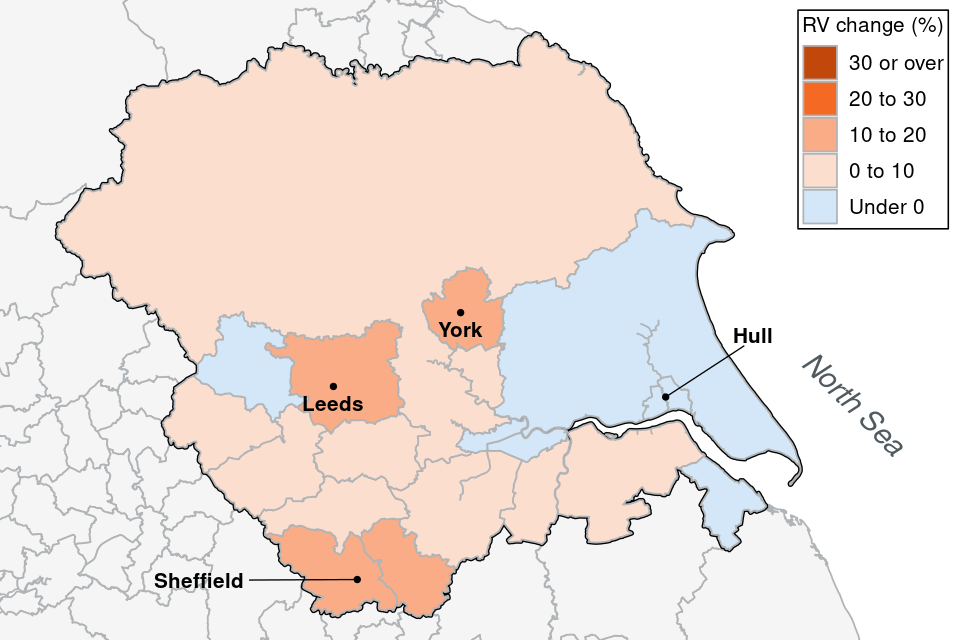
4. Change in rateable value within Yorkshire and the Humber region
This section provides maps which show differences in the percentage change in rateable value from the 2017 local rating list to the 2023 list by administrative area across Yorkshire and the Humber. This data, including the look-up for each administrative area, is also presented in Table A4 in the Appendix.
Figure 17: Percentage change in rateable value (RV) between 2017 and 2023 rating lists by administrative area, Yorkshire and the Humber, all sectors
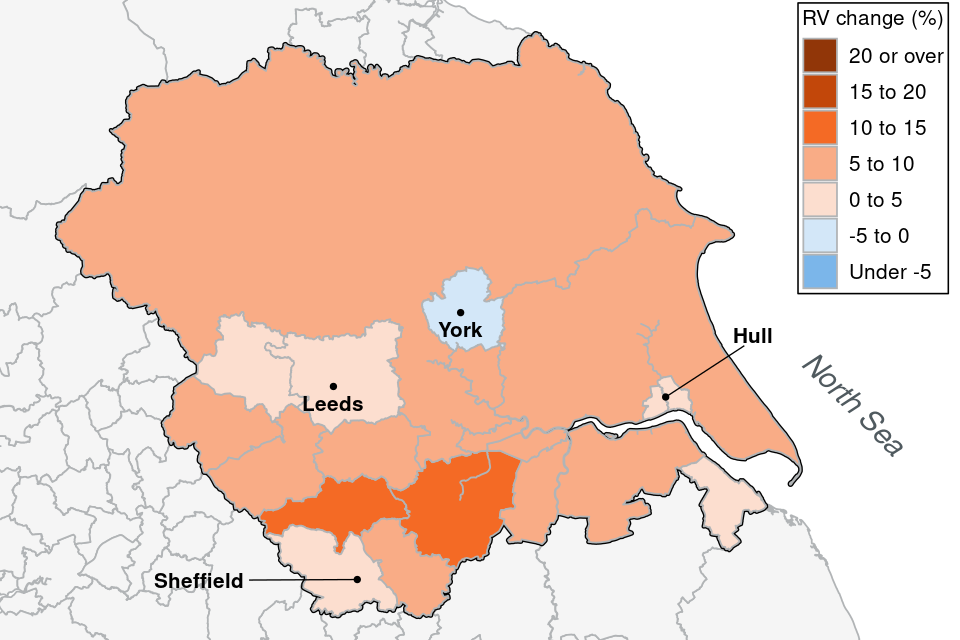
Source: NDR Revaluation 2023 compiled list (Table 2.0)
Figure 18: Percentage change in rateable value (RV) between 2017 and 2023 rating lists by administrative area, Yorkshire and the Humber, retail sector
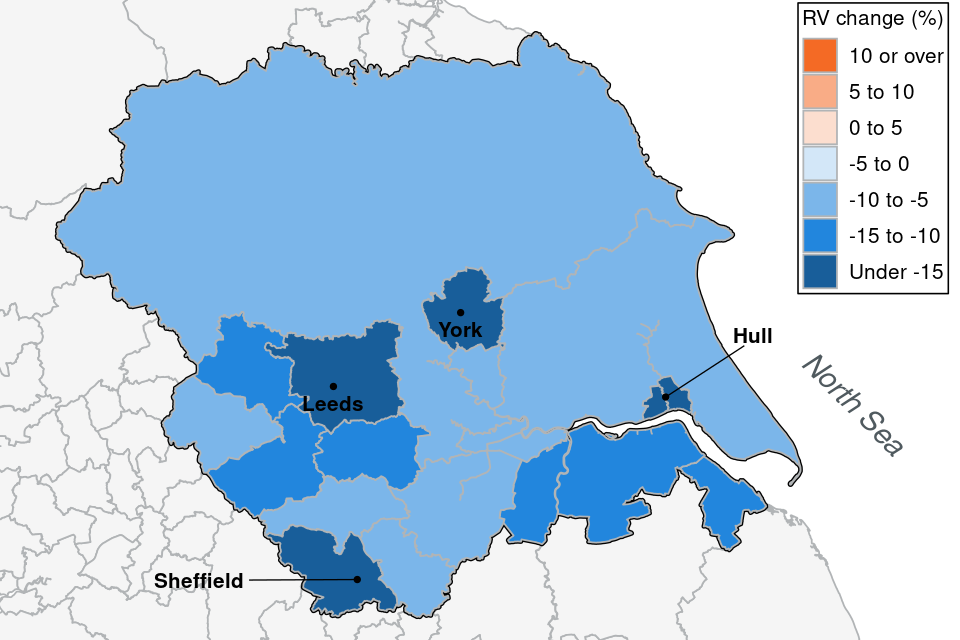
Source: NDR Revaluation 2023 compiled list (Table 2.1)
Figure 19: Percentage change in rateable value (RV) between 2017 and 2023 rating lists by administrative area, Yorkshire and the Humber, industry sector
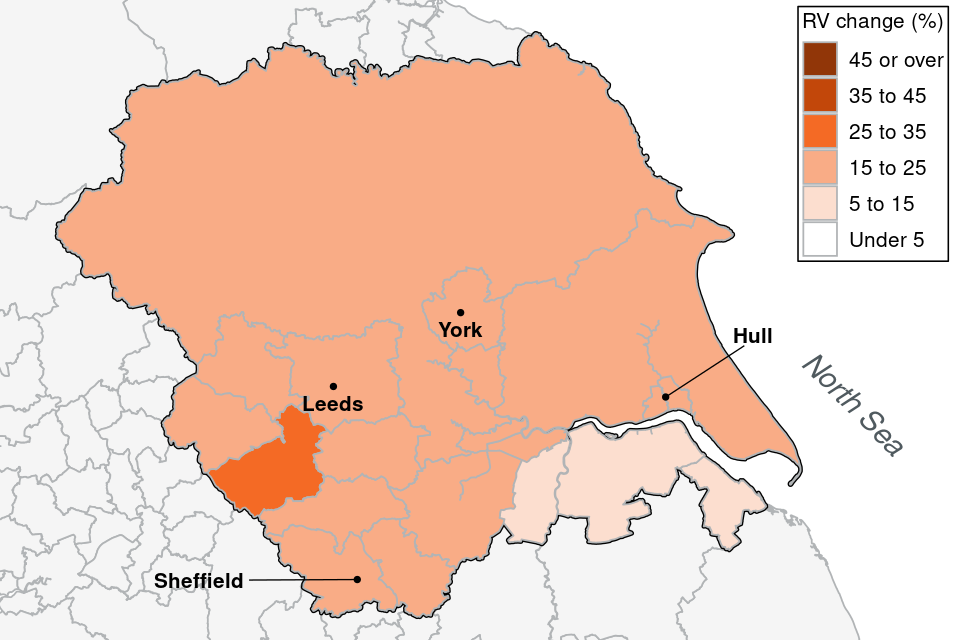
Source: NDR Revaluation 2023 compiled list (Table 2.2)
Figure 20: Percentage change in rateable value (RV) between 2017 and 2023 rating lists by administrative area, Yorkshire and the Humber, office sector
Source: NDR Revaluation 2023 compiled list (Table 2.3)
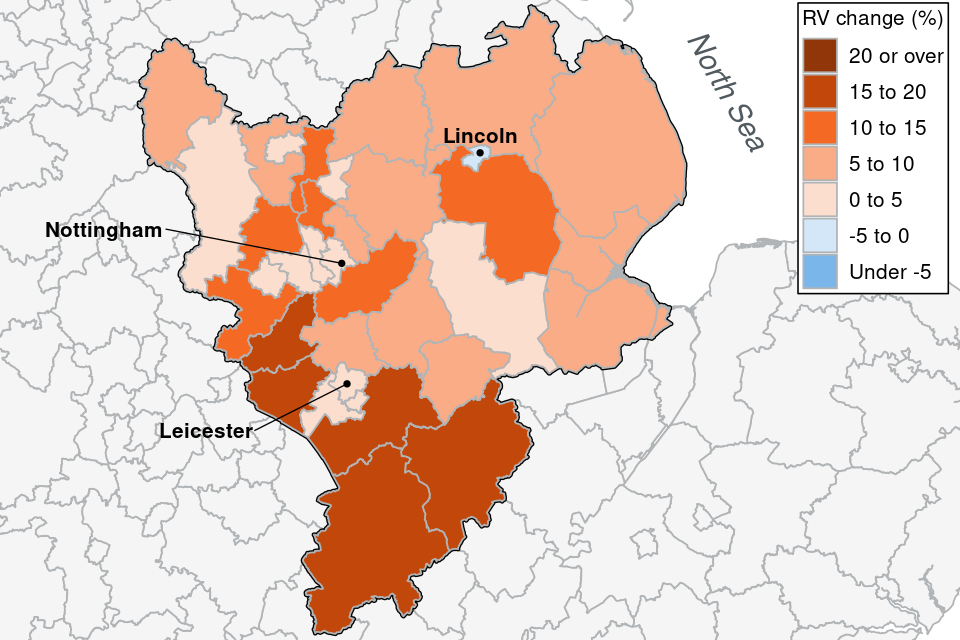
5. Change in rateable value within the East Midlands region
This section provides maps which show differences in the percentage change in rateable value from the 2017 local rating list to the 2023 list by administrative area across the East Midlands. This data, including the look-up for each administrative area, is also presented in Table A5 in the Appendix.
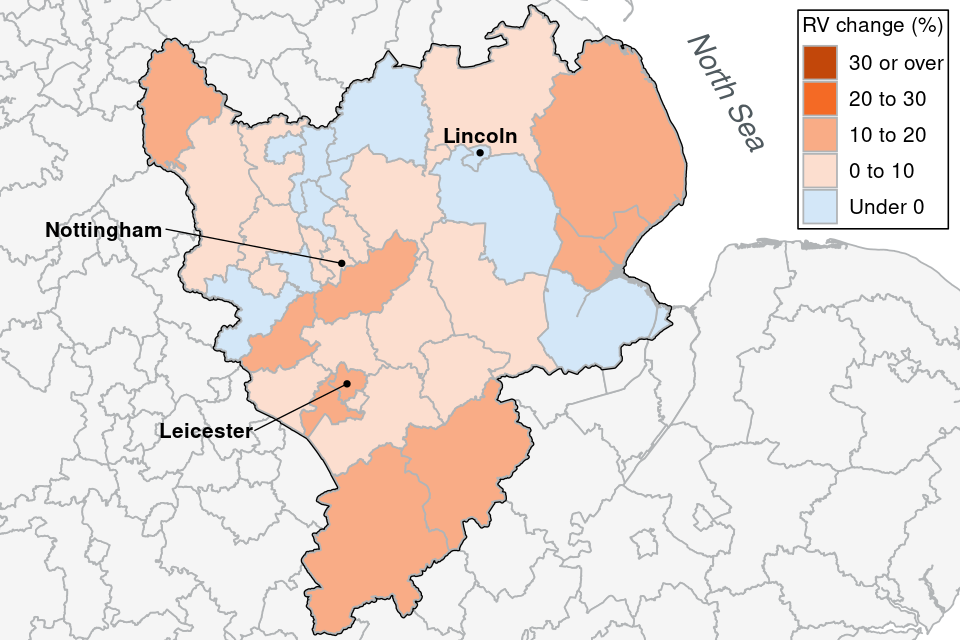
Figure 21: Percentage change in rateable value (RV) between 2017 and 2023 rating lists by administrative area, East Midlands, all sectors
Source: NDR Revaluation 2023 compiled list (Table 2.0)
Figure 22: Percentage change in rateable value (RV) between 2017 and 2023 rating lists by administrative area, East Midlands, retail sector
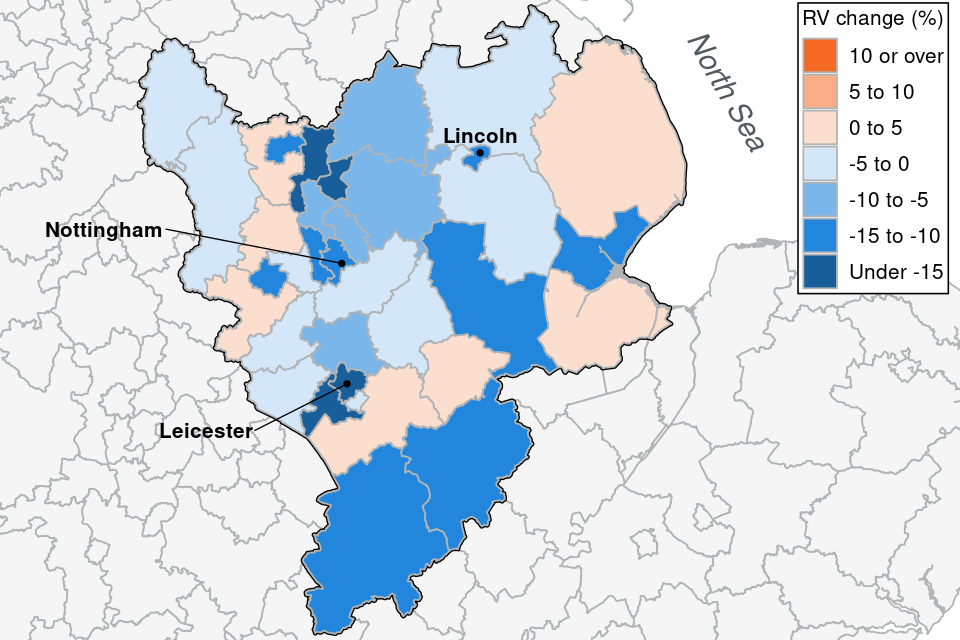
Source: NDR Revaluation 2023 compiled list (Table 2.1)
Figure 23: Percentage change in rateable value (RV) between 2017 and 2023 rating lists by administrative area, East Midlands, industry sector
Source: NDR Revaluation 2023 compiled list (Table 2.2)
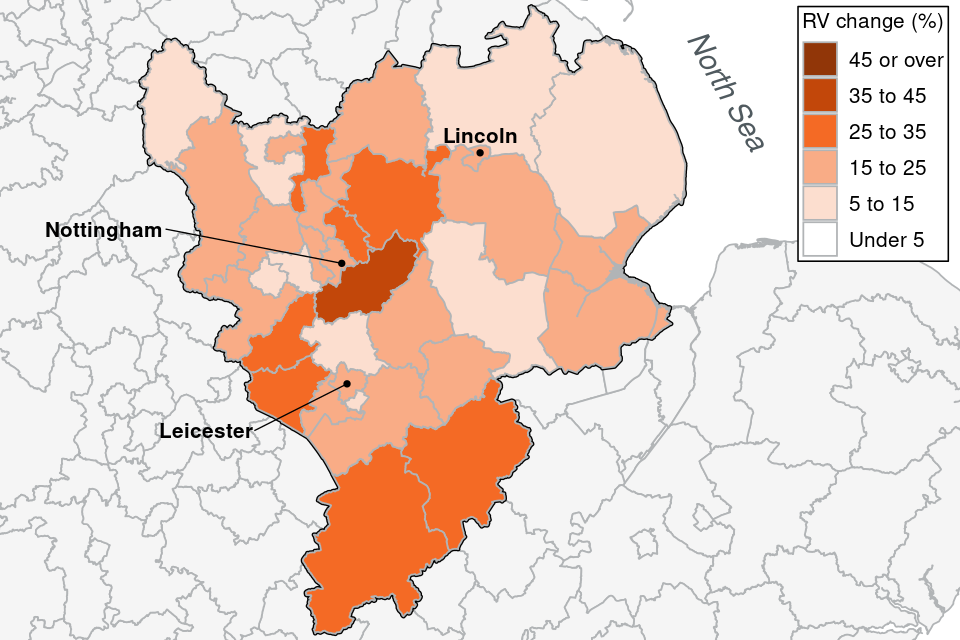
Figure 24: Percentage change in rateable value (RV) between 2017 and 2023 rating lists by administrative area, East Midlands, office sector
Source: NDR Revaluation 2023 compiled list (Table 2.3)
6. Change in rateable value within the West Midlands region
This section provides maps which show differences in the percentage change in rateable value from the 2017 local rating list to the 2023 list by administrative area across the West Midlands. This data, including the look-up for each administrative area, is also presented in Table A6 in the Appendix.
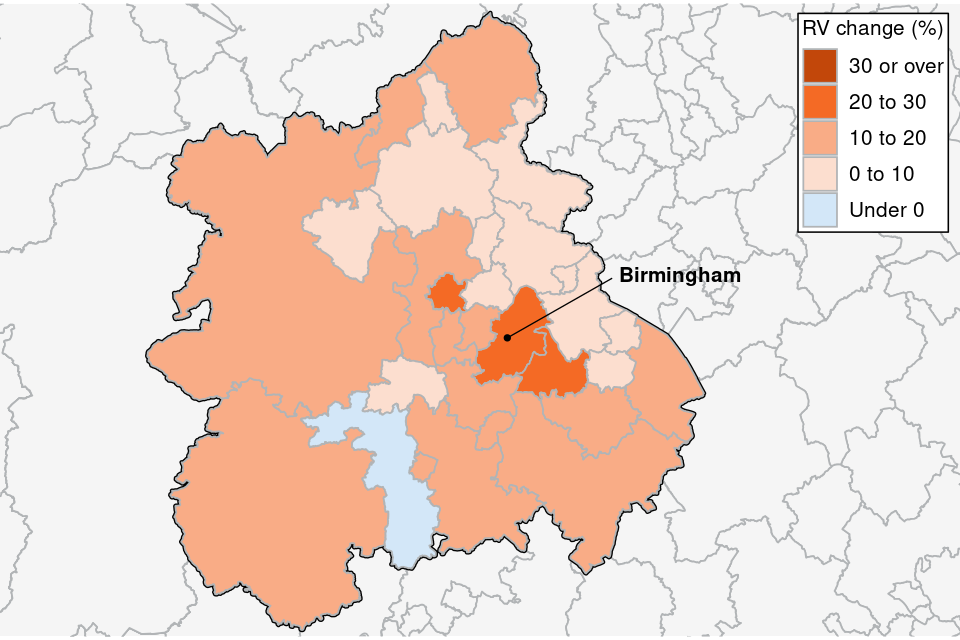
Figure 25: Percentage change in rateable value (RV) between 2017 and 2023 rating lists by administrative area, West Midlands, all sectors
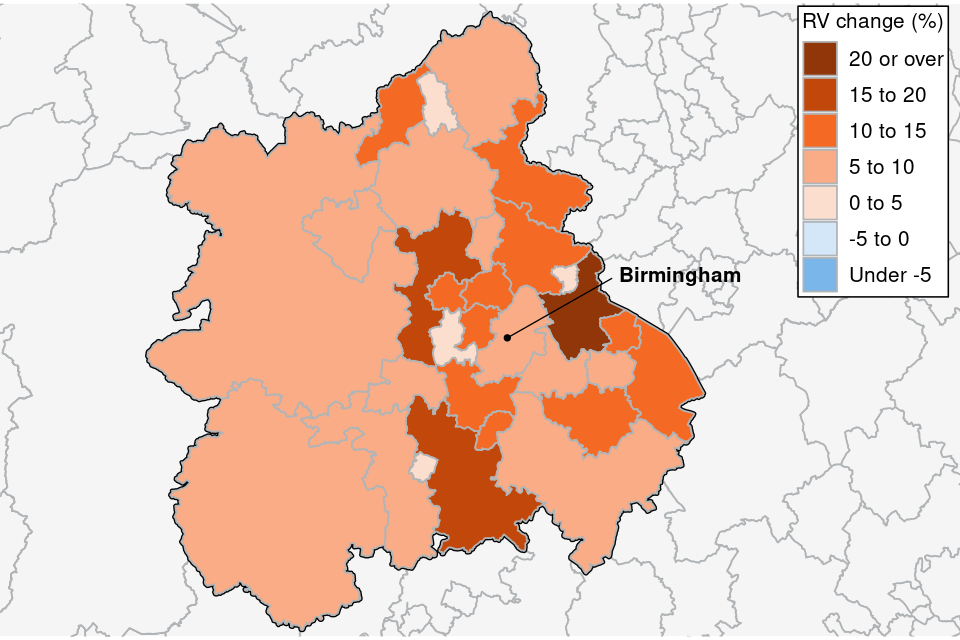
Source: NDR Revaluation 2023 compiled list (Table 2.0)
Figure 26: Percentage change in rateable value (RV) between 2017 and 2023 rating lists by administrative area, West Midlands, retail sector
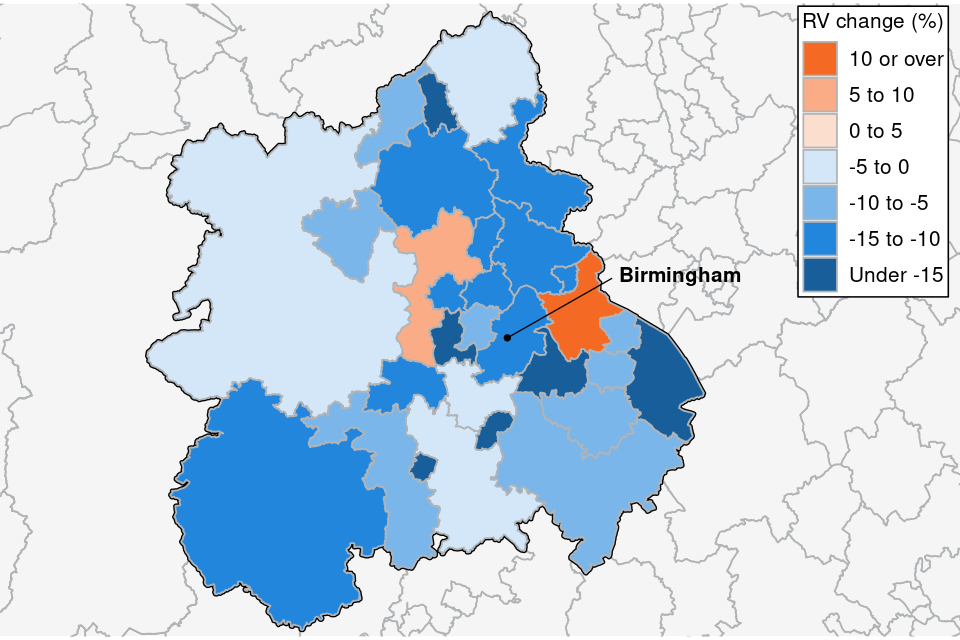
Source: NDR Revaluation 2023 compiled list (Table 2.1)
Figure 27: Percentage change in rateable value (RV) between 2017 and 2023 rating lists by administrative area, West Midlands, industry sector
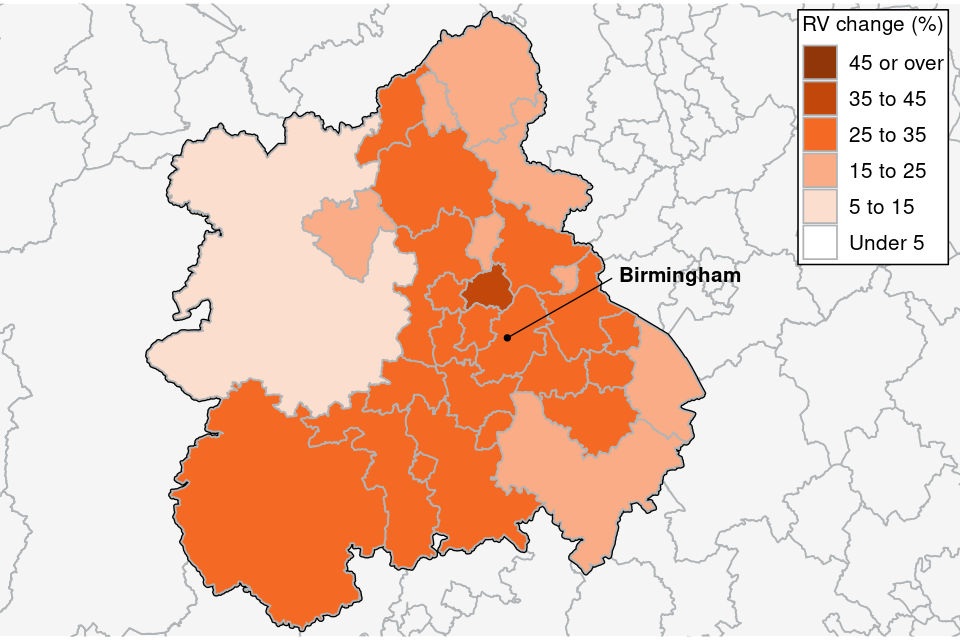
Source: NDR Revaluation 2023 compiled list (Table 2.2)
Figure 28: Percentage change in rateable value (RV) between 2017 and 2023 rating lists by administrative area, West Midlands, office sector
Source: NDR Revaluation 2023 compiled list (Table 2.3)
7. Change in rateable value within the East region
This section provides maps which show differences in the percentage change in rateable value from the 2017 local rating list to the 2023 list by administrative area across the East region. This data, including the look-up for each administrative area, is also presented in Table A7 in the Appendix.
Figure 29: Percentage change in rateable value (RV) between 2017 and 2023 rating lists by administrative area, East, all sectors
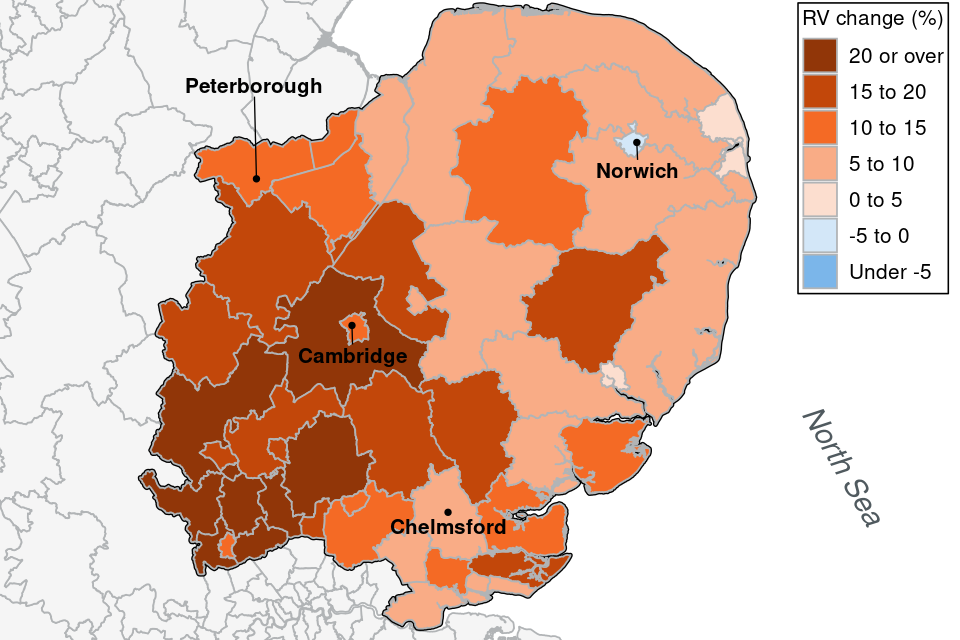
Source: NDR Revaluation 2023 compiled list (Table 2.0)
Figure 30: Percentage change in rateable value (RV) between 2017 and 2023 rating lists by administrative area, East, retail sector
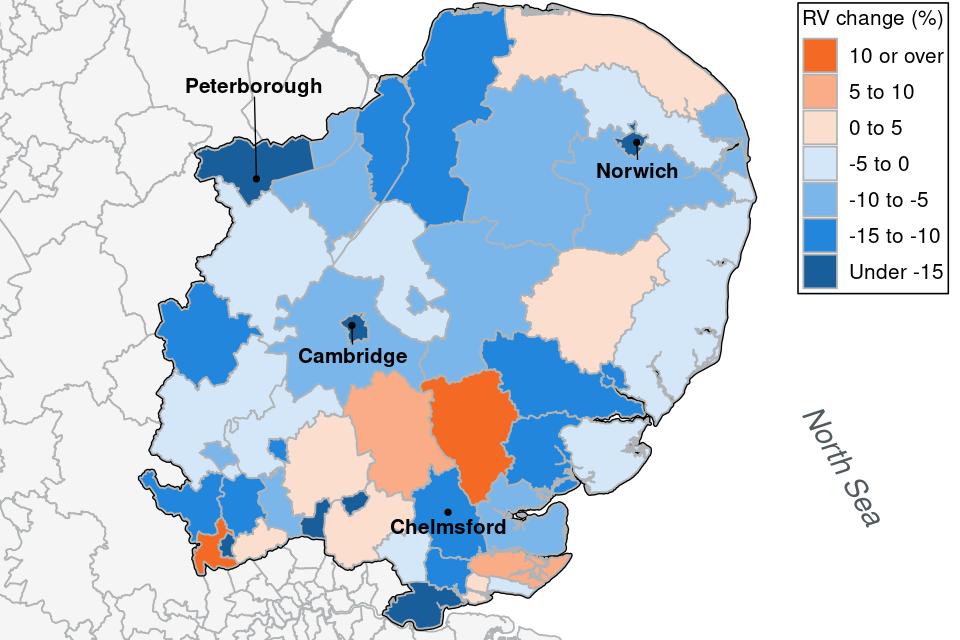
Source: NDR Revaluation 2023 compiled list (Table 2.1)
Figure 31: Percentage change in rateable value (RV) between 2017 and 2023 rating lists by administrative area, East, industry sector
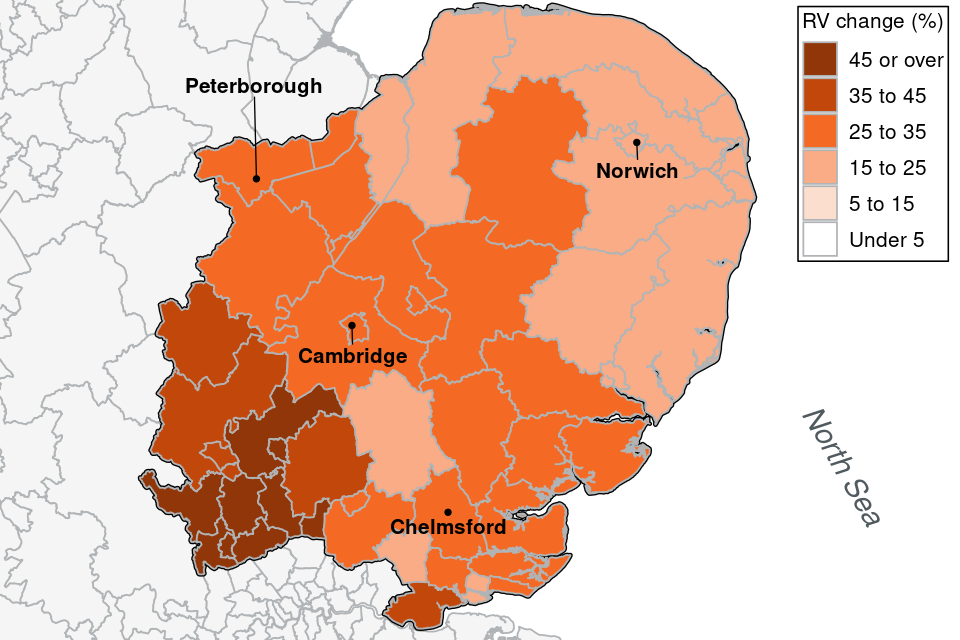
Source: NDR Revaluation 2023 compiled list (Table 2.2)
Figure 32: Percentage change in rateable value (RV) between 2017 and 2023 rating lists by administrative area, East, office sector
Source: NDR Revaluation 2023 compiled list (Table 2.3)
8. Change in rateable value within London region
This section provides maps which show differences in the percentage change in rateable value from the 2017 local rating list to the 2023 list by administrative area across London. This data, including the look-up for each administrative area, is also presented in Table A8 in the Appendix.
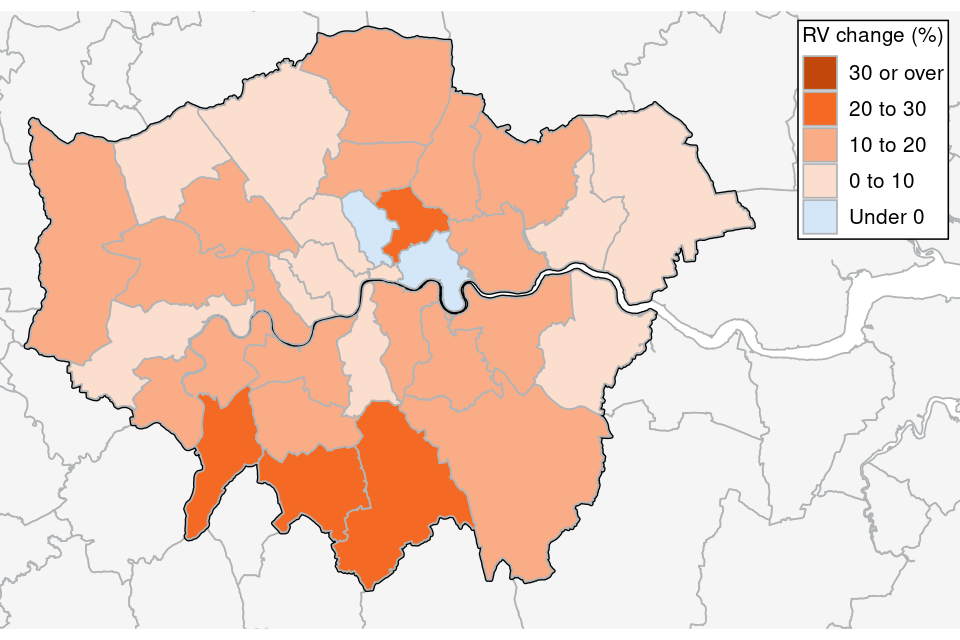
Figure 33: Percentage change in rateable value (RV) between 2017 and 2023 rating lists by administrative area, London, all sectors
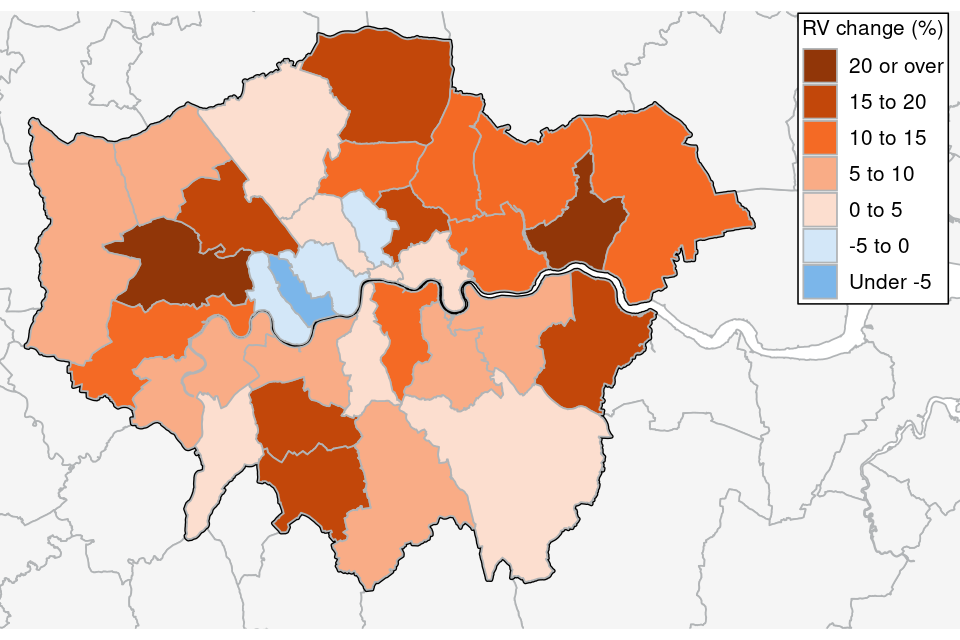
Source: NDR Revaluation 2023 compiled list (Table 2.0)
Figure 34: Percentage change in rateable value (RV) between 2017 and 2023 rating lists by administrative area, London, retail sector
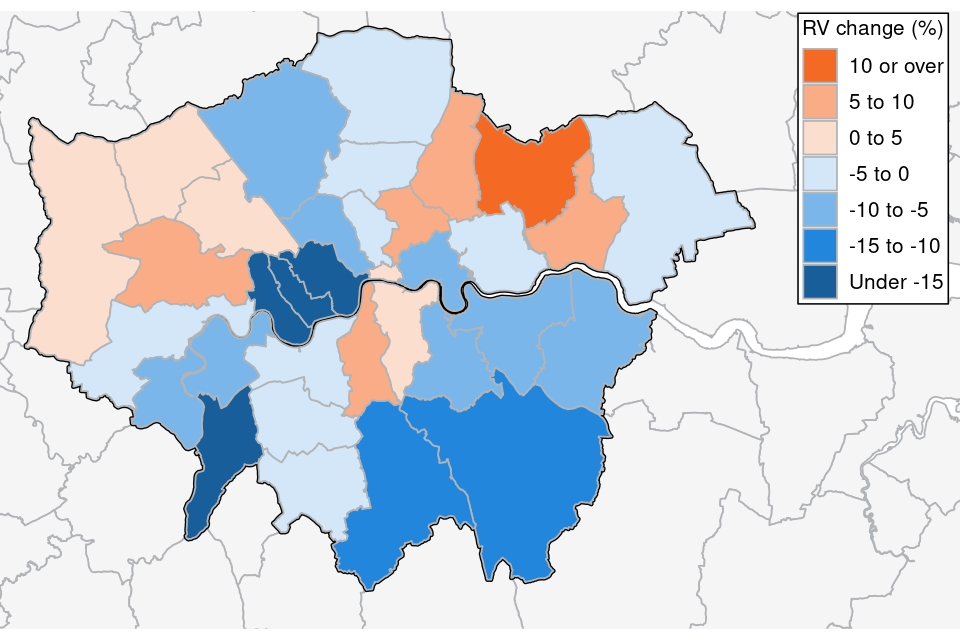
Source: NDR Revaluation 2023 compiled list (Table 2.1)
Figure 35: Percentage change in rateable value (RV) between 2017 and 2023 rating lists by administrative area, London, industry sector
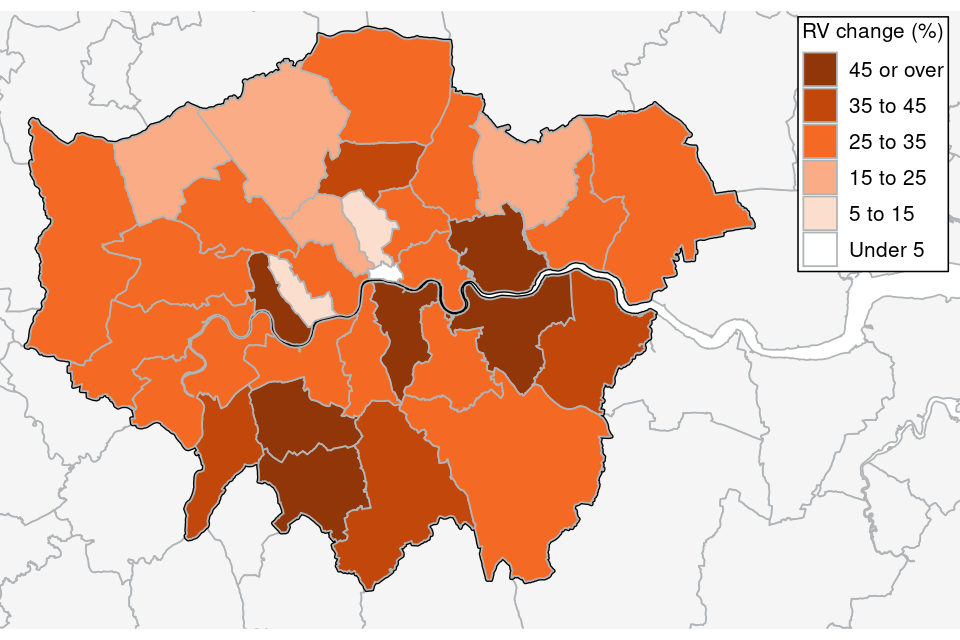
Source: NDR Revaluation 2023 compiled list (Table 2.2)
Figure 36: Percentage change in rateable value (RV) between 2017 and 2023 rating lists by administrative area, London, office sector
Source: NDR Revaluation 2023 compiled list (Table 2.3)
9. Change in rateable value within the South East region
This section provides maps which show differences in the percentage change in rateable value from the 2017 local rating list to the 2023 list by administrative area across the South East region. This data, including the look-up for each administrative area, is also presented in Table A9 in the Appendix.
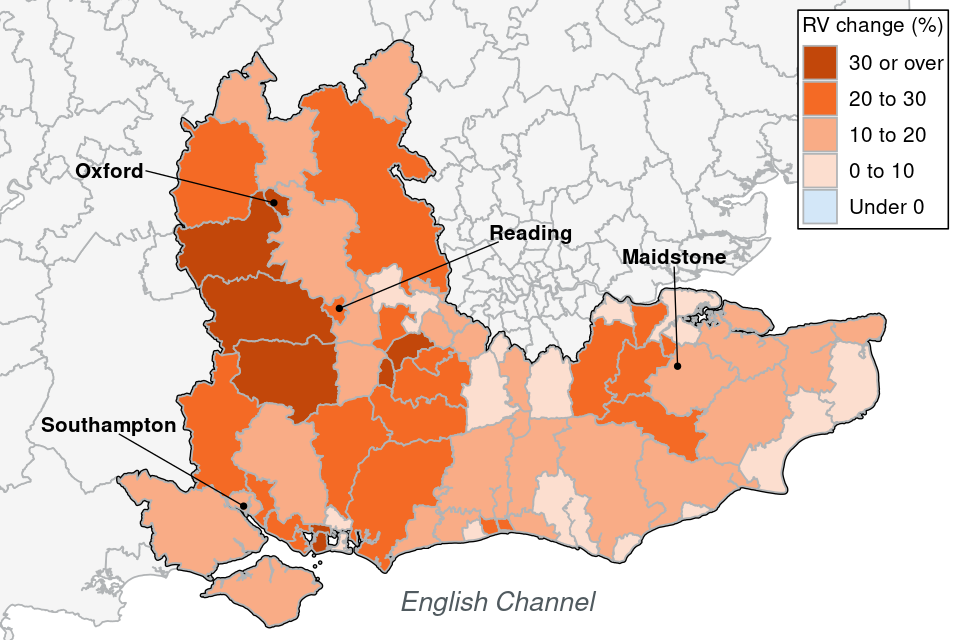
Figure 37: Percentage change in rateable value (RV) between 2017 and 2023 rating lists by administrative area, South East, all sectors
Source: NDR Revaluation 2023 compiled list (Table 2.0)
Figure 38: Percentage change in rateable value (RV) between 2017 and 2023 rating lists by administrative area, South East, retail sector
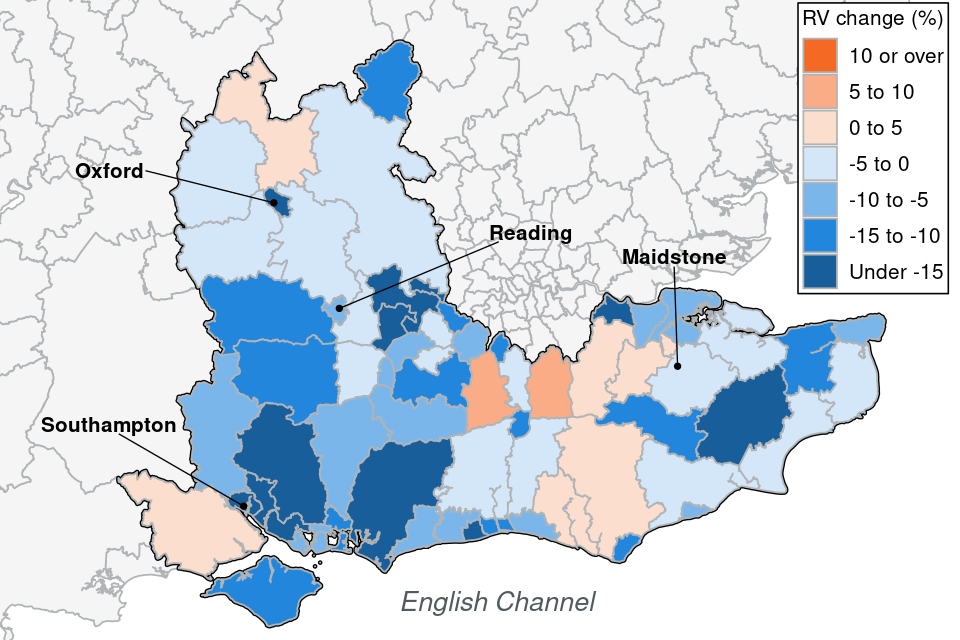
Source: NDR Revaluation 2023 compiled list (Table 2.1)
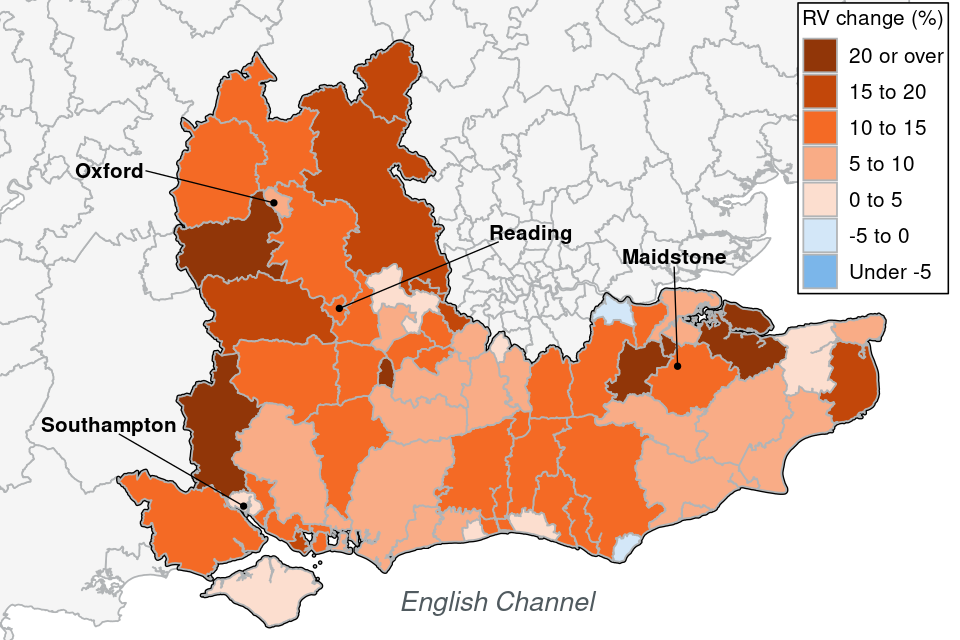
Figure 39: Percentage change in rateable value (RV) between 2017 and 2023 rating lists by administrative area, South East, industry sector
Source: NDR Revaluation 2023 compiled list (Table 2.2)
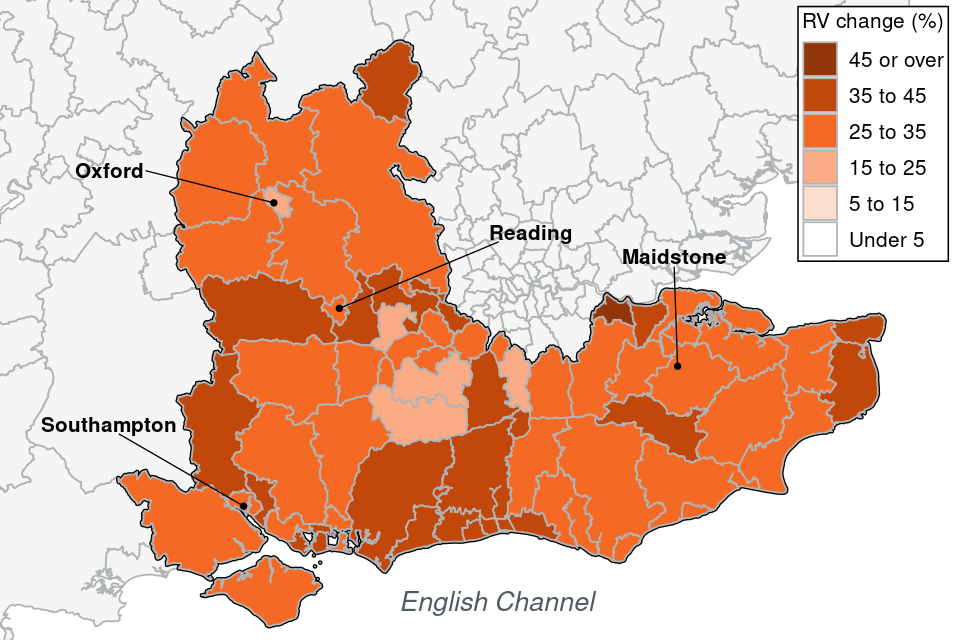
Figure 40: Percentage change in rateable value (RV) between 2017 and 2023 rating lists by administrative area, South East, office sector
Source: NDR Revaluation 2023 compiled list (Table 2.3)
10. Change in rateable value within the South West region
This section provides maps which show differences in the percentage change in rateable value from the 2017 local rating list to the 2023 list by administrative area across the South West region. This data, including the look-up for each administrative area, is also presented in Table A10 in the Appendix.
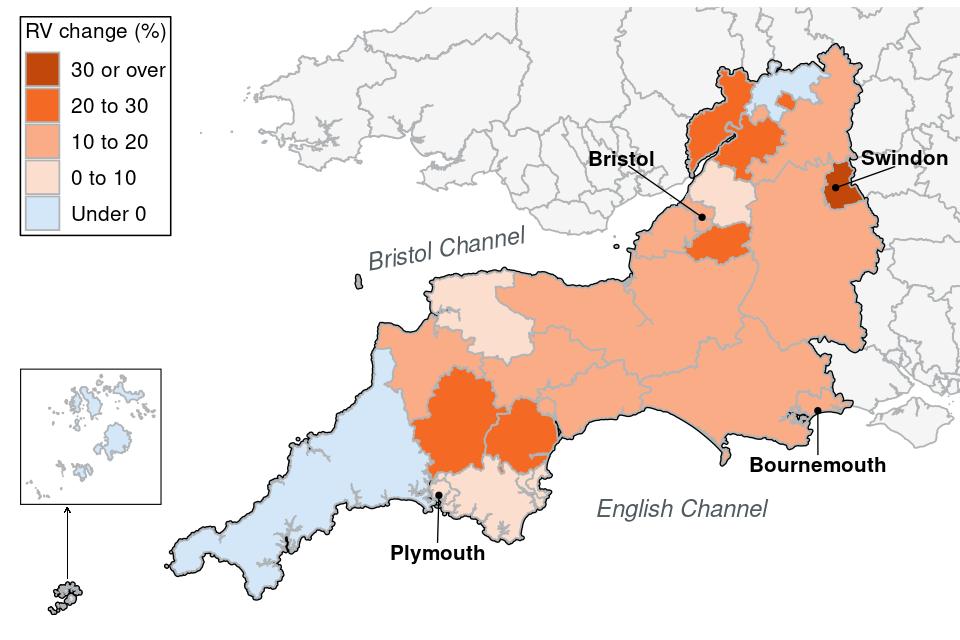
Figure 41: Percentage change in rateable value (RV) between 2017 and 2023 rating lists by administrative area, South West, all sectors
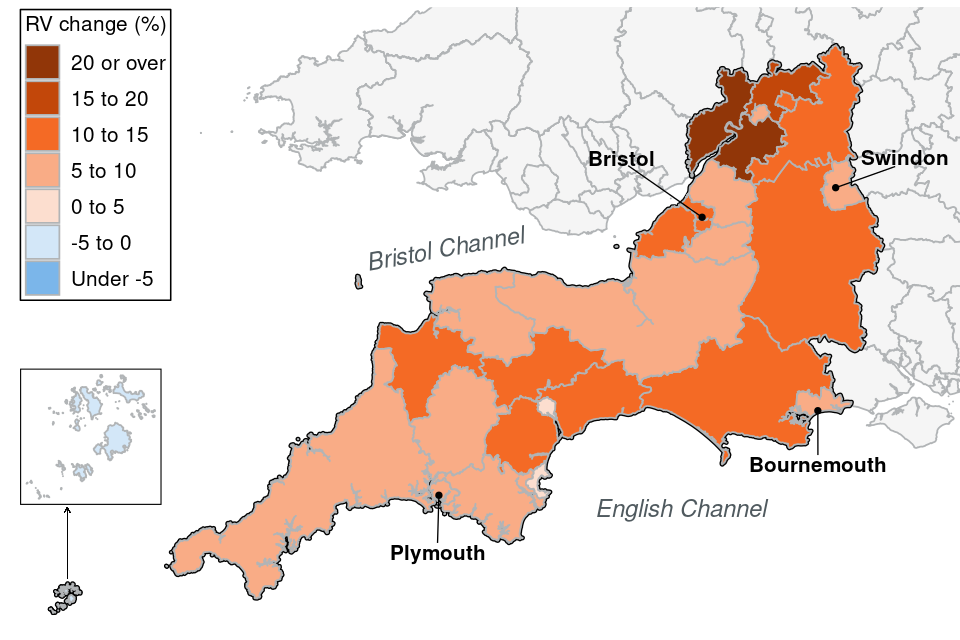
Source: NDR Revaluation 2023 compiled list (Table 2.0)
Figure 42: Percentage change in rateable value (RV) between 2017 and 2023 rating lists by administrative area, South West, retail sector
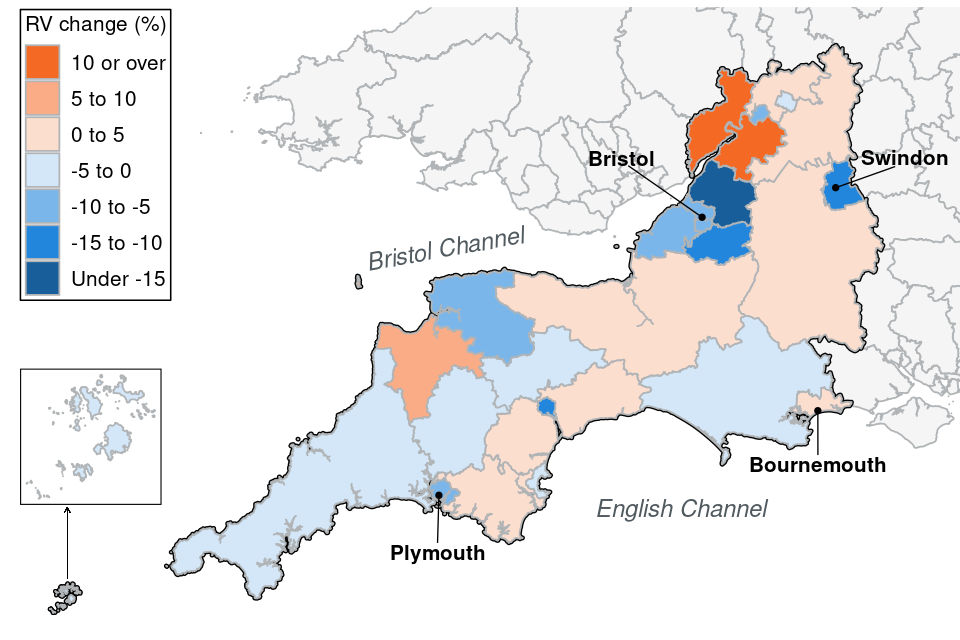
Source: NDR Revaluation 2023 compiled list (Table 2.1)
Figure 43: Percentage change in rateable value (RV) between 2017 and 2023 rating lists by administrative area, South West, industry sector
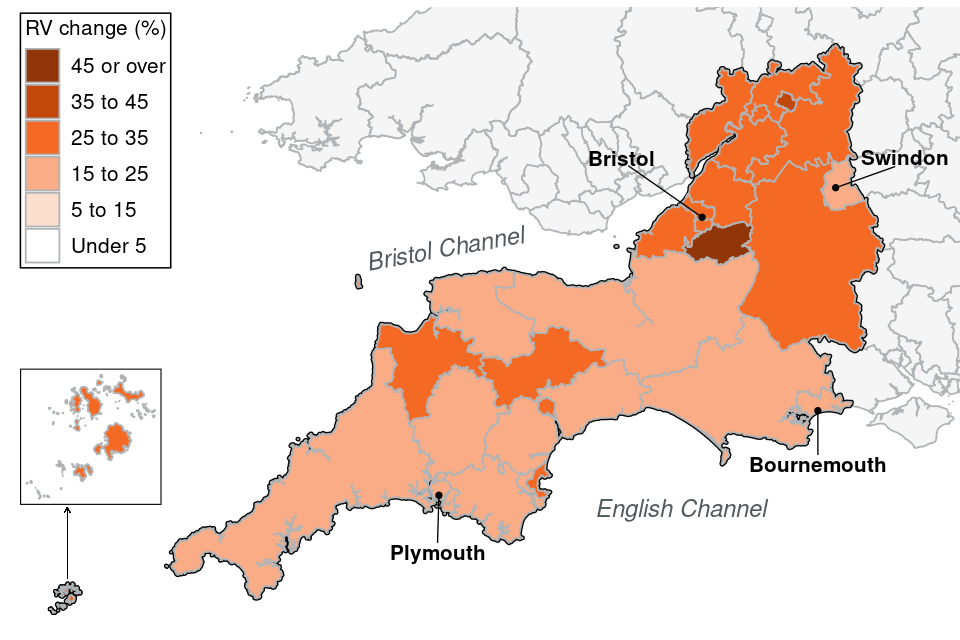
Source: NDR Revaluation 2023 compiled list (Table 2.2)
Figure 44: Percentage change in rateable value (RV) between 2017 and 2023 rating lists by administrative area, South West, office sector
Source: NDR Revaluation 2023 compiled list (Table 2.3)
11. Change in rateable value within Wales
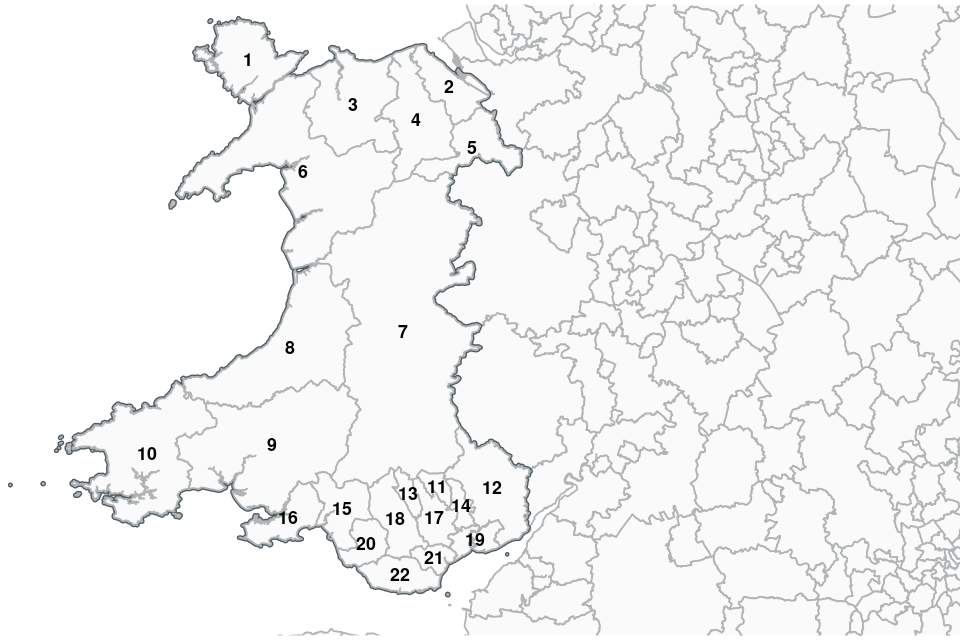
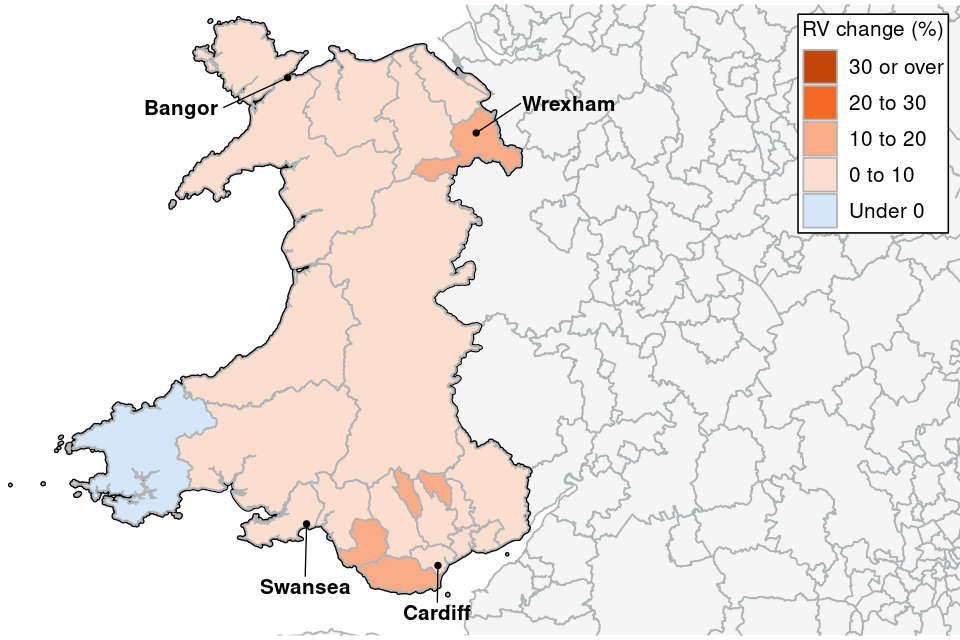
This section provides maps which show differences in the percentage change in rateable value from the 2017 local rating list to the 2023 list by administrative area across Wales. This data, including the look-up for each administrative area, is also presented in Table A11 in the Appendix.
Figure 45: Percentage change in rateable value (RV) by administrative area, Wales, all sectors
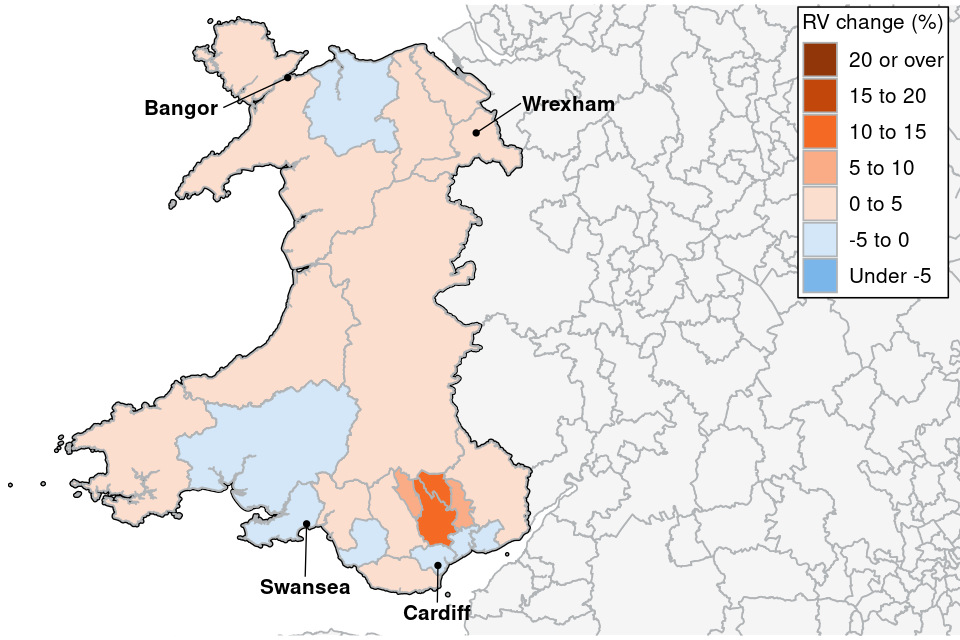
Source: NDR Revaluation 2023 compiled list (Table 2.0)
Figure 46: Percentage change in rateable value (RV) between 2017 and 2023 rating lists by administrative area, Wales, retail sector
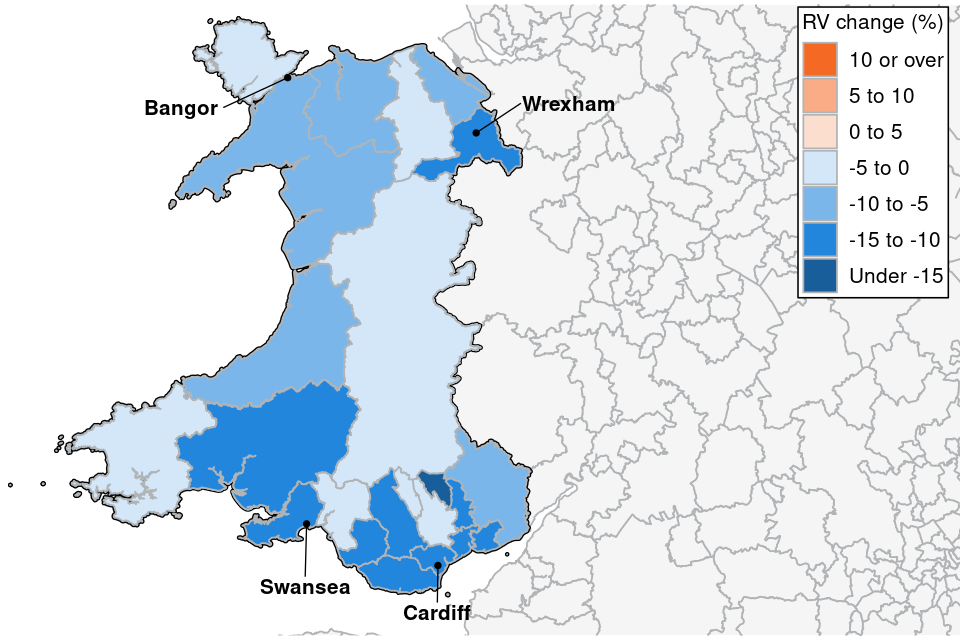
Source: NDR Revaluation 2023 compiled list (Table 2.1)
Figure 47: Percentage change in rateable value (RV) between 2017 and 2023 rating lists by administrative area, Wales, industry sector
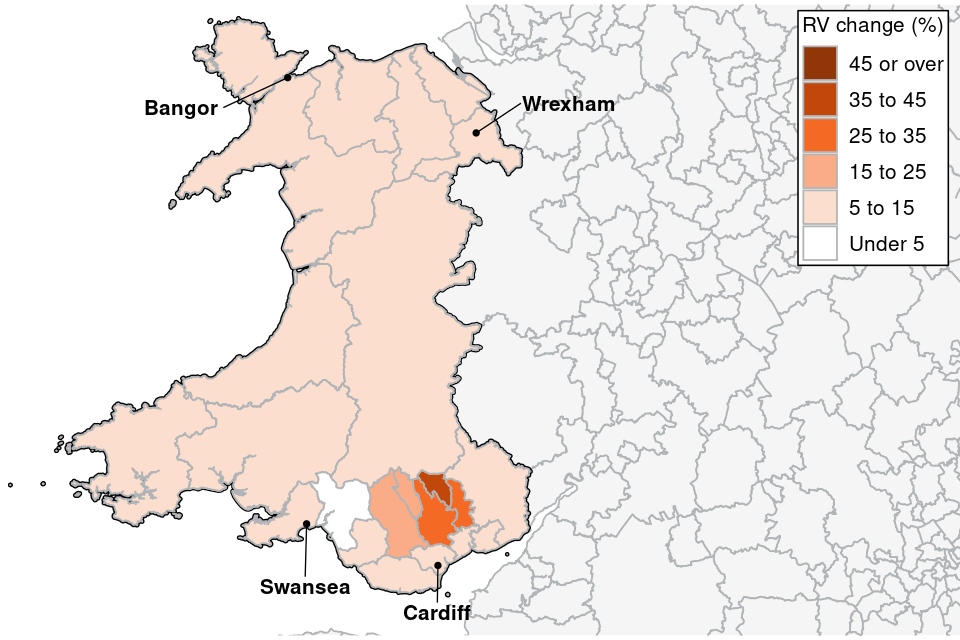
Source: NDR Revaluation 2023 compiled list (Table 2.2)
Figure 48: Percentage change in rateable value (RV) between 2017 and 2023 rating lists by administrative area, Wales, office sector
Source: NDR Revaluation 2023 compiled list (Table 2.3)
12. Further Information
The 2023 rating lists took effect from 1 April 2023.
We welcome feedback from users on the usefulness of the information provided in this summary. Please forward any comments to the Statistics Inbox.
Appendix
This appendix provides supporting information for the maps presented in this document. This includes:
- A data table showing the percentage change in rateable value in each sector and region of England and Wales to support the maps in section 1
- Data tables for each English region and Wales showing the percentage change in rateable value in each sector and administrative area in that region
- Supporting maps which label each administrative area with a number that corresponds to a key which can be found in the table for each region
England and Wales Appendix
Table A1: Percentage change in rateable value (RV) between 2017 and 2023 rating lists by region and sector in England and Wales
| Key | Area | Retail | Industry | Office | ‘Other’ | All |
| - | England and Wales | -10.0 | 27.2 | 10.5 | 4.5 | 7.2 |
| - | England | -10.0 | 27.8 | 10.5 | 4.6 | 7.4 |
| NE | North East | -13.6 | 19.5 | 8.7 | 2.0 | 2.6 |
| NW | North West | -9.7 | 23.4 | 17.4 | 5.7 | 7.6 |
| Y&H | Yorkshire and the Humber | -14.4 | 19.4 | 7.8 | 6.2 | 4.8 |
| EM | East Midlands | -10.3 | 23.2 | 5.7 | 6.4 | 8.8 |
| WM | West Midlands | -11.7 | 27.1 | 15.7 | 4.7 | 9.2 |
| E | East | -10.4 | 35.4 | 26.4 | 10.9 | 14.8 |
| L | London | -9.1 | 33.4 | 6.3 | -1.1 | 3.4 |
| SE | South East | -10.1 | 33.7 | 20.3 | 6.8 | 11.1 |
| SW | South West | -4.7 | 25.5 | 14.2 | 6.2 | 9.3 |
| W | Wales | -10.0 | 12.3 | 6.2 | 1.8 | 1.6 |
Source: NDR Revaluation 2023 compiled list (Table 1.0)
Back to England and Wales maps
North East Appendix
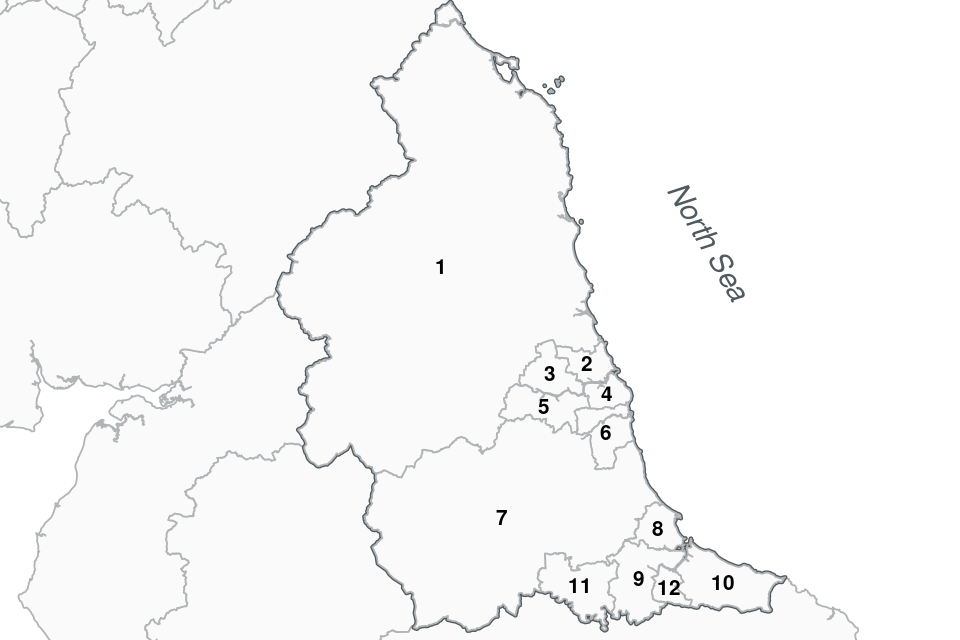
Table A2: Percentage change in rateable value (RV) between 2017 and 2023 rating lists by sector and administrative area in the North East, including administrative area key
| Key | Area | Retail | Industry | Office | ‘Other’ | All |
| 1 | Northumberland UA | -1.7 | 23.8 | 10.6 | 5.3 | 8.1 |
| 2 | North Tyneside | -8.6 | 21.0 | 20.4 | 4.0 | 7.6 |
| 3 | Newcastle upon Tyne | -22.7 | 16.5 | 10.3 | -4.8 | -5.3 |
| 4 | South Tyneside | -12.4 | 15.6 | 2.4 | 4.3 | 2.6 |
| 5 | Gateshead | -21.3 | 19.8 | 4.5 | -2.6 | -3.1 |
| 6 | Sunderland | -13.6 | 17.8 | 2.2 | -0.8 | 1.5 |
| 7 | County Durham UA | -7.1 | 15.5 | 3.0 | 5.1 | 4.8 |
| 8 | Hartlepool UA | -11.9 | 21.3 | 10.4 | -3.4 | -0.6 |
| 9 | Stockton-on-Tees UA | -12.8 | 18.6 | 3.7 | 8.5 | 5.6 |
| 10 | Redcar and Cleveland UA | -3.3 | 27.7 | 17.4 | 10.3 | 14.6 |
| 11 | Darlington UA | -11.4 | 20.9 | 6.4 | 2.2 | 3.6 |
| 12 | Middlesbrough UA | -18.5 | 21.8 | 6.6 | 4.4 | 0.5 |
Source: NDR Revaluation 2023 compiled list (Tables 2.0-2.4)
Figure A1: North East region map labelled with administrative area key
North West Appendix
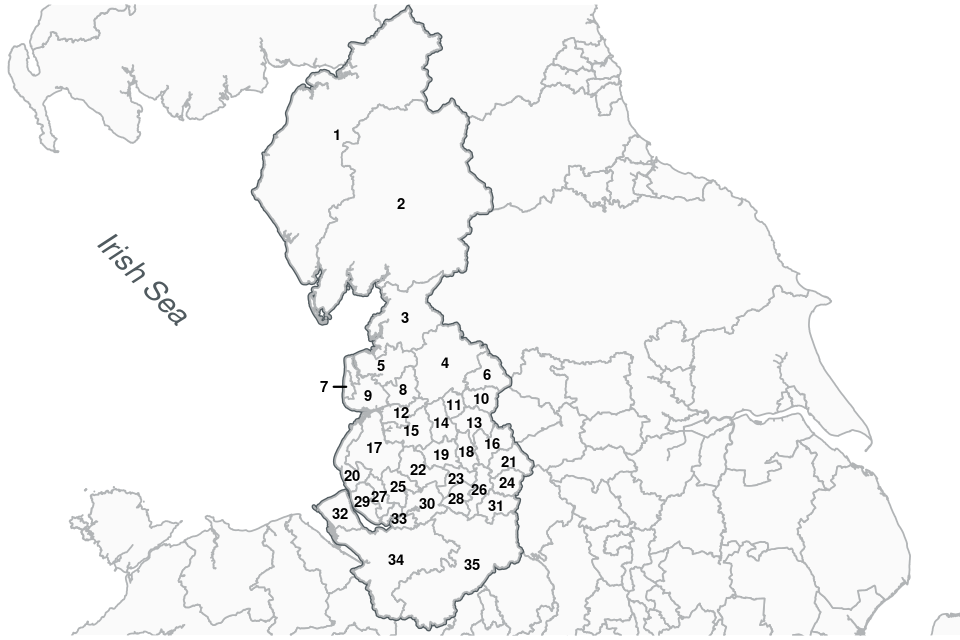
Table A3: Percentage change in rateable value (RV) between 2017 and 2023 rating lists by sector and administrative area in the North West, including administrative area key
| Key | Area | Retail | Industry | Office | ‘Other’ | All |
| 1 | Cumberland UA | -9.5 | 15.1 | 3.4 | 3.9 | 4.8 |
| 2 | Westmorland and Furness UA | -0.7 | 35.0 | 6.9 | -4.0 | 5.1 |
| 3 | Lancaster | -6.2 | 20.5 | 6.8 | 5.7 | 5.5 |
| 4 | Ribble Valley | 5.1 | 22.1 | 35.6 | 7.2 | 14.1 |
| 5 | Wyre | -0.9 | 23.8 | 25.9 | 13.3 | 12.3 |
| 6 | Pendle | 0.1 | 23.2 | 30.6 | 15.0 | 14.2 |
| 7 | Blackpool UA | -14.2 | 15.6 | 6.3 | -2.0 | -3.0 |
| 8 | Preston | -17.5 | 19.9 | 18.4 | 7.2 | 2.7 |
| 9 | Fylde | -0.4 | 11.4 | 6.7 | 6.0 | 6.0 |
| 10 | Burnley | -14.2 | 27.1 | 10.3 | 12.3 | 10.3 |
| 11 | Hyndburn | -5.7 | 26.2 | 10.9 | 12.4 | 13.2 |
| 12 | South Ribble | -5.8 | 24.4 | 33.8 | 14.8 | 15.7 |
| 13 | Rossendale | -3.1 | 26.6 | 19.8 | 17.1 | 15.1 |
| 14 | Blackburn with Darwen UA | -10.9 | 20.1 | 7.9 | 9.9 | 8.4 |
| 15 | Chorley | -6.2 | 31.2 | 30.5 | 11.1 | 13.3 |
| 16 | Rochdale | -6.4 | 28.1 | 4.9 | 12.1 | 14.9 |
| 17 | West Lancashire | -5.2 | 21.5 | 40.8 | 12.0 | 14.4 |
| 18 | Bury | -9.9 | 15.8 | 17.0 | 8.4 | 4.5 |
| 19 | Bolton | -7.3 | 18.6 | 10.6 | 7.1 | 6.7 |
| 20 | Sefton | -13.3 | 25.4 | 17.0 | 6.3 | 3.6 |
| 21 | Oldham | -10.0 | 18.0 | 23.9 | 9.0 | 7.9 |
| 22 | Wigan | -9.3 | 20.6 | 11.4 | 9.3 | 7.6 |
| 23 | Salford | -10.0 | 31.2 | 30.5 | 8.4 | 16.3 |
| 24 | Tameside | -11.8 | 24.0 | 9.6 | 12.5 | 7.5 |
| 25 | St. Helens | -13.8 | 26.4 | 6.5 | 9.9 | 10.2 |
| 26 | Manchester | -7.2 | 28.8 | 26.1 | 0.1 | 8.7 |
| 27 | Knowsley | -2.3 | 22.7 | 12.2 | 18.2 | 16.2 |
| 28 | Trafford | -22.1 | 27.5 | 12.5 | 8.8 | 2.4 |
| 29 | Liverpool | -11.0 | 23.7 | 14.3 | 4.8 | 3.8 |
| 30 | Warrington UA | -13.9 | 25.6 | 8.3 | 6.7 | 8.3 |
| 31 | Stockport | -2.6 | 25.4 | 19.1 | 8.0 | 10.8 |
| 32 | Wirral | -8.8 | 21.6 | 3.4 | 7.5 | 4.9 |
| 33 | Halton UA | -6.8 | 24.3 | 11.9 | 3.1 | 12.4 |
| 34 | Cheshire West and Chester UA | -14.1 | 22.2 | 6.0 | 7.6 | 3.9 |
| 35 | Cheshire East UA | -1.3 | 20.3 | 8.8 | 4.8 | 8.6 |
Source: NDR Revaluation 2023 compiled list (Tables 2.0-2.4)
Figure A2: North West region map labelled with administrative area key
Yorkshire and the Humber Appendix
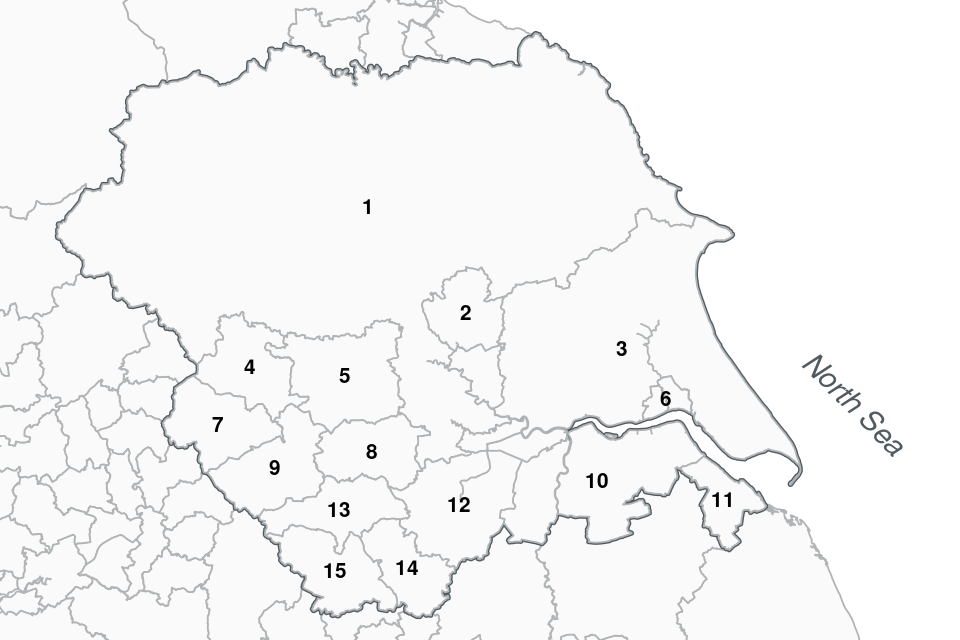
Table A4: Percentage change in rateable value (RV) between 2017 and 2023 rating lists by sector and administrative area in Yorkshire and the Humber, including administrative area key
| Key | Area | Retail | Industry | Office | ‘Other’ | All |
| 1 | North Yorkshire UA | -9.7 | 18.3 | 6.9 | 5.4 | 5.3 |
| 2 | York UA | -20.1 | 19.5 | 11.6 | 1.9 | -3.6 |
| 3 | East Riding of Yorkshire UA | -6.5 | 21.2 | -4.9 | 10.3 | 9.5 |
| 4 | Bradford | -13.9 | 16.7 | -8.6 | 8.4 | 3.1 |
| 5 | Leeds | -16.9 | 22.1 | 12.1 | 4.4 | 4.5 |
| 6 | Kingston upon Hull, City of UA | -16.7 | 17.4 | -4.0 | 5.0 | 1.2 |
| 7 | Calderdale | -7.5 | 17.1 | 1.1 | 8.0 | 6.8 |
| 8 | Wakefield | -14.9 | 19.9 | 2.8 | 5.5 | 7.7 |
| 9 | Kirklees | -14.1 | 25.1 | 3.2 | 8.6 | 6.7 |
| 10 | North Lincolnshire UA | -11.2 | 13.1 | 1.0 | 3.6 | 5.9 |
| 11 | North East Lincolnshire UA | -13.0 | 13.3 | -7.7 | 6.0 | 3.1 |
| 12 | Doncaster | -8.3 | 24.8 | 8.6 | 6.9 | 10.8 |
| 13 | Barnsley | -7.2 | 21.7 | 9.5 | 12.8 | 11.4 |
| 14 | Rotherham | -8.1 | 16.7 | 16.1 | 8.4 | 7.9 |
| 15 | Sheffield | -20.3 | 19.2 | 12.9 | 6.7 | 0.1 |
Source: NDR Revaluation 2023 compiled list (Tables 2.0-2.4)
Figure A3: Yorkshire and the Humber region map labelled with administrative area key
Back to Yorkshire and the Humber maps
East Midlands Appendix
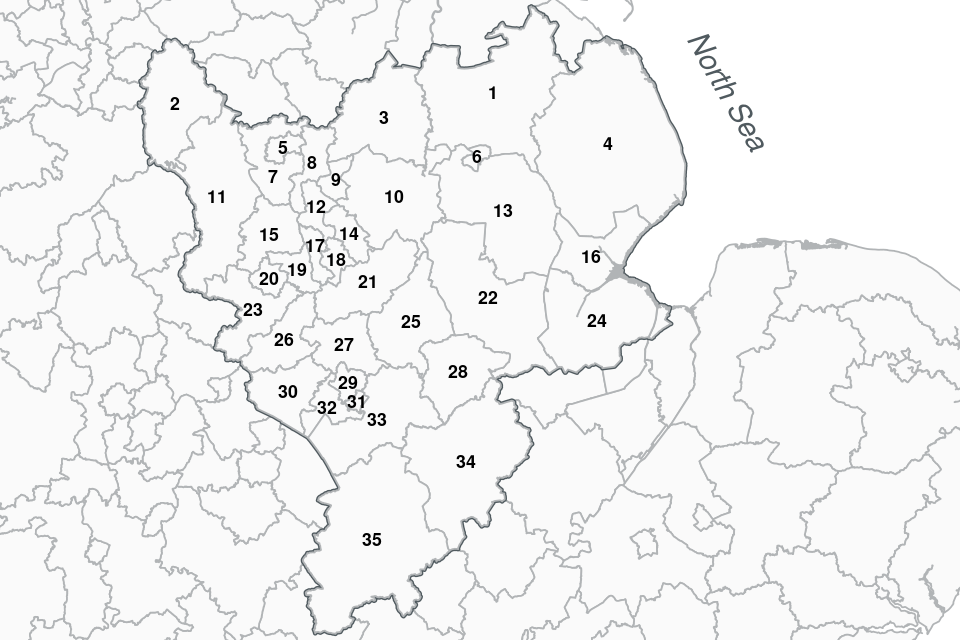
Table A5: Percentage change in rateable value (RV) between 2017 and 2023 rating lists by sector and administrative area in the East Midlands, including administrative area key
| Key | Area | Retail | Industry | Office | ‘Other’ | All |
| 1 | West Lindsey | -0.7 | 14.9 | 1.5 | 7.5 | 8.0 |
| 2 | High Peak | -2.1 | 14.8 | 11.5 | 4.5 | 8.2 |
| 3 | Bassetlaw | -6.7 | 21.0 | -0.3 | 3.5 | 8.4 |
| 4 | East Lindsey | 1.2 | 14.3 | 11.0 | 8.2 | 7.8 |
| 5 | Chesterfield | -11.6 | 17.9 | -0.5 | 7.0 | 4.3 |
| 6 | Lincoln | -13.8 | 21.2 | -2.0 | 2.2 | -2.2 |
| 7 | North East Derbyshire | 4.0 | 14.2 | 0.9 | 7.3 | 9.3 |
| 8 | Bolsover | -26.0 | 27.3 | -0.7 | 10.0 | 11.7 |
| 9 | Mansfield | -20.2 | 23.5 | -1.6 | 8.4 | 0.6 |
| 10 | Newark and Sherwood | -5.2 | 25.9 | 8.5 | 0.2 | 7.3 |
| 11 | Derbyshire Dales | -4.7 | 18.9 | 5.3 | -2.6 | 3.0 |
| 12 | Ashfield | -5.7 | 20.4 | -2.0 | 10.8 | 11.7 |
| 13 | North Kesteven | -1.6 | 17.0 | -7.4 | 15.9 | 12.1 |
| 14 | Gedling | -8.0 | 27.7 | 6.1 | 9.2 | 7.3 |
| 15 | Amber Valley | 2.2 | 18.7 | 7.1 | 8.4 | 11.7 |
| 16 | Boston | -11.5 | 16.3 | 15.1 | 9.6 | 5.1 |
| 17 | Broxtowe | -13.2 | 22.9 | 9.5 | 8.3 | 3.1 |
| 18 | Nottingham UA | -12.3 | 19.1 | 1.7 | 5.0 | 1.5 |
| 19 | Erewash | -2.0 | 8.5 | -1.4 | 4.0 | 4.1 |
| 20 | Derby UA | -10.3 | 13.5 | 8.1 | 4.3 | 3.0 |
| 21 | Rushcliffe | -2.7 | 36.4 | 10.7 | 3.8 | 10.5 |
| 22 | South Kesteven | -12.4 | 12.3 | 3.4 | 6.5 | 2.5 |
| 23 | South Derbyshire | 0.9 | 17.7 | -4.8 | 8.7 | 11.9 |
| 24 | South Holland | 2.6 | 15.1 | -1.7 | 1.0 | 6.3 |
| 25 | Melton | -4.7 | 17.9 | 5.7 | 4.2 | 7.9 |
| 26 | North West Leicestershire | -4.7 | 28.2 | 10.8 | -8.2 | 18.0 |
| 27 | Charnwood | -7.7 | 13.8 | 2.1 | 12.3 | 7.0 |
| 28 | Rutland UA | 3.1 | 16.9 | 6.3 | 6.9 | 9.8 |
| 29 | Leicester UA | -15.2 | 20.9 | 10.5 | 7.2 | 4.1 |
| 30 | Hinckley and Bosworth | -3.3 | 25.3 | 2.8 | 7.3 | 15.6 |
| 31 | Oadby and Wigston | -4.1 | 8.0 | 3.2 | 7.2 | 3.3 |
| 32 | Blaby | -26.9 | 19.7 | 11.1 | 8.0 | 0.8 |
| 33 | Harborough | 3.3 | 24.1 | 4.6 | 9.2 | 17.7 |
| 34 | North Northamptonshire UA | -11.9 | 34.1 | 14.8 | 10.6 | 19.0 |
| 35 | West Northamptonshire UA | -13.8 | 30.0 | 11.8 | 8.8 | 16.4 |
Source: NDR Revaluation 2023 compiled list (Tables 2.0-2.4)
Figure A4: East Midlands region map labelled with administrative area key
West Midlands Appendix
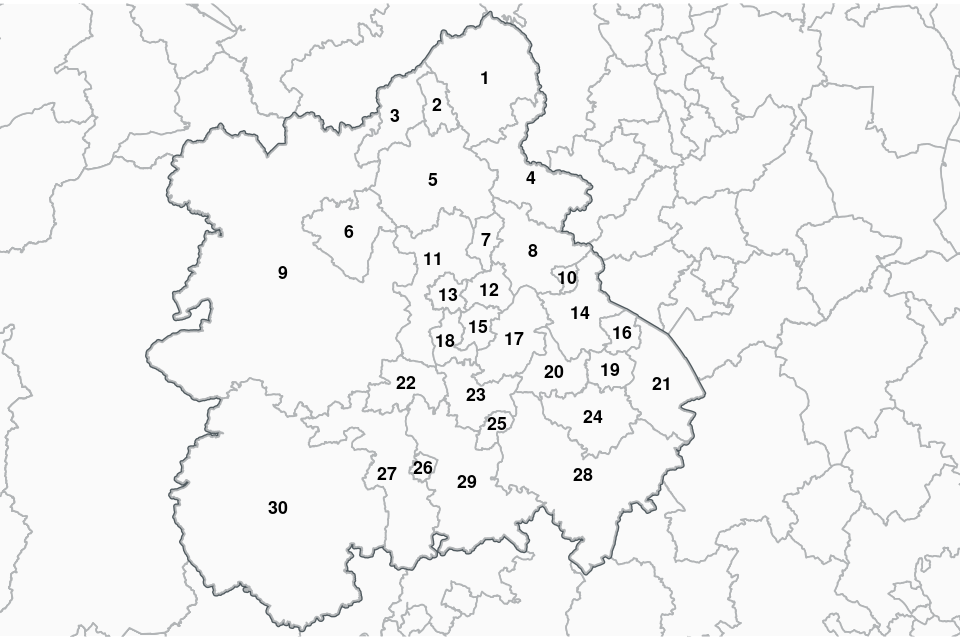
Table A6: Percentage change in rateable value (RV) between 2017 and 2023 rating lists by sector and administrative area in the West Midlands, including administrative area key
| Key | Area | Retail | Industry | Office | ‘Other’ | All |
| 1 | Staffordshire Moorlands | -2.5 | 23.7 | 15.6 | -4.8 | 5.1 |
| 2 | Stoke-on-Trent UA | -19.8 | 22.0 | 7.5 | 6.6 | 4.3 |
| 3 | Newcastle-under-Lyme | -5.5 | 29.2 | 11.2 | 5.7 | 12.3 |
| 4 | East Staffordshire | -12.0 | 22.9 | 6.2 | 6.1 | 10.3 |
| 5 | Stafford | -12.1 | 26.6 | 6.2 | 6.6 | 8.3 |
| 6 | Telford and Wrekin UA | -9.3 | 19.1 | 8.2 | 6.1 | 7.3 |
| 7 | Cannock Chase | -15.0 | 23.7 | 8.7 | 5.0 | 5.6 |
| 8 | Lichfield | -10.8 | 26.6 | 8.0 | 5.8 | 12.1 |
| 9 | Shropshire UA | -3.6 | 14.4 | 11.7 | 5.4 | 5.7 |
| 10 | Tamworth | -14.7 | 21.1 | 7.2 | 2.1 | 4.3 |
| 11 | South Staffordshire | 5.2 | 26.9 | 12.1 | 6.8 | 16.9 |
| 12 | Walsall | -12.6 | 37.0 | 5.5 | 7.5 | 12.8 |
| 13 | Wolverhampton | -13.8 | 32.5 | 21.9 | 10.4 | 11.9 |
| 14 | North Warwickshire | 11.3 | 32.6 | 7.8 | 5.2 | 25.1 |
| 15 | Sandwell | -9.3 | 30.0 | 11.8 | 4.8 | 13.9 |
| 16 | Nuneaton and Bedworth | -6.2 | 25.5 | 9.6 | 5.9 | 12.5 |
| 17 | Birmingham | -10.5 | 27.4 | 20.2 | 4.2 | 8.7 |
| 18 | Dudley | -23.7 | 30.8 | 11.1 | 4.6 | 3.9 |
| 19 | Coventry | -8.2 | 25.4 | 5.7 | 8.7 | 8.8 |
| 20 | Solihull | -16.7 | 26.5 | 27.7 | -4.4 | 5.2 |
| 21 | Rugby | -17.1 | 24.2 | 10.2 | 5.6 | 11.5 |
| 22 | Wyre Forest | -13.3 | 33.2 | 9.2 | 7.5 | 8.7 |
| 23 | Bromsgrove | -0.7 | 28.6 | 17.4 | 4.7 | 13.6 |
| 24 | Warwick | -6.6 | 31.2 | 10.7 | 6.6 | 11.5 |
| 25 | Redditch | -16.1 | 33.2 | 15.3 | 6.8 | 12.2 |
| 26 | Worcester | -17.0 | 27.2 | 17.8 | 5.0 | 3.8 |
| 27 | Malvern Hills | -7.3 | 29.3 | -3.6 | 4.7 | 7.1 |
| 28 | Stratford-on-Avon | -9.1 | 20.3 | 17.6 | -2.9 | 6.2 |
| 29 | Wychavon | -3.4 | 32.3 | 11.1 | 4.7 | 15.8 |
| 30 | Herefordshire, County of UA | -10.5 | 30.8 | 12.8 | 5.6 | 8.7 |
Source: NDR Revaluation 2023 compiled list (Tables 2.0-2.4)
Figure A5: West Midlands region map labelled with administrative area key
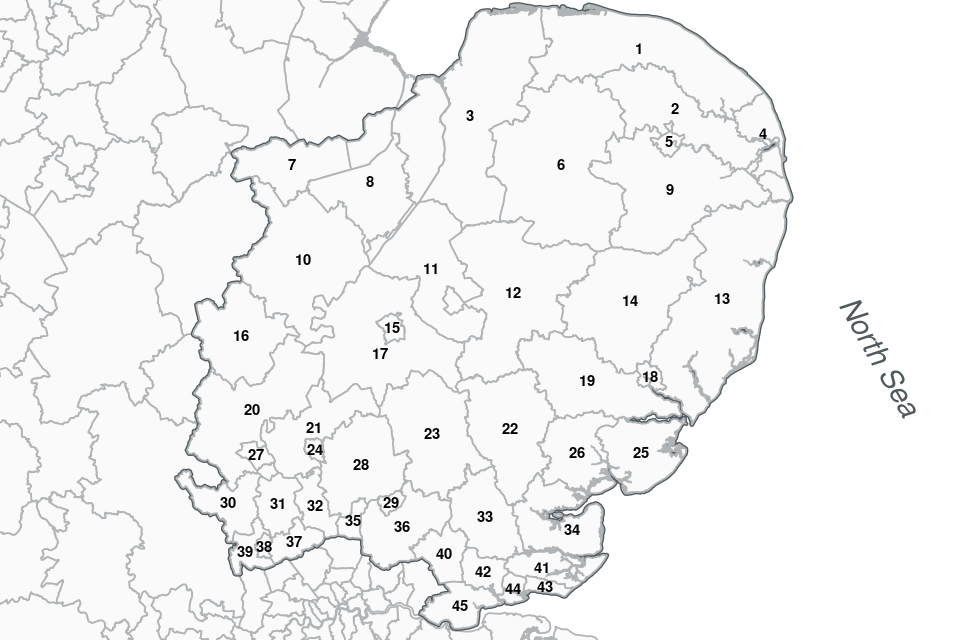
East Appendix
Table A7: Percentage change in rateable value (RV) between 2017 and 2023 rating lists by sector and administrative area in the East, including administrative area key
| Key | Area | Retail | Industry | Office | ‘Other’ | All |
| 1 | North Norfolk | 4.3 | 22.2 | 6.0 | 2.1 | 6.6 |
| 2 | Broadland | -2.5 | 18.5 | 12.1 | 8.1 | 9.6 |
| 3 | King’s Lynn and West Norfolk | -11.6 | 22.0 | 0.5 | 9.5 | 7.4 |
| 4 | Great Yarmouth | -8.6 | 20.1 | 9.7 | 1.3 | 3.6 |
| 5 | Norwich | -15.6 | 18.6 | 1.2 | 0.2 | -2.2 |
| 6 | Breckland | -5.9 | 29.8 | 16.7 | 9.4 | 13.5 |
| 7 | Peterborough UA | -16.1 | 32.7 | 11.9 | 10.8 | 11.1 |
| 8 | Fenland | -7.5 | 28.2 | -5.8 | 14.3 | 13.9 |
| 9 | South Norfolk | -7.2 | 24.0 | 4.6 | 10.6 | 9.3 |
| 10 | Huntingdonshire | -2.0 | 28.8 | 7.1 | 11.1 | 15.1 |
| 11 | East Cambridgeshire | -2.7 | 26.3 | 21.6 | 13.2 | 15.7 |
| 12 | West Suffolk | -7.3 | 25.5 | 13.8 | 4.9 | 9.5 |
| 13 | East Suffolk | -3.9 | 23.5 | 9.7 | 6.0 | 8.7 |
| 14 | Mid Suffolk | 3.6 | 20.4 | 10.1 | 14.0 | 15.5 |
| 15 | Cambridge | -18.3 | 28.0 | 32.2 | 11.2 | 11.1 |
| 16 | Bedford UA | -11.2 | 38.8 | 18.7 | 12.5 | 17.5 |
| 17 | South Cambridgeshire | -6.1 | 33.7 | 30.3 | 14.7 | 24.6 |
| 18 | Ipswich | -10.8 | 24.8 | 6.6 | 2.4 | 3.8 |
| 19 | Babergh | -11.1 | 28.8 | 4.9 | 6.3 | 9.2 |
| 20 | Central Bedfordshire UA | -0.8 | 42.6 | 26.0 | 6.2 | 23.1 |
| 21 | North Hertfordshire | -4.6 | 45.5 | 6.7 | 7.4 | 15.7 |
| 22 | Braintree | 11.9 | 29.5 | 14.4 | 9.9 | 18.9 |
| 23 | Uttlesford | 6.7 | 21.0 | 17.1 | 14.6 | 15.8 |
| 24 | Stevenage | -10.7 | 46.5 | 41.9 | 12.1 | 17.8 |
| 25 | Tendring | -1.5 | 28.0 | 13.3 | 14.2 | 13.4 |
| 26 | Colchester | -14.3 | 30.5 | 15.9 | 9.1 | 6.0 |
| 27 | Luton UA | -8.0 | 43.9 | 22.9 | 10.8 | 16.6 |
| 28 | East Hertfordshire | 1.2 | 41.7 | 31.8 | 12.3 | 20.4 |
| 29 | Harlow | -16.1 | 30.8 | 14.5 | 5.4 | 10.9 |
| 30 | Dacorum | -11.8 | 60.1 | 51.1 | 7.6 | 27.7 |
| 31 | St Albans | -13.4 | 52.6 | 64.3 | 8.4 | 20.0 |
| 32 | Welwyn Hatfield | -8.4 | 72.6 | 32.2 | 10.2 | 32.4 |
| 33 | Chelmsford | -10.9 | 33.7 | 13.6 | 8.2 | 8.8 |
| 34 | Maldon | -5.7 | 30.1 | 15.3 | 12.0 | 14.2 |
| 35 | Broxbourne | -16.4 | 52.1 | 38.2 | 2.9 | 19.7 |
| 36 | Epping Forest | 1.3 | 34.9 | 8.6 | 8.0 | 14.3 |
| 37 | Hertsmere | 2.2 | 52.2 | 74.5 | 58.1 | 48.9 |
| 38 | Watford | -26.9 | 54.4 | 60.6 | 2.6 | 11.1 |
| 39 | Three Rivers | 14.4 | 50.8 | 61.6 | 73.2 | 58.9 |
| 40 | Brentwood | -3.9 | 18.5 | 18.7 | 4.4 | 9.3 |
| 41 | Rochford | 9.6 | 30.8 | 18.7 | 3.4 | 16.1 |
| 42 | Basildon | -11.1 | 33.9 | 13.1 | 13.2 | 14.8 |
| 43 | Southend-on-Sea UA | -2.5 | 25.1 | 17.5 | 6.5 | 7.4 |
| 44 | Castle Point | 0.0 | 20.5 | 13.8 | 12.0 | 9.5 |
| 45 | Thurrock UA | -33.2 | 38.0 | 17.0 | 13.1 | 9.9 |
Source: NDR Revaluation 2023 compiled list (Tables 2.0-2.4)
Figure A6: East region map labelled with administrative area key
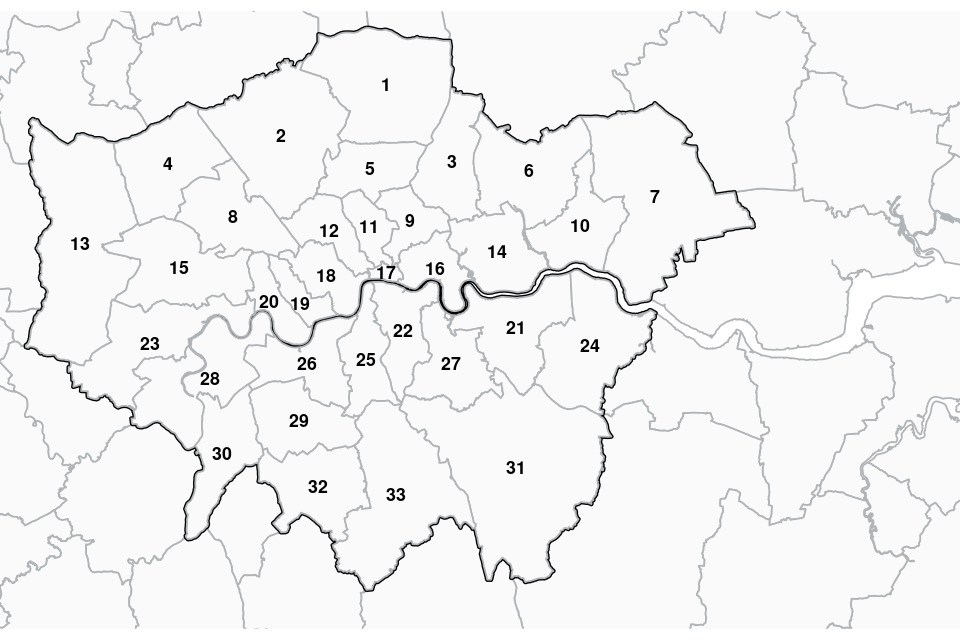
London Appendix
Table A8: Percentage change in rateable value (RV) between 2017 and 2023 rating lists by sector and administrative area in London, including administrative area key
| Key | Area | Retail | Industry | Office | ‘Other’ | All |
| 1 | Enfield | -4.4 | 32.2 | 15.3 | 28.5 | 19.3 |
| 2 | Barnet | -8.2 | 20.0 | 5.8 | 11.7 | 2.2 |
| 3 | Waltham Forest | 7.1 | 25.4 | 11.0 | 14.8 | 14.5 |
| 4 | Harrow | 2.3 | 24.6 | 6.6 | 12.5 | 8.6 |
| 5 | Haringey | -0.7 | 41.7 | 16.2 | 15.9 | 14.2 |
| 6 | Redbridge | 12.3 | 22.5 | 11.6 | 12.8 | 13.7 |
| 7 | Havering | -0.9 | 25.5 | 5.2 | 15.9 | 11.5 |
| 8 | Brent | 3.7 | 33.6 | 17.8 | 12.5 | 18.3 |
| 9 | Hackney | 9.4 | 26.9 | 21.0 | 4.0 | 16.1 |
| 10 | Barking and Dagenham | 7.7 | 34.8 | 7.7 | 20.8 | 23.9 |
| 11 | Islington | -4.0 | 8.0 | -3.5 | -0.9 | -2.4 |
| 12 | Camden | -9.2 | 20.3 | 6.7 | -5.6 | 1.6 |
| 13 | Hillingdon | 0.7 | 26.0 | 13.4 | -3.2 | 5.0 |
| 14 | Newham | -1.8 | 55.4 | 11.8 | 16.7 | 13.8 |
| 15 | Ealing | 8.2 | 34.2 | 12.2 | 14.5 | 20.6 |
| 16 | Tower Hamlets | -5.4 | 25.9 | -1.4 | -0.1 | 0.4 |
| 17 | City of London | 2.4 | 0.9 | 2.7 | -7.9 | 1.9 |
| 18 | Westminster | -18.1 | 25.8 | 8.4 | -16.0 | -3.3 |
| 19 | Kensington and Chelsea | -23.2 | 10.4 | 2.9 | -7.6 | -11.8 |
| 20 | Hammersmith and Fulham | -22.7 | 45.9 | 11.8 | 2.6 | -1.8 |
| 21 | Greenwich | -5.9 | 46.0 | 11.7 | 3.5 | 9.2 |
| 22 | Southwark | 2.5 | 64.8 | 11.3 | 0.6 | 10.8 |
| 23 | Hounslow | -0.8 | 28.4 | 7.8 | 9.5 | 12.4 |
| 24 | Bexley | -7.1 | 42.1 | 3.2 | 16.5 | 19.0 |
| 25 | Lambeth | 6.7 | 34.0 | 2.5 | -2.6 | 4.7 |
| 26 | Wandsworth | -3.7 | 27.0 | 19.8 | 5.0 | 8.4 |
| 27 | Lewisham | -8.5 | 34.3 | 15.2 | 7.9 | 6.4 |
| 28 | Richmond upon Thames | -6.6 | 31.1 | 19.3 | 5.0 | 5.8 |
| 29 | Merton | -3.0 | 48.6 | 18.6 | 20.3 | 18.6 |
| 30 | Kingston upon Thames | -22.4 | 43.5 | 27.3 | 3.7 | 1.9 |
| 31 | Bromley | -10.2 | 33.5 | 10.0 | 5.5 | 3.4 |
| 32 | Sutton | -2.4 | 48.3 | 24.4 | 10.7 | 17.5 |
| 33 | Croydon | -13.3 | 41.5 | 21.7 | 5.4 | 7.5 |
Source: NDR Revaluation 2023 compiled list (Tables 2.0-2.4)
Figure A7: London region map labelled with administrative area key
South East Appendix
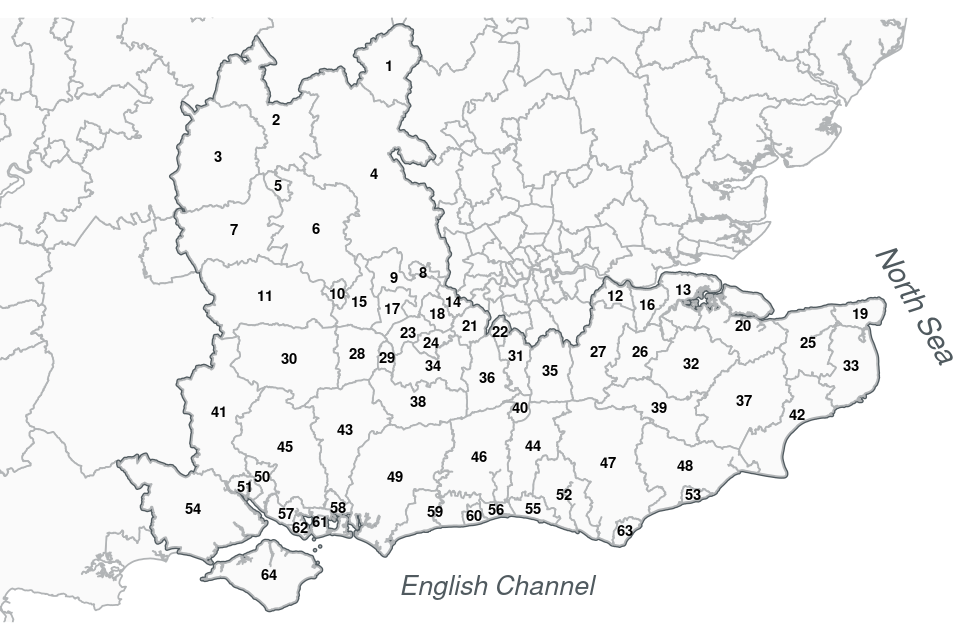
Table A9: Percentage change in rateable value (RV) between 2017 and 2023 rating lists by sector and administrative area in the South East, including administrative area key
| Key | Area | Retail | Industry | Office | ‘Other’ | All |
| 1 | Milton Keynes UA | -12.2 | 42.8 | 19.1 | 5.5 | 15.7 |
| 2 | Cherwell | 0.7 | 27.8 | 13.7 | 2.8 | 10.8 |
| 3 | West Oxfordshire | -2.9 | 31.7 | 20.9 | 6.3 | 13.4 |
| 4 | Buckinghamshire UA | -3.3 | 33.0 | 22.5 | 20.7 | 17.9 |
| 5 | Oxford | -19.8 | 23.7 | 51.5 | 0.2 | 5.0 |
| 6 | South Oxfordshire | -1.9 | 32.2 | 17.1 | 3.2 | 11.5 |
| 7 | Vale of White Horse | -2.8 | 33.0 | 41.0 | 10.5 | 23.4 |
| 8 | Slough UA | -15.3 | 38.9 | 18.1 | 2.4 | 17.7 |
| 9 | Windsor and Maidenhead UA | -16.6 | 35.7 | 5.8 | 1.8 | 2.9 |
| 10 | Reading UA | -7.8 | 30.3 | 22.4 | 3.6 | 11.4 |
| 11 | West Berkshire UA | -12.9 | 38.0 | 45.7 | 2.5 | 18.4 |
| 12 | Dartford | -38.3 | 49.5 | 7.4 | 5.1 | -3.7 |
| 13 | Medway UA | -7.1 | 32.0 | 8.2 | 4.8 | 9.9 |
| 14 | Spelthorne | -10.2 | 36.5 | 10.8 | 30.3 | 16.1 |
| 15 | Wokingham UA | -3.9 | 35.4 | 10.2 | 10.4 | 13.9 |
| 16 | Gravesham | -7.0 | 39.6 | 24.3 | 9.4 | 13.8 |
| 17 | Bracknell Forest UA | -17.3 | 24.7 | 20.6 | 7.7 | 7.3 |
| 18 | Runnymede | -3.0 | 34.3 | 19.5 | 0.6 | 12.1 |
| 19 | Thanet | -6.9 | 37.7 | 13.2 | 8.0 | 8.2 |
| 20 | Swale | -0.3 | 32.6 | 17.7 | 15.0 | 20.7 |
| 21 | Elmbridge | -7.3 | 29.7 | 15.2 | 4.6 | 7.5 |
| 22 | Epsom and Ewell | -10.9 | 25.8 | 8.0 | 5.6 | 2.7 |
| 23 | Surrey Heath | -5.2 | 26.0 | 41.1 | 2.8 | 14.2 |
| 24 | Woking | -4.8 | 34.0 | 24.6 | 1.9 | 13.7 |
| 25 | Canterbury | -12.4 | 28.2 | 15.8 | 7.6 | 3.9 |
| 26 | Tonbridge and Malling | 1.5 | 31.1 | 27.1 | 13.0 | 20.5 |
| 27 | Sevenoaks | 1.8 | 34.1 | 21.3 | 5.3 | 14.8 |
| 28 | Hart | -2.8 | 31.6 | 16.8 | 6.4 | 12.0 |
| 29 | Rushmoor | -9.1 | 31.5 | 44.4 | 26.4 | 23.0 |
| 30 | Basingstoke and Deane | -12.2 | 26.7 | 39.2 | 1.4 | 12.9 |
| 31 | Reigate and Banstead | -0.4 | 20.4 | 12.1 | 4.8 | 8.9 |
| 32 | Maidstone | -2.4 | 29.4 | 16.4 | 6.6 | 11.5 |
| 33 | Dover | -1.2 | 37.4 | 5.9 | 19.8 | 18.1 |
| 34 | Guildford | -11.4 | 22.5 | 22.7 | 4.6 | 6.4 |
| 35 | Tandridge | 9.3 | 29.0 | 7.5 | 2.8 | 10.9 |
| 36 | Mole Valley | 5.0 | 40.6 | 3.1 | 5.8 | 9.8 |
| 37 | Ashford | -24.5 | 33.6 | 15.8 | 8.8 | 5.1 |
| 38 | Waverley | -7.4 | 21.9 | 24.5 | 5.1 | 7.0 |
| 39 | Tunbridge Wells | -12.5 | 35.7 | 27.0 | 8.1 | 7.9 |
| 40 | Crawley | -11.9 | 35.3 | 13.3 | 12.7 | 13.6 |
| 41 | Test Valley | -9.5 | 37.9 | 24.8 | 6.7 | 21.2 |
| 42 | Folkestone and Hythe | -4.8 | 28.8 | 0.3 | 9.4 | 7.8 |
| 43 | East Hampshire | -8.8 | 31.8 | 25.3 | 7.4 | 13.8 |
| 44 | Mid Sussex | -3.8 | 34.2 | 16.5 | 5.8 | 13.3 |
| 45 | Winchester | -16.6 | 33.7 | 18.1 | 3.4 | 8.2 |
| 46 | Horsham | -4.6 | 38.1 | 13.3 | 4.0 | 13.3 |
| 47 | Wealden | 4.1 | 28.2 | 10.2 | 6.7 | 13.3 |
| 48 | Rother | -3.0 | 32.0 | 12.5 | 3.7 | 7.8 |
| 49 | Chichester | -18.8 | 38.0 | 23.3 | 5.1 | 5.8 |
| 50 | Eastleigh | -16.0 | 35.8 | 20.1 | 1.1 | 10.2 |
| 51 | Southampton UA | -15.1 | 25.1 | 16.2 | 5.6 | 4.3 |
| 52 | Lewes | 0.6 | 33.1 | 5.4 | 5.7 | 12.9 |
| 53 | Hastings | -5.8 | 33.3 | 6.1 | 3.8 | 6.5 |
| 54 | New Forest | 3.5 | 28.8 | 19.1 | 2.5 | 14.1 |
| 55 | Brighton and Hove UA | -9.7 | 36.7 | 17.0 | 3.1 | 3.9 |
| 56 | Adur | -13.2 | 39.7 | 21.6 | 12.3 | 14.1 |
| 57 | Fareham | -17.0 | 33.8 | 23.9 | 7.9 | 11.9 |
| 58 | Havant | -12.6 | 29.8 | 8.0 | 6.8 | 6.4 |
| 59 | Arun | -9.0 | 35.8 | 10.3 | 2.8 | 7.8 |
| 60 | Worthing | -15.4 | 42.8 | 6.5 | 6.0 | 3.3 |
| 61 | Portsmouth UA | -8.5 | 35.3 | 33.9 | 5.9 | 10.3 |
| 62 | Gosport | -6.5 | 39.4 | 24.3 | 6.6 | 15.1 |
| 63 | Eastbourne | -13.3 | 32.8 | 4.8 | 0.8 | -1.1 |
| 64 | Isle of Wight UA | -10.1 | 26.3 | 16.9 | 4.2 | 4.9 |
Source: NDR Revaluation 2023 compiled list (Tables 2.0-2.4)
Figure A8: South East region map labelled with administrative area key
South West Appendix
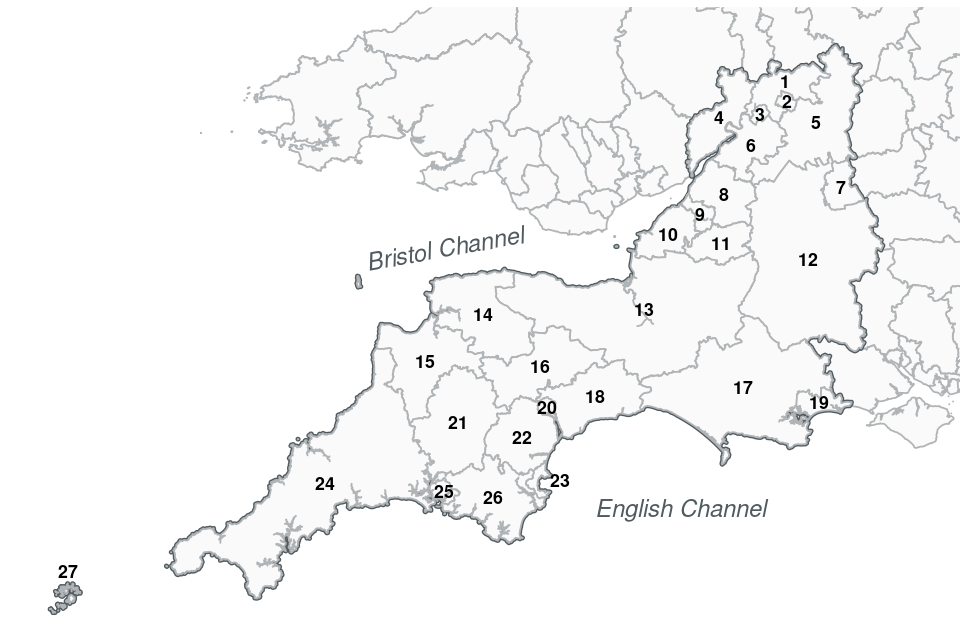
Table A10: Percentage change in rateable value (RV) between 2017 and 2023 rating lists by sector and administrative area in the South West, including administrative area key
| Key | Area | Retail | Industry | Office | ‘Other’ | All |
| 1 | Tewkesbury | 4.7 | 26.8 | -0.4 | 12.3 | 15.9 |
| 2 | Cheltenham | -0.9 | 35.5 | 26.7 | 6.8 | 11.1 |
| 3 | Gloucester | -7.5 | 29.3 | 10.3 | 11.0 | 8.7 |
| 4 | Forest of Dean | 15.9 | 33.6 | 27.9 | 12.7 | 23.3 |
| 5 | Cotswold | 4.2 | 31.4 | 18.2 | 4.6 | 12.9 |
| 6 | Stroud | 16.3 | 28.7 | 23.0 | 15.4 | 22.6 |
| 7 | Swindon UA | -13.0 | 15.3 | 31.9 | 5.7 | 8.1 |
| 8 | South Gloucestershire UA | -21.3 | 28.0 | 6.7 | 5.7 | 6.0 |
| 9 | Bristol, City of UA | -9.0 | 32.3 | 12.9 | 9.7 | 11.0 |
| 10 | North Somerset UA | -7.4 | 28.1 | 14.8 | 7.4 | 10.6 |
| 11 | Bath and North East Somerset UA | -14.0 | 47.7 | 23.1 | 3.2 | 5.1 |
| 12 | Wiltshire UA | 3.3 | 27.9 | 15.7 | 9.9 | 14.4 |
| 13 | Somerset UA | 0.6 | 19.0 | 14.9 | 4.8 | 9.0 |
| 14 | North Devon | -6.0 | 24.6 | 7.3 | 4.3 | 5.3 |
| 15 | Torridge | 6.5 | 30.1 | 10.2 | 6.9 | 12.0 |
| 16 | Mid Devon | -4.0 | 33.9 | 13.5 | 4.2 | 13.5 |
| 17 | Dorset UA | -0.7 | 21.6 | 14.6 | 8.2 | 10.1 |
| 18 | East Devon | 2.2 | 23.9 | 18.2 | 5.3 | 11.2 |
| 19 | Bournemouth, Christchurch and Poole UA | 0.9 | 24.6 | 19.2 | 5.8 | 9.6 |
| 20 | Exeter | -14.7 | 26.4 | 18.9 | 4.9 | 3.8 |
| 21 | West Devon | -3.1 | 23.1 | 29.5 | 5.0 | 8.2 |
| 22 | Teignbridge | 2.0 | 24.0 | 21.4 | 4.6 | 11.2 |
| 23 | Torbay UA | -1.1 | 27.7 | 4.1 | -0.1 | 3.6 |
| 24 | Cornwall UA | -0.2 | 24.0 | -3.8 | 4.3 | 6.7 |
| 25 | Plymouth UA | -7.4 | 21.3 | 1.7 | 6.3 | 5.1 |
| 26 | South Hams | 1.4 | 24.4 | 6.5 | -0.3 | 7.0 |
| 27 | Isles of Scilly UA | -4.5 | 30.7 | -11.6 | -2.8 | -0.5 |
Source: NDR Revaluation 2023 compiled list (Tables 2.0-2.4)
Figure A9: South West region map labelled with administrative area key
Wales Appendix
Table A11: Percentage change in rateable value (RV) between 2017 and 2023 rating lists by sector and administrative area in Wales, including administrative area key
| Key | Area | Retail | Industry | Office | ‘Other’ | All |
| 1 | Isle of Anglesey / Ynys Môn | -2.5 | 8.8 | 8.5 | 0.8 | 1.9 |
| 2 | Flintshire / Sir y Fflint | -5.1 | 8.8 | 7.2 | -2.1 | 3.3 |
| 3 | Conwy / Conwy | -7.4 | 11.9 | 0.5 | 0.7 | -0.6 |
| 4 | Denbighshire / Sir Ddinbych | -1.7 | 7.9 | 2.1 | 7.3 | 4.2 |
| 5 | Wrexham / Wrecsam | -12.7 | 10.9 | 12.9 | 0.1 | 1.3 |
| 6 | Gwynedd / Gwynedd | -6.5 | 13.2 | 2.9 | 2.3 | 1.8 |
| 7 | Powys / Powys | -3.1 | 9.2 | 3.3 | 6.1 | 4.8 |
| 8 | Ceredigion / Ceredigion | -8.7 | 9.4 | 0.6 | 6.0 | 2.0 |
| 9 | Carmarthenshire / Sir Gaerfyrddin | -12.8 | 7.6 | 0.6 | 4.4 | -1.2 |
| 10 | Pembrokeshire / Sir Benfro | -4.1 | 7.8 | -0.1 | -0.4 | 0.4 |
| 11 | Blaenau Gwent / Blaenau Gwent | -20.5 | 42.8 | 16.5 | 6.0 | 11.2 |
| 12 | Monmouthshire / Sir Fynwy | -6.2 | 11.4 | 5.0 | 2.2 | 2.3 |
| 13 | Merthyr Tydfil / Merthyr Tudful | -1.0 | 19.0 | 10.2 | 4.0 | 6.1 |
| 14 | Torfaen / Tor-faen | -11.4 | 31.6 | 5.0 | 2.8 | 7.6 |
| 15 | Neath Port Talbot / Castell-nedd Port Talbot | -3.4 | 4.1 | 1.1 | 5.3 | 3.1 |
| 16 | Swansea / Abertawe | -12.4 | 12.0 | 2.1 | -1.8 | -2.8 |
| 17 | Caerphilly / Caerffili | -4.3 | 32.3 | 3.3 | 3.5 | 12.1 |
| 18 | Rhondda Cynon Taf / Rhondda Cynon Taf | -10.7 | 16.4 | 6.4 | 6.3 | 4.8 |
| 19 | Newport / Casnewydd | -13.3 | 13.4 | 3.1 | -7.3 | -0.3 |
| 20 | Bridgend / Pen-y-bont ar Ogwr | -14.0 | 7.7 | 10.5 | 1.5 | -0.5 |
| 21 | Cardiff / Caerdydd | -14.0 | 7.8 | 9.1 | 1.4 | -0.9 |
| 22 | Vale of Glamorgan / Bro Morgannwg | -11.1 | 5.9 | 11.1 | 5.0 | 0.7 |
Source: NDR Revaluation 2023 compiled list (Tables 2.0-2.4)
Figure A10: Wales map labelled with administrative area key