Mortgage and landlord possession statistics: October to December 2022
Published 9 February 2023

© Crown copyright 2023
This publication is licensed under the terms of the Open Government Licence v3.0 except where otherwise stated. To view this licence, visit nationalarchives.gov.uk/doc/open-government-licence/version/3 or write to the Information Policy Team, The National Archives, Kew, London TW9 4DU, or email: psi@nationalarchives.gov.uk.
Where we have identified any third party copyright information you will need to obtain permission from the copyright holders concerned.
This publication is available at https://www.gov.uk/government/statistics/mortgage-and-landlord-possession-statistics-october-to-december-2022/mortgage-and-landlord-possession-statistics-october-to-december-2022
1. Main Points
This publication provides mortgage and landlord possession statistics for October to December 2022. In general, we have compared figures to the same quarter in the previous year. Should users wish to compare the latest outturn against 2019 as a pre-covid baseline, or to a period during the covid pandemic, they can do so using the accompanying statistical tables. For technical detail, please refer to the accompanying supporting document.
| Mortgage claims, orders, warrants and repossessions have increased significantly when compared to the same quarter in 2021. | Compared to the same quarter in 2021, mortgage possession claims increased from 2,570 to 3,160 (23%), orders from 1,650 to 2,482 (50%), warrants from 1,121 to 2,112 (88%) and repossessions by county court bailiffs increased from 313 to 733 (134%). |
| Landlord possession actions have all increased significantly. | The pattern is repeated for landlord possession actions. When compared to the same quarter in 2021, landlord possession claims increased from 14,436 to 20,460 (42%), orders from 6,865 to 16,158 (135%), warrants from 4,285 to 8,717 (103%) and repossessions from 2,729 to 5,409 (98%). |
| Mortgage and Landlord possession claims rates have risen across all regions. | Increases in possession claims have been recorded in all regions. Private and social landlord claims remained concentrated in London (with 9 and 3 of the highest 10 claim rates respectively). |
| Mortgage median average time (from claim to repossession) has decreased. | The median average time from claim to mortgage repossession has decreased to 63.9 weeks, down from 112.3 weeks in the same period in 2021. |
| Median timeliness for landlord repossessions has decreased when compared to 2021. | The median average time from claim to landlord repossession has decreased to 21.7 weeks, down from 42.3 weeks in the same period in 2021. |
A data visualisation tool has also been published that provides further breakdowns in a web-based application. The tool can be found here.
For feedback related to the content of this publication and visualisation tool, please contact us at CAJS@justice.gov.uk
2. Statistician’s Comment
Mortgage and landlord possession volumes increased steadily through 2022. Compared to the same quarter in 2021, the October to December 2022 volumes show a marked increase, although we cannot yet say whether these increases will continue at the same pace through 2023. In general, volumes have not reached pre-pandemic levels.
A deeper dive into the figures show that the rate of recovery is different for mortgage and landlord actions. Although mortgage claim volumes have increased quarter on quarter since Q2 2021, claim receipts, orders and warrants for mortgage possession make up just over half of the pre-covid baseline. In the same period, landlord receipts have increased at a faster pace and make up around 80% of their pre covid baseline. This increase was mainly driven by the steady rise in Private Landlord and Accelerated Procedure volumes.
Orders, Warrants of Possession and Repossessions issued for both mortgage and landlord possessions have followed similar trends to receipts. They remain below pre-covid levels but numbers have risen steadily since restrictions ended.
Timeliness figures have continued to decrease across all mortgage and landlord stages. Median time between claims and repossessions for all landlord procedures is back to pre covid levels while the time taken between mortgage claims and repossessions are also making steady progress to what they were before 2019. It must be noted that there are factors outside court processes that can impact on timeliness, including delay on the part of the claimant in starting enforcement activity.
3. Overview of Mortgage Possession
Mortgage possession actions: claims, orders and warrants are all currently above the previous year’s levels.
Compared to the same quarter in 2021, mortgage possession claims (3,160) are up 23%. Mortgage orders for possession (2,482) are up 50%, warrants issued (2,112) are up 88% and repossessions (733) are up 134%.
Figure 1: Mortgage possession actions in the county courts of England and Wales, October to December 2017 to October to December 2022 (Source: Table 1)
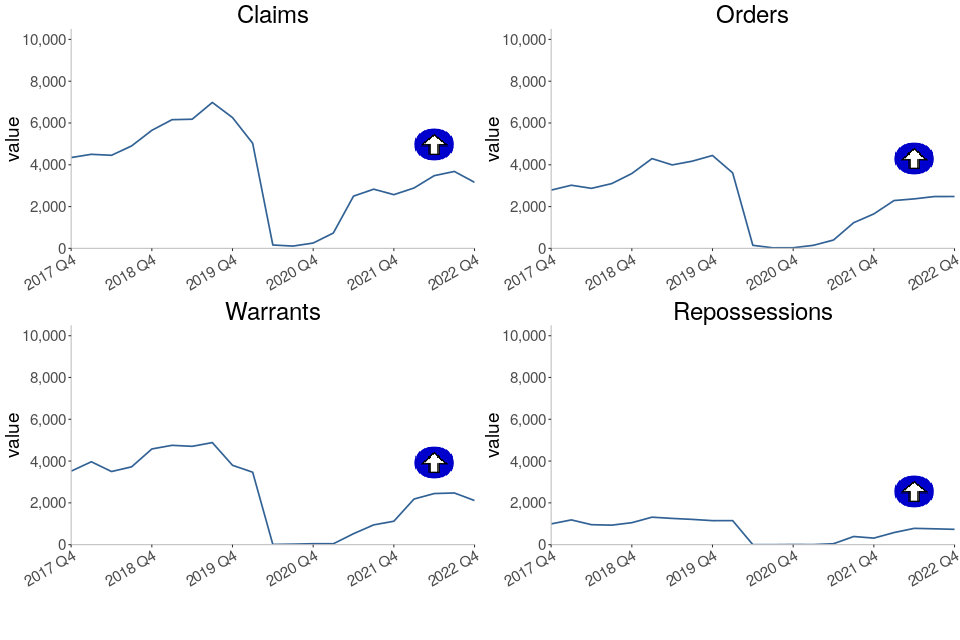
All Mortgage possession case types have been steadily increasing since Q2 2021. Claims, warrants and repossessions volumes are now at 50%, 44% and 36% below their pre-covid baseline. This is a significant increase when compared to the same quarters in 2020 and 2021. However it is still short of the pre-covid 2019 baseline.
Mortgage possession claims fell from a peak of 26,419 in April to June 2009 (in the aftermath of the 2008 financial crash) before stabilising from April to June 2015 (4,849, see table 1). In the most recent quarter, October to December 2022, there were 3,160 claims for possession, up 23% from the same quarter in 2021.
Orders and warrants for possession followed a similar trend to mortgage claims, falling from a peak of 23,850 orders in July to September 2009 and 21,350 warrants in January to March 2009, and stabilizing around 2016/17. Compared to the same quarter in 2021, orders are up 50% to 2,482 and warrants are up 88% to 2,112 in October to December 2022.
Historically, repossessions by county court bailiffs fell from a high of 9,284 in Q1 of 2009 to 934 in Q3 of 2018, the lowest recorded level of the series at the time. Following the complete cessation of repossession proceedings from March to September 2020 where no repossessions took place, the FCA guidance advised mortgage lenders not to commence or continue possession proceedings until April 2021 (unless there were special circumstances). As a result, there were only 10 repossessions from April 2020 to March 2021 (Q2 2020 to Q1 2021), but this has now risen to 733 in October to December 2022.
Before the impact of coronavirus, the historical fall in the number of mortgage possession actions since 2008 has generally coincided with lower interest rates, a proactive approach from lenders in managing consumers in financial difficulties and other interventions, such as the Mortgage Rescue Scheme and the introduction of the Mortgage Pre-Action Protocol. Additionally, the downward trend seen in recent years mirrors that seen in the proportion of owner-occupiers.
4. Mortgage Possession Action Timeliness
Median timeliness figures have halved for all actions; claim to orders, claim to warrant and claim to repossession.
The median average time from claim to repossession has decreased to 63.9 weeks, down from 112.3 weeks in the same period in 2021. However, it should be noted there were much fewer cases during October to December 2021, making direct comparisons difficult.
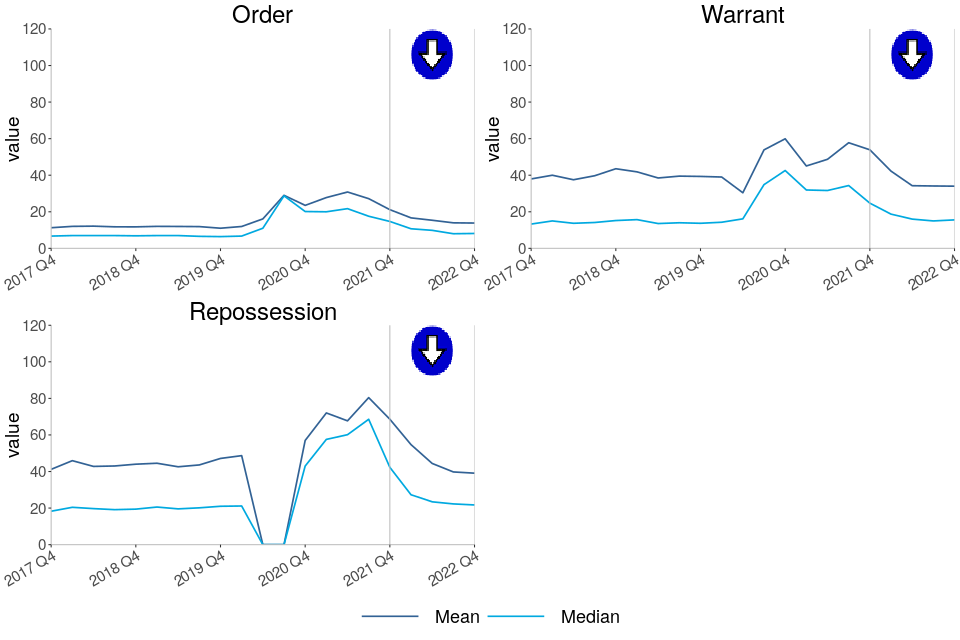
Figure 2: Average timeliness of mortgage possession actions, October to December 2017 to October to December 2022 (Source: Table 3)
Number of weeks taken from initial mortgage claim to…
-
Claims to order median timeliness has decreased to 9.0 weeks, down from 17.0 weeks in the same period in 2021.
-
Claims to warrant median timeliness has decreased to 46.6 weeks, down from 96.4 weeks in the same period in 2021.
-
Claims to repossession median timeliness has decreased to 63.9 weeks, down from 112.3 weeks in the same period in 2021.
The above charts distinguish between the timeliness of possession claims at different stages of a case. Average time taken from claim to warrant or repossession can fluctuate and is affected by various factors. For example, the final two charts take account of the amount of time between the court order being issued and the claimant, such as the mortgage lender, applying for a warrant of possession.
The long-term increases in the mean average time from claim to warrant and claim to repossession are due to an increasing proportion of historic claims reaching the warrant and repossession stages respectively in recent quarters. This is possibly due to defendants recently breaking the terms of the mortgage agreements put in place at the start of the process. Although these historical outlying cases inflate the mean average, they have less effect on the median.
5. Overview of Landlord Possession
The number of landlord possession actions for all court stages have increased compared to the same quarter of last year.
Compared to the same quarter in 2021, landlord possession actions; claims (20,460), orders for possession (16,158), warrants (8,717) and repossessions (5,409) have increased by 42%, 135%, 103% and 98% respectively.
Figure 3: Landlord possession actions in the county courts of England and Wales, October to December 2017 to October to December 2022 (Source: Table 4)
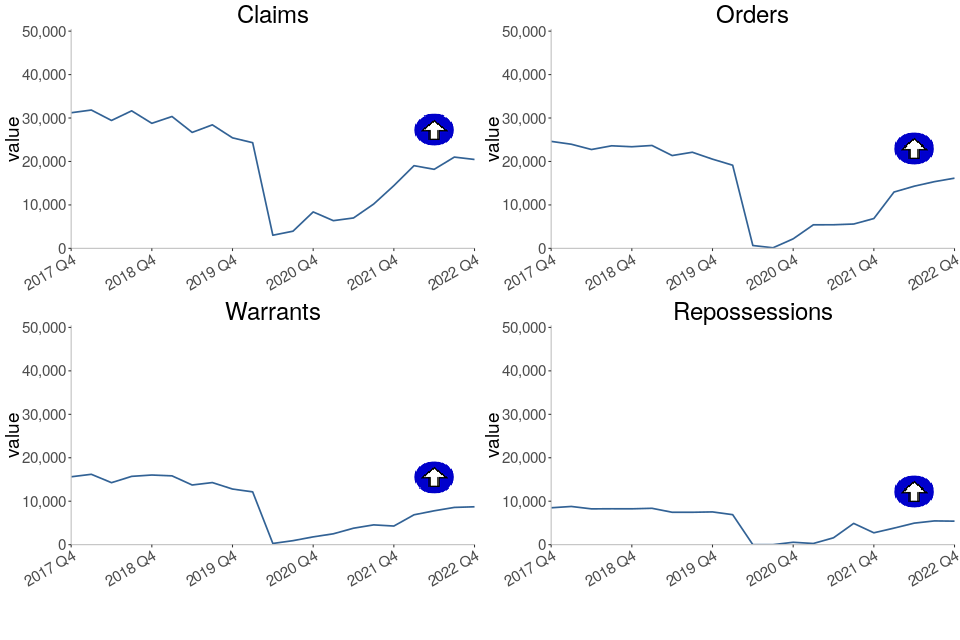
Landlord possession actions have been increasing since Q2 2021. Claims, orders and warrants volumes increased by 42%, 135% and 103% respectively while landlord repossessions in the county courts rose by 98% when compared to the same quarter in 2021.
Within the landlord possession actions, the Accelerated procedures have particularly risen across all the action types, claims, orders and warrants. In Wales the Accelerated procedure for claims, orders and warrants increased by 354%, 503% and 522% respectively. Whereas in England the Accelerated procedure for claims, orders and warrants increased by 69%, 148% and 182%. This large proportionate increase in Wales could be the effect of landlords exiting the sector due to the Renting Homes (Wales) Act that was introduced on 1st December 2022.
In October to December 2022, a similar proportion (37% or 7,606) of all landlord possession claims were social landlord claims compared to private landlord claims (31% or 6,254). 32% (6,600) were accelerated claims. This contrasts with pre-covid proportions when a majority of claims (around 60%) were social landlord claims.
The rise in claim and orders volumes is observed across all geographical regions. As in previous quarters, a concentration was seen in London, with 5,807 landlord claims and 4,396 landlord orders at London courts in October to December 2022, accounting for 28% and 27% of the respective totals. In London, there was an increase of 56% (from 3,727 in October to December 2021) for landlord claims and an increase of 177% for landlord orders (from 1,588 in October to December 2021).
The 103% increase in landlord warrants compared to October to December 2021, was accompanied by large increases across all regions. The largest regional number (2,758) was again found in London, making up 32% of all landlord warrants. There was an increase of 105% for landlord warrants in London (from 1,347 in October to December 2021 to 2,758 in October to December 2022).
6. Landlord Possession Timeliness[footnote 1]
Median timeliness figures have decreased for landlord orders, warrants and repossessions and are returning to pre-Covid levels.
The median average time from claim to repossession has decreased to 21.7 weeks, down from 42.3 weeks in the same period of 2021.
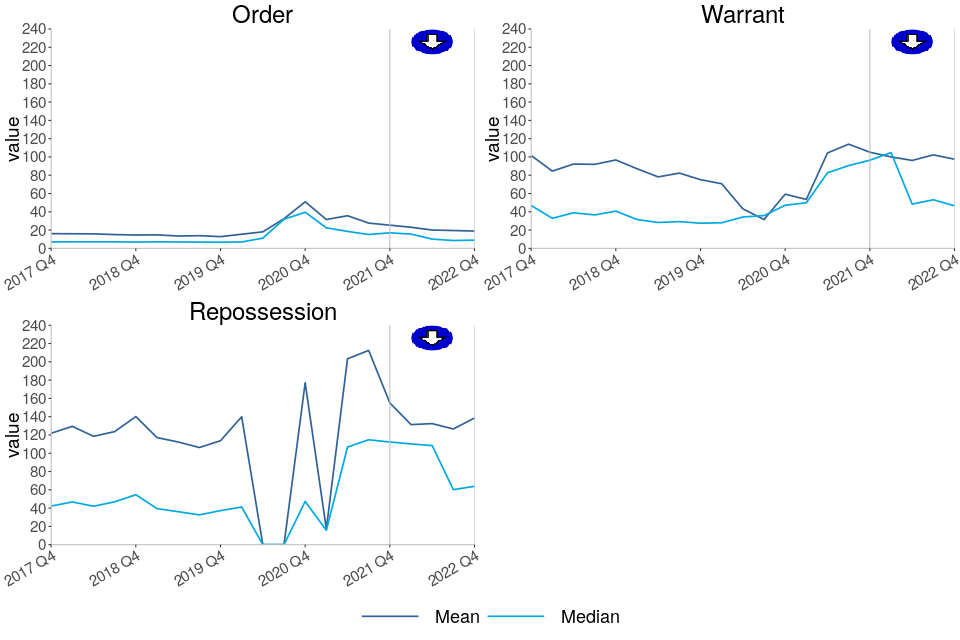
Figure 4: Mean and median average timeliness of landlord possession actions, October to December 2017 to October to December 2022 (Source: Table 6)
Number of weeks taken from initial landlord claim to…
-
Claims to order median timeliness has decreased to 8.1 weeks, down from 14.7 weeks in the same period in 2021.
-
Claims to warrant median timeliness has decreased to 15.6 weeks, down from 24.7 weeks in the same period in 2021.
-
Claims to repossessions median timeliness has decreased to 21.7 weeks, down from 42.3 weeks in the same period in 2021.
As shown by Figure 4, median figures are generally considerably lower than mean figures, demonstrating that on average, the progression from claim to successive stages can be positively skewed by outlying cases.
7. Regional Possession Claims
This quarter, the methodology used for calculating the rates of possession claims and repossessions have been modified to take into account the variation in proportions of tenure types in each local authority as shown in the 2021 census. The previous methodology used total household figures as the denominator for all claims and repossessions rates. This has now been modified to use household volumes by tenure[footnote 2]; mortgage, social and private landlord volumes for each local authority. For example, the rate of mortgage claims is now calculated as the number of mortgage claims divided by the number of households owned by a mortgage or loan in each LA. Similarly, rates for private and social landlord claims and repossessions have now been calculated separately[footnote 3] as a rate of households in each LA owned by a private or social landlord respectively. More information on this change is provided in the accompanying guide here.
City of London, in the London region, had the highest rate of mortgage possession claims at 147 per 100,000 households owned by mortgage or loan, followed by Blackpool (North West region) and Brent (London region); with 118 and 111 claims per 100,000 respectively. City of London, Blackpool and Brent have 14%, 26% and 18% respectively of their accommodation owned with a mortgage or loan. It should be noted that the number of possessions in the City of London is less than 10, so represents a small number, and there are also a small number of households owned with a mortgage or loan.
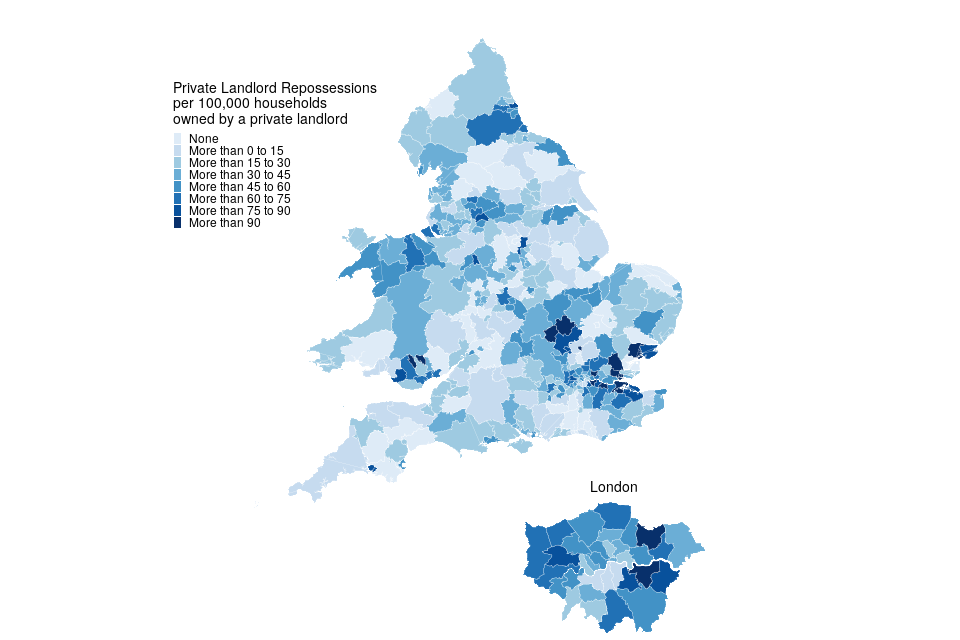
The highest private landlord possession claim rates were found in London, with 9 of the 10 highest rates occurring in this region. Newham had the highest rate for private landlord claims (369 per 100,000 households owned by a private landlord). 39% of the households in Newham were privately rented.
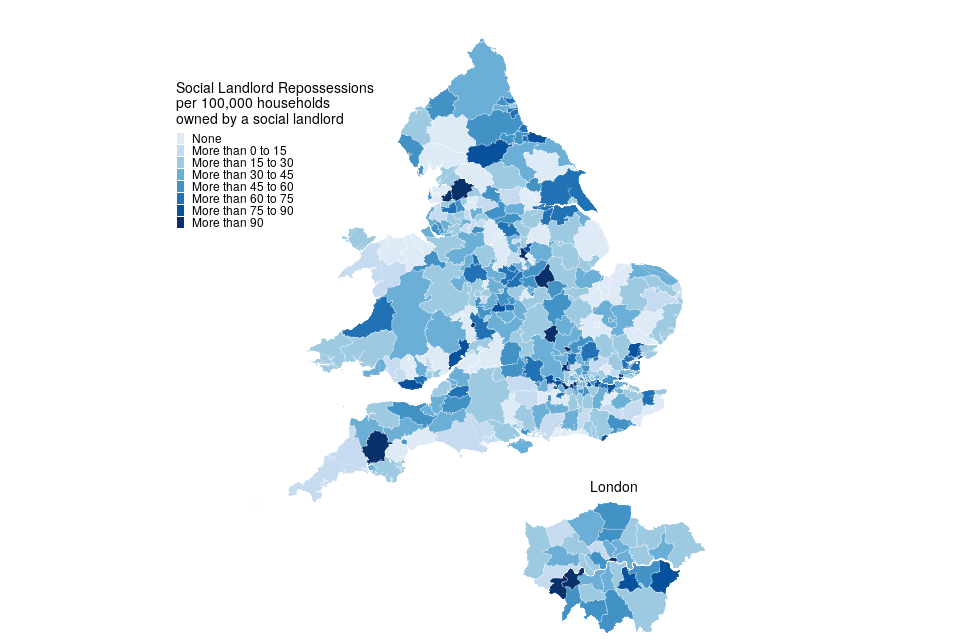
The highest social landlord possession claim rates were also found in London with 3 of the 10 highest rates occurring in this region. Watford had the highest rate for social landlord claims (567 per 100,000 households owned by a social landlord). 16% of all households in Watford were in the social rented sector, for example through the local council or housing association.
Figure 5: Mortgage possession Claims per 100,000 households owned by a mortgage or loan, October to December 2022 (Source: map.csv; see supporting guide)[footnote 4]
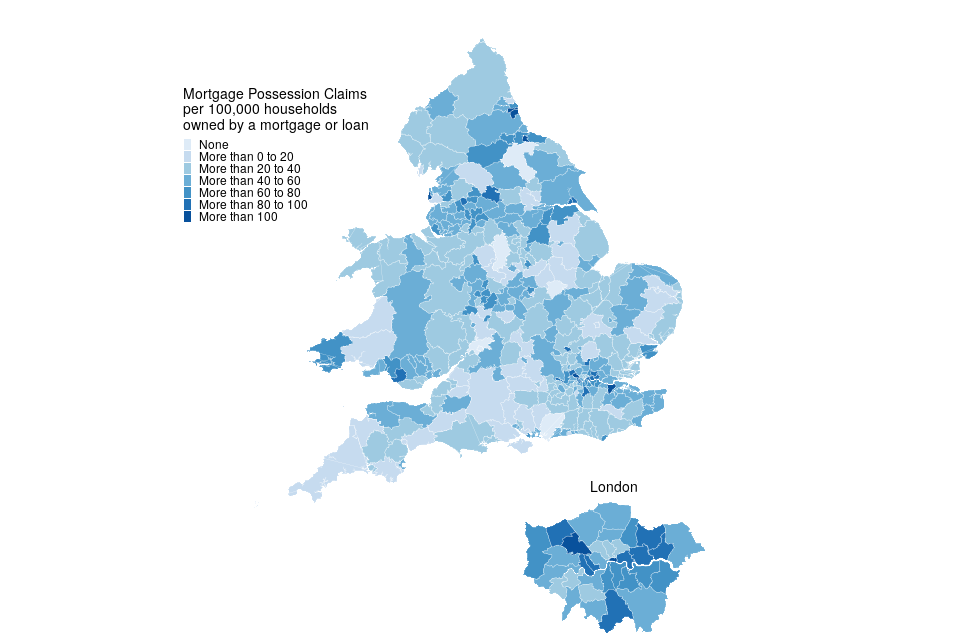
| Local Authority | Rate (per 100,000 households owned by a mortgage or loan) | Actual number |
|---|---|---|
| City of London | 147 | <10 |
| Blackpool | 118 | 20 |
| Brent | 111 | 24 |
7 local authorities had no mortgage possession claims during this period. Excluding these, Warwick had the lowest rate of mortgage claims (5.1 per 100,000 households owned by a mortgage or loan).
Figure 6: Private landlord possession Claims per 100,000 households owned by a private landlord, October to December 2022 (Source: map.csv; see supporting guide)[footnote 4]
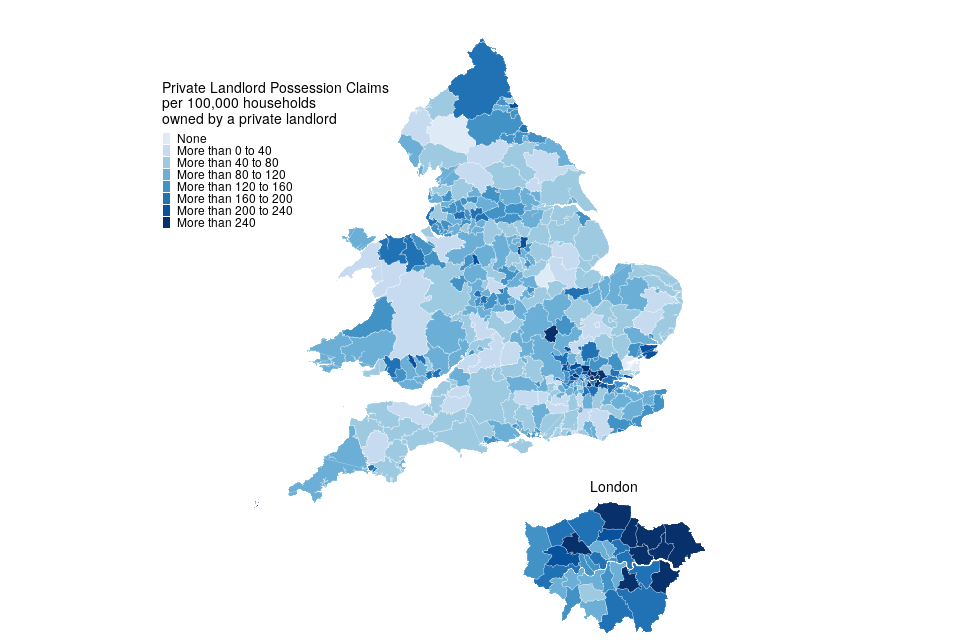
| Local Authority | Rate (per 100,000 households owned by a private landlord) | Actual number |
|---|---|---|
| Newham | 369 | 164 |
| Havering | 350 | 56 |
| Barking and Dagenham | 347 | 62 |
London boroughs accounted for 9 of the 10 local authorities with the highest rate of private landlord claims.
3 local authorities had no private landlord claims during this period. Excluding this, Warwick had the lowest rate of private landlord claims (8.4 per 100,000 households owned by a private landlord).
Figure 7: Social landlord possession Claims per 100,000 households owned by a social landlord, October to December 2022 (Source: map.csv; see supporting guide)[footnote 4]
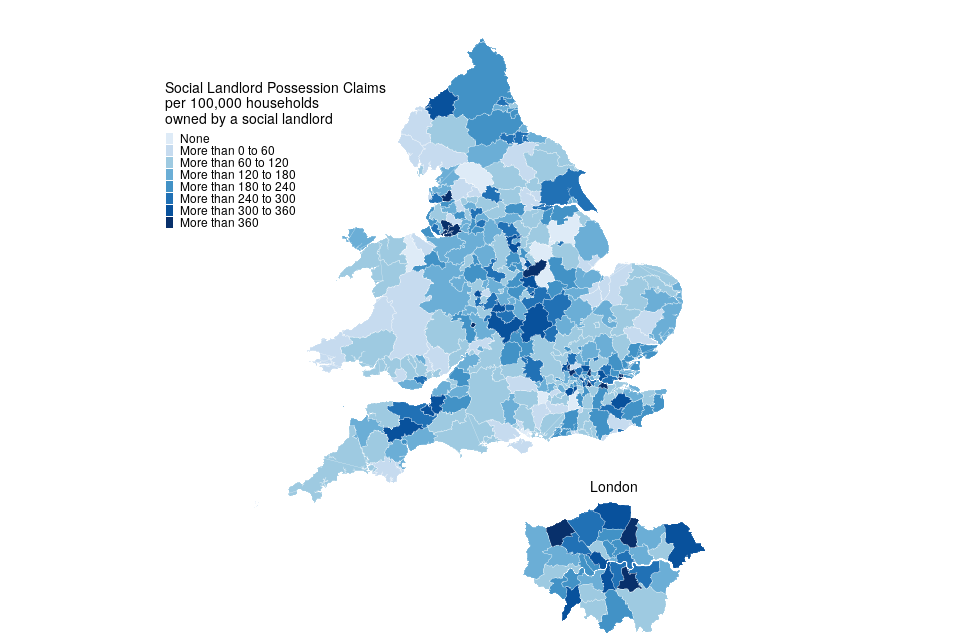
| Local Authority | Rate (per 100,000 households owned by a social landlord) | Actual number |
|---|---|---|
| Watford | 567 | 35 |
| Dartford | 523 | 33 |
| St. Helens | 469 | 75 |
London boroughs accounted for 3 of the 10 local authorities with the highest rate of social landlord claims.
10 local authorities had no social landlord claims during this period. Excluding this, Pembrokeshire had the lowest rate of social landlord claims (11.1 per 100,000 households owned by a social landlord).
8. Regional Repossessions (by County Court Bailiffs)
Pendle had the highest overall rate of mortgage repossessions at 66 per 100,000 households owned by a mortgage or loan.
Private landlord repossessions were highest in Merthyr Tydfil with 151 per 100,000 households owned by a private landlord.
Social landlord repossessions were highest in Preston with 146 per 100,000 households owned by a social landlord.
Figure 8: Mortgage repossessions per 100,000 households owned by a mortgage or loan, October to December 2022 (Source: map.csv; see supporting guide)[footnote 4]
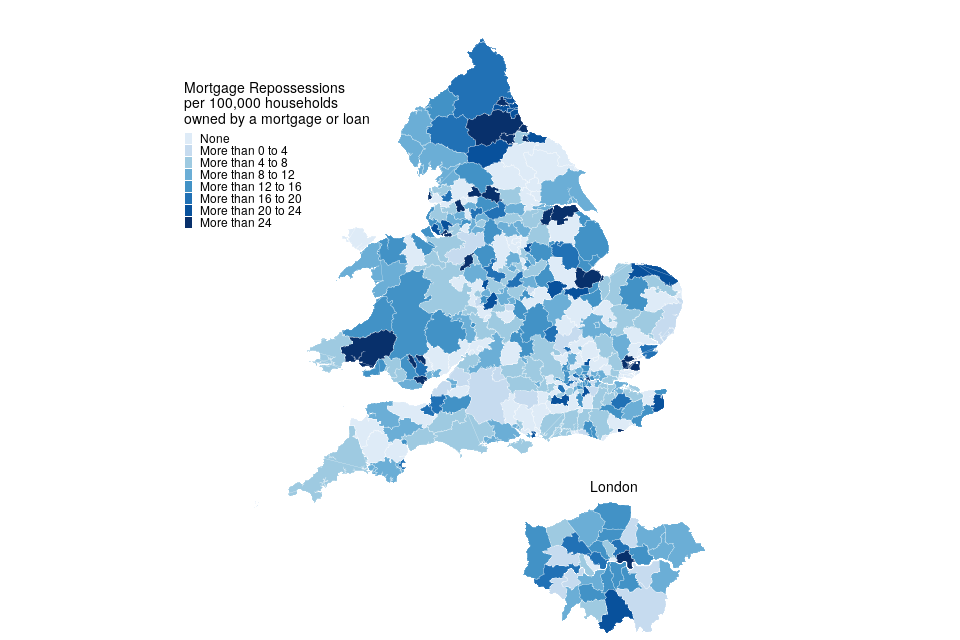
| Local Authority | Rate (per 100,000 households owned by a mortgage or loan) | Actual number |
|---|---|---|
| Pendle | 66 | <10 |
| Merthyr Tydfil | 43 | <10 |
| Halton | 42 | <10 |
No repossessions by county court bailiffs were recorded during this period in 77 local authorities out of a total of 331.
Figure 9: Private landlord repossessions per 100,000 households owned by a private landlord, October to December 2022 (Source: map.csv; see supporting guide)[footnote 4]
| Local Authority | Rate (per 100,000 households owned by a private landlord) | Actual number |
|---|---|---|
| Merthyr Tydfil | 151 | <10 |
| Castle Point | 134 | <10 |
| Blaenau Gwent | 124 | <10 |
London local authorities account for 1 of the 10 boroughs with the highest rate of private landlord repossessions.
43 local authorities had no private landlord repossessions by county court bailiffs in October to December 2022.
Figure 10: Social landlord repossessions per 100,000 households owned by a social landlord, October to December 2022 (Source: map.csv; see supporting guide)[footnote 4]
| Local Authority | Rate (per 100,000 households owned by a social landlord) | Actual number |
|---|---|---|
| Preston | 146 | 16 |
| City of London | 137 | <10 |
| Melton | 124 | <10 |
London local authorities account for 1 of the 10 boroughs with the highest rate of social landlord repossessions.
43 local authorities had no social landlord repossessions by county court bailiffs in October to December 2022.
As with claims, it should be noted that for some of these areas the rates are based on a small number of possessions.
9. Further information
The statistics in the latest quarter are provisional and revisions may be made when the next edition of this bulletin is published. If revisions are needed in subsequent quarters, these will be annotated in the tables.
9.1 Accompanying files
As well as this bulletin, the following products are published as part of this release:
-
A supporting guide providing further information on how the data is collected and processed, including a guide to the csv files, as well as legislation relevant to mortgage possessions and background information.
-
A set of overview tables, covering key sections of this bulletin.
-
CSV files of the map data and the possession action volumes by local authority and county court.
-
A data visualisation tool which provides a detailed view of the Mortgage and Landlord statistics. We welcome feedback on this tool to help improve it in later editions and to ensure it meets user needs.
9.2 National Statistics status
National Statistics status means that official statistics meet the highest standards of trustworthiness, quality and public value.
All official statistics should comply with all aspects of the Code of Practice for Statistics. They are awarded National Statistics status following an assessment by the Authority’s regulatory arm. The Authority considers whether the statistics meet the highest standards of Code compliance, including the value they add to public decisions and debate.
It is the Ministry of Justice’s responsibility to maintain compliance with the standards expected for National Statistics. If we become concerned about whether these statistics are still meeting the appropriate standards, we will discuss any concerns with the Authority promptly. National Statistics status can be removed at any point when the highest standards are not maintained, and reinstated when the standards are restored. These statistics have been audited and re-accredited as National Statistics. The most recent compliance check completed by the Office of Statistics Regulation can be found here.
9.3 Future publications
Our statisticians regularly review the content of publications. Development of new and improved statistical outputs is usually dependent on reallocating existing resources. As part of our continual review and prioritisation, we welcome user feedback on existing outputs including content, breadth, frequency and methodology. Please send any comments you have on this publication including suggestions for further developments or reductions in content.
9.4 Contact
Press enquiries should be directed to the Department for Levelling Up, Housing and Communities press office:
email: newsdesk@levellingup.gov.uk
Other enquiries and feedback on these statistics should be directed to the Data and Evidence as a Service division of the Ministry of Justice:
Carly Gray - email: CAJS@justice.gov.uk
Next update: 18 May 2023
© Crown Copyright
Produced by the Ministry of Justice
Alternative formats are available upon request from ESD@justice.gov.uk
-
The law requires at least 4 and no more than 8 weeks between claim and court hearing. Possession orders stipulate when a tenant must vacate the property - typically within 4 weeks from the date the order was made. Landlords cannot issue a warrant until after this period (if the tenant has failed to comply). ↩
-
Tenure - Office for National Statistics ons.gov.uk. ↩
-
Please note rates for private and social landlord possession claims and repossessions do not include accelerated claims. This is because accelerated claims are recorded onto the case management system at point of entry so do not specify the tenure type. ↩
-
Please note the boundaries in figures 5 to 10 have been updated this quarter to better reflect the spread of possession and repossession rates. ↩ ↩2 ↩3 ↩4 ↩5 ↩6