Mortgage and landlord possession statistics: October to December 2021
Published 10 February 2022

© Crown copyright 2022
This publication is licensed under the terms of the Open Government Licence v3.0 except where otherwise stated. To view this licence, visit nationalarchives.gov.uk/doc/open-government-licence/version/3 or write to the Information Policy Team, The National Archives, Kew, London TW9 4DU, or email: psi@nationalarchives.gov.uk.
Where we have identified any third party copyright information you will need to obtain permission from the copyright holders concerned.
This publication is available at https://www.gov.uk/government/statistics/mortgage-and-landlord-possession-statistics-october-to-december-2021/mortgage-and-landlord-possession-statistics-october-to-december-2021
1. Main Points
This publication provides mortgage and landlord possession statistics for October to December 2021. In general, we have compared figures to the same quarter in 2019 as a pre-Covid-19 baseline. Should users wish to compare the latest outturn against 2020, they can do so using the accompanying statistical tables. For technical detail, please refer to the accompanying supporting document.
| All possession actions by both landlords and mortgage providers have reduced significantly following Covid-19 impact and associated actions | The recovery in Civil Courts continues, following the passing of the Coronavirus Act in March 2020 and other policy responses which led to unprecedentedly low levels of possession actions. As a result, the data is unlikely to be representative of general trends. Caution should therefore be used when interpreting and applying these figures. |
| Mortgage claims, orders, warrants and repossessions have decreased significantly when compared to pre-Covid levels | Compared to 2019, pre-Covid-19, mortgage possession claims, orders, warrants and repossessions by county court bailiffs have decreased by 59%, 63%, 71% and 73% respectively. However, compared to the same quarter in 2020, all mortgage actions increased by over 100%. This is in line with the recovery referred to above. Mortgage possession claims increased from 255 to 2,568, orders from 29 to 1,656, warrants from 45 to 1,114 and repossessions by county court bailiffs increased from 7 to 309. |
| Landlord possession actions have also all decreased significantly | The pattern is repeated for landlord possession actions. When compared to the same quarter in 2019, landlord possession claims, orders, warrants and repossessions by county court bailiffs have decreased by 43%, 67%, 67% and 64% respectively. However, when compared to the same quarter in 2020, over 100% increases were recorded across all actions, except for claims issued which rose 72%. Possession claims rose from 8,382 to 14,433, orders from 2,195 to 6,849, warrants from 1,792 to 4,256 and repossessions from 548 to 2,706. |
| Mortgage and Landlord possession claims, and repossession rates have fallen across all regions | Decreases in possession claims have been recorded in all regions. Landlord claims remained concentrated in London (with 9 of the highest 10 claim rates). |
| Mortgage median average time (from claim to repossession) has increased | The median average time from claim to mortgage repossession has increased to 111.9 weeks, up from 37.2 weeks, compared to the same period in 2019. In the same quarter in 2020, the median average time was 47.3 weeks, however, it should be noted this was based on only 7 cases. |
| Median timeliness for landlord repossessions has increased when compared to 2019 and decreased when compared to 2020 | The median average time from claim to landlord repossession has increased to 42.1 weeks, up from 21.0 weeks in the same period in 2019. In the same quarter in 2020, the median average time was 43.0 weeks. |
A data visualisation tool has also been published this quarter that provides further breakdowns in a web-based application. The tool can be found here.
For feedback related to the content of this publication and visualisation tool, please contact us at CAJS@justice.gov.uk
2. Statistician’s Comment
This report covers the quarter to the end of December 2021 and shows continued gradual recovery in all court actions when compared to the same period last year, although numbers are still below pre-Covid-19 baseline levels. Inevitably, the pandemic continues to be the dominant determining factor through all these statistics.
Claim volumes for Mortgage and Landlord possession continue to increase following the lifting of bailiff restrictions. Claims issued have increased quarter on quarter since Q2 2020 - the start of Covid-19 restrictions - but remain at around 41% of baseline levels.
Landlord possession claims issued have decreased by 43% against the baseline but a further drill down reveals private landlord possession claims are now back to pre-Covid-19 levels and make up 4 in 10 of all claims. This is double their proportion compared to the pre-Covid-19 period. In contrast, Social landlord claims have almost halved from around 60% in Q4 2019 to 33% this quarter.
The eviction ban has been lifted and, from 1 October 2021, all notice periods returned to their pre-pandemic lengths. The number of repossessions and enforcement actions therefore continue to increase when compared to the same period last quarter, although they still remain below pre-Covid-19 levels.
Timeliness continues to remain volatile as figures still reflect the stay on most possession claims implemented for case progression and the stay to evictions. All timeliness figures increased apart from time taken from landlord claim to repossession which decreased compared to the same period last year.
The volatility recorded in the numbers presented, should be considered within the context of small volumes and the invariable additional time needed where normal court procedures could not be followed.
3. Overview of Mortgage Possession
Mortgage possession actions are slowly recovering from the impacts of Covid-19, with claims, orders and warrants currently around 59%, 63% and 71% below pre-Covid levels in Q4 2019.
As a result of coronavirus and associated actions, all mortgage possession actions have dropped significantly. Compared to the same quarter in 2019, mortgage possession claims (2,568) are down 59%. Mortgage orders for possession (1,656) are down 63%, warrants issued (1,114) are down 71% and repossessions (309) are down 73%.
Figure 1: Mortgage possession actions (actual and seasonally adjusted) in the county courts of England and Wales, October to December 2016 to October to December 2021 (Source: Table 10a)
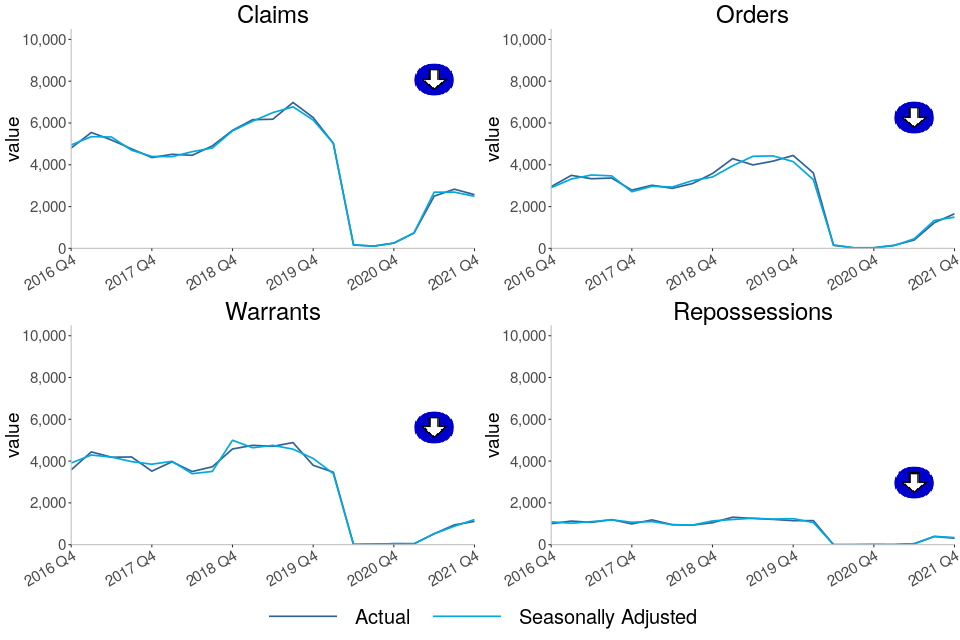
Mortgage possession claims fell from a peak of 26,419 in April to June 2009 before stabilising from April to June 2015 (4,849, see table 10a). In the most recent quarter, October to December 2021, there were 2,568 claims for possession, down 59% from the same quarter in 2019.
Orders and warrants for possession followed a similar trend to mortgage claims, falling from a peak of 23,850 orders in July to September 2009 and 21,350 warrants in January to March 2009, and stabilizing around 2016/17. Compared to the same quarter in 2019, orders are down 63% to 1,656 and warrants are down 71% to 1,114 in October to December 2021.
Historically, repossessions by county court bailiffs fell from a high of 9,284 in Q1 of 2009 to 934 in Q3 of 2018, the lowest recorded level of the series at the time. Following the complete cessation of repossession proceedings from March to September 2020 where no repossessions took place, the FCA guidance advised mortgage lenders not to commence or continue possession proceedings until April 2021 (unless there were special circumstances). As a result, there were only 10 repossessions over the whole of last year from April 2020 to March 2021 (Q2 2020 to Q1 2021), and only 309 in October to December 2021, down 73% compared to the same quarter in 2019.
Before the impact of coronavirus, the historical fall in the number of mortgage possession actions since 2008 has generally coincided with lower interest rates, a proactive approach from lenders in managing consumers in financial difficulties and other interventions, such as the Mortgage Rescue Scheme and the introduction of the Mortgage Pre-Action Protocol. Additionally, the downward trend seen in recent years mirrors that seen in the proportion of owner-occupiers.
4. Mortgage Possession Action Timeliness
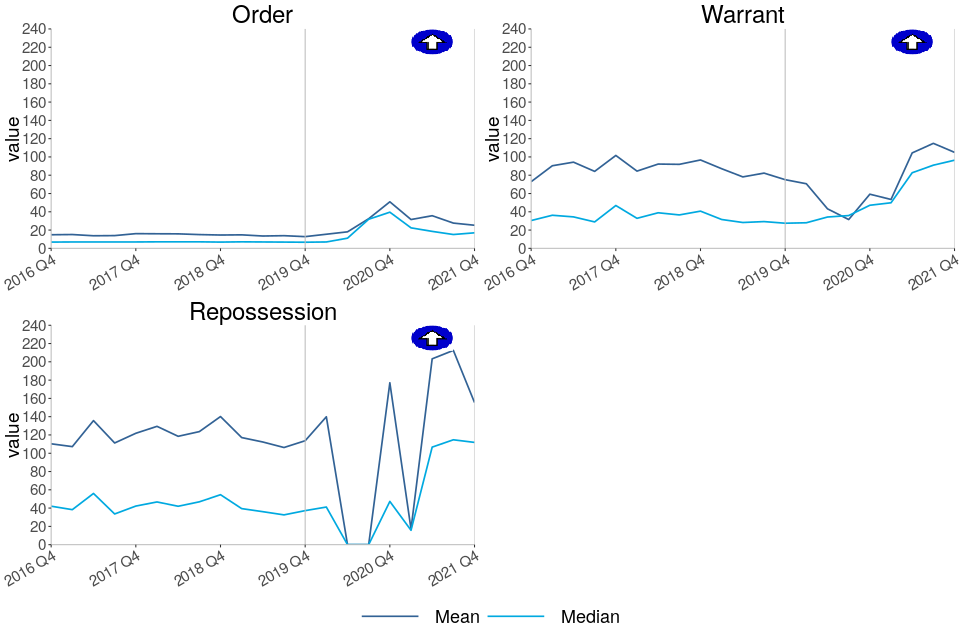
Median timeliness figures are volatile for mortgage orders, warrants and repossessions due to low volumes being processed and the impact of Covid-19 on these low volumes.
Median average time has increased for orders and warrants. As the courts continue to recover, it is unlikely that these timeliness figures are representative of any statistical trend and instead reflect the pause in actions, therefore, caution should be used when interpreting these results.
The median average time from claim to repossession has increased to 111.9 weeks, up from 37.2 weeks in the same period in 2019. However, it should be noted this is based on much fewer cases.
Figure 2: Average timeliness of mortgage possession actions, October to December 2016 to October to December 2021 (Source: Table 3)
Number of weeks taken from initial mortgage claim to…
-
Claims to order median timeliness has increased to 17.0 weeks, up from 6.7 weeks in the same period in 2019.
-
Claims to warrant median timeliness has increased to 96.4 weeks, up from 27.5 weeks in the same period in 2019.
-
Claims to repossession median timeliness has increased to 111.9 weeks, up from 37.2 weeks in the same period in 2019.
The above charts distinguish between the timeliness of possession claims at different stages of a case. Average time taken from claim to warrant or repossession can fluctuate and is affected by various factors. For example, the final two charts take account of the amount of time between the court order being issued and the claimant, such as the mortgage lender, applying for a warrant of possession.
The short-term increases noted over the past few quarters reflect the stay on most possession claims implemented between March and September 2020 for case progression and the stay to evictions (with some exceptions) implemented between March 2020 and June 2021. Those cases that have progressed to repossession therefore include the duration of the stay within their timeliness. This “hold stay period” will form part of many possession actions over the next few quarters.
The long-term increases in the mean average time from claim to warrant and claim to repossession are due to an increasing proportion of historic claims (dating from 2007 to 2013) reaching the warrant and repossession stages respectively in recent quarters. This is possibly due to defendants recently breaking the terms of the mortgage agreements put in place at the start of the process. Although these historical outlying cases inflate the mean average, they have less effect on the median.
5. Overview of Landlord Possession
The number of landlord possession actions for all court stages have increased compared to the same quarter of last year but remains significantly reduced in comparison to the same quarter in 2019.
As a result of coronavirus and associated policy actions, all landlord possession actions have dropped significantly. Compared to the same quarter in 2019, landlord possession actions; claims (14,433), orders for possession (6,849), warrants (4,256) and repossessions (2,706) have decreased by 43%, 67%, 67% and 64% respectively.
Figure 3: Landlord possession actions (actual and seasonally adjusted) in the county courts of England and Wales, October to December 2016 to October to December 2021 (Source: Table 10b)
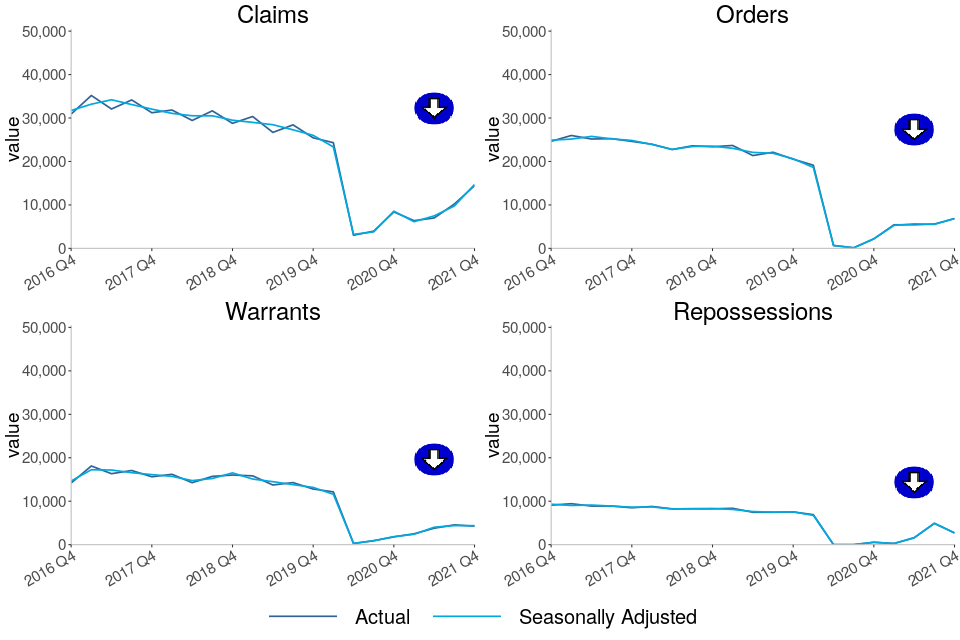
In October to December 2021, a far fewer proportion (33% or 4,807) of all landlord possession claims were social landlord claims, and 26% (3,714) were accelerated claims. Private landlord claims made up the largest proportion of landlord claims (41% or 5,912).
This contrasts with previous quarters. For example, in October to December 2019, the majority (60% or 15,369) of all landlord possession claims were social landlord claims, while accelerated claims and private landlord claims made up just 17% and 22% of all landlord claims respectively.
The fall in claim and orders volumes is observed across all geographical regions. As in previous quarters, a concentration was seen in London, with 3,730 landlord claims and 1,572 landlord orders at London courts in October to December 2021, accounting for 26% and 23% of the respective totals. Despite this, in London, there were still decreases of 41% (from 6,344) for landlord claims and 63% for landlord orders (from 4,268 in October to December 2019).
The 67% decrease in landlord warrants compared to October to December 2019, was accompanied by large decreases across all regions. The largest regional number (1,332) was again found in London, making up 31% of all landlord warrants. Despite this, there was a decrease of 60% for landlord warrants in London (from 3,355 in October to December 2019 to 1,332 in October to December 2021).
6. Landlord Possession Timeliness[footnote 1]
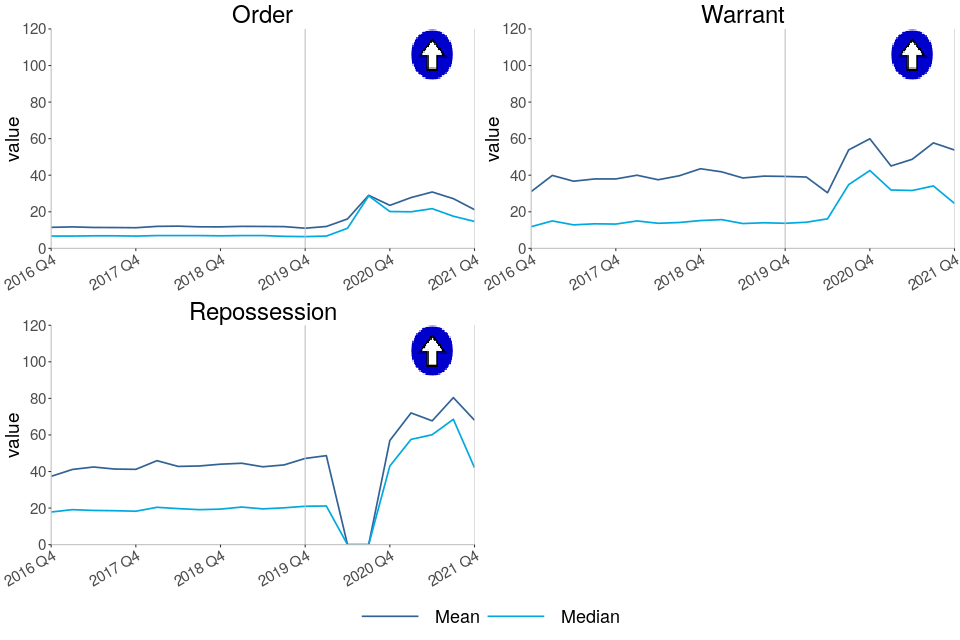
Median timeliness figures are volatile for landlord orders, warrants and repossessions due to low volumes being processed and the impact of Covid-19 on those low volumes.
Median and mean average time has increased for orders, warrants and repossessions. However due to the low volumes of possession actions this quarter, caution should be used when interpreting these results. It is unlikely that these timeliness figures are representative of any statistical trend and will instead reflect the pause in actions.
The median average time from claim to repossession has increased to 42.1 weeks, up from 21.0 weeks in the same period in 2019.
Figure 4: Mean and median average timeliness of landlord possession actions, October to December 2016 to October to December 2021 (Source: Table 6)
Number of weeks taken from initial landlord claim to…
-
Claims to order median timeliness has increased to 14.7 weeks, up from 6.4 weeks in the same period in 2019.
-
Claims to warrant median timeliness has increased to 24.6 weeks, up from 13.7 weeks in the same period in 2019.
-
Claims to repossessions median timeliness has increased to 42.1 weeks, up from 21.0 weeks in the same period in 2019.
The short-term increases noted over the past few quarters reflect the stay on most possession claims implemented between March and September 2020 for case progression and the ongoing stay to evictions (with some exceptions). Those cases that have progressed to repossession therefore, include the duration of the stay within their timeliness. This “hold stay period” will form part of many possession actions over the next few quarters.
As shown by Figure 4, median figures are generally considerably lower than mean figures, demonstrating that on average, the progression from claim to successive stages can be positively skewed by outlying cases when using a mean measure of average timeliness.
7. Regional Possession Claims
Middlesbrough in the North East region had the highest rate of mortgage possession claims at 33 per 100,000 households, followed by Merton (London region) and South Holland (East Midlands region); with 29 and 27 claims per 100,000 respectively. Note that these rates are based on relatively low numbers and so the relativities between areas should be treated with caution.
The majority of the highest landlord possession claim rates were found in London, with 9 of the 10 highest rates occurring in this region. Slough had the highest rate (174 per 100,000 households).
Figure 5: Mortgage possession Claims per 100,000 households, October to December 2021 (Source: map.csv; see supporting guide)
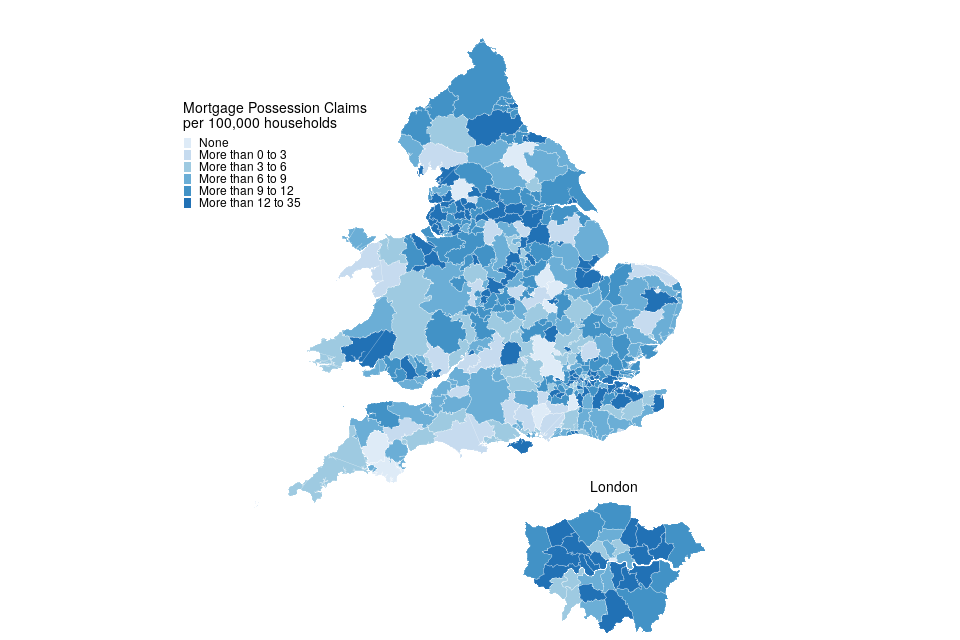
| Local Authority | Rate (per 100,000 households) | Actual number |
|---|---|---|
| Middlesbrough | 33 | 19 |
| Merton | 29 | 23 |
| South Holland | 27 | 11 |
15 local authorities had no possession claims during this period. Excluding these, East Hertfordshire had the lowest rate of mortgage claims (1.6 per 100,000 households).
Figure 6: Landlord possession Claims per 100,000 households, October to December 2021 (Source: map.csv; see supporting guide)
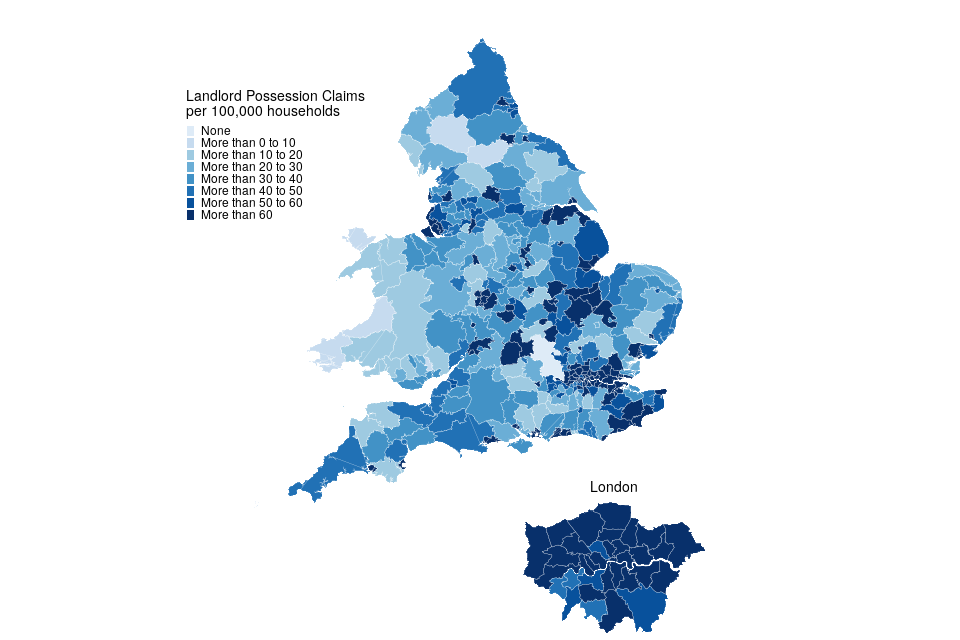
| Local Authority | Rate (per 100,000 households) | Actual number |
|---|---|---|
| Slough | 174 | 96 |
| Lewisham | 169 | 222 |
| Newham | 161 | 185 |
London boroughs accounted for 9 of the 10 local authorities with the highest rate of landlord claims.
2 local authorities had no landlord claims during this period. Excluding this, Eden had the lowest rate of landlord claims (4.1 per 100,000 households).
8. Regional Repossessions (by County Court Bailiffs)
Hartlepool had the highest overall rate of mortgage repossessions at 9.5 per 100,000 households.
Landlord repossessions were highest in Newham with 80 per 100,000 households and were generally concentrated in London (9 out of the 10 highest rates).
Figure 7: Mortgage repossessions per 100,000 households, October to December 2021 (Source: map.csv; see supporting guide)
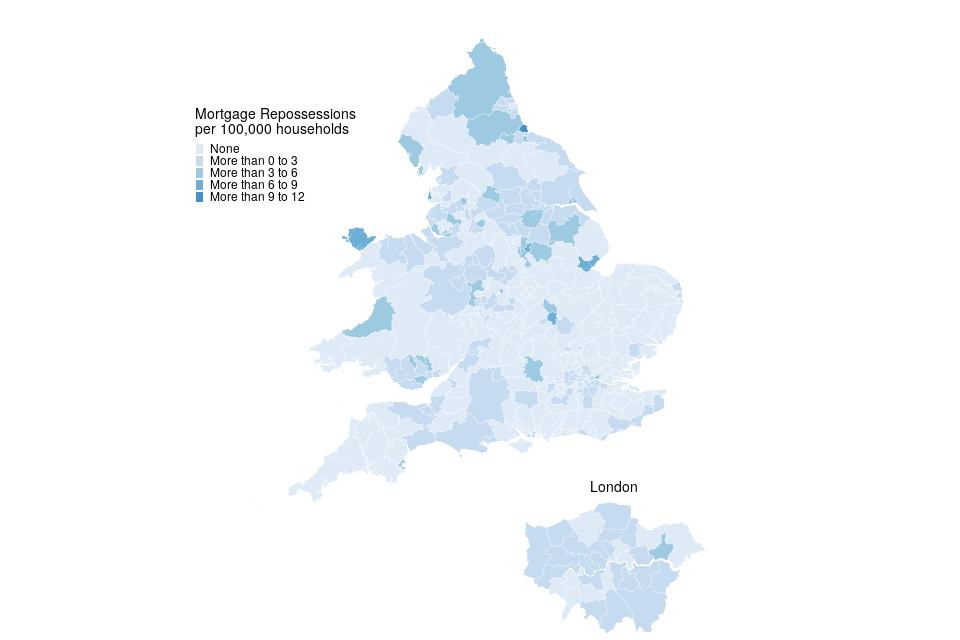
No repossessions by county court bailiffs were recorded during this period in 186 local authorities.
Figure 8: Landlord repossessions per 100,000 households, October to December 2021(Source: map.csv; see supporting guide)
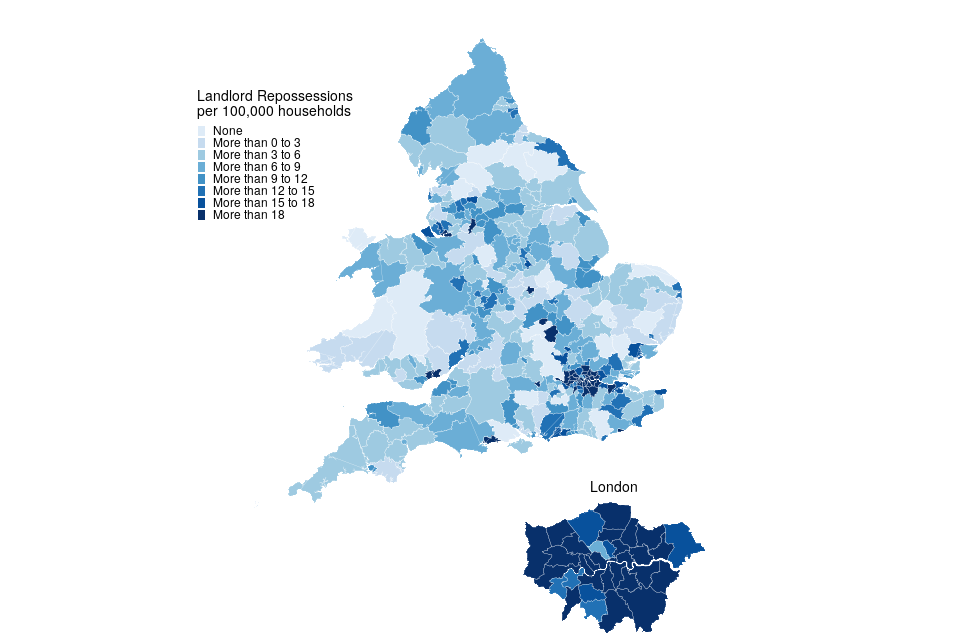
| Local Authority | Rate (per 100,000 households) | Actual number |
|---|---|---|
| Newham | 80 | 92 |
| Lewisham | 58 | 76 |
| Greenwich | 45 | 51 |
London local authorities account for 9 of the 10 boroughs with the highest rate of landlord repossessions.
27 local authorities had no landlord repossessions by county court bailiffs in October to December 2021.
9. Further information
The statistics in the latest quarter are provisional and revisions may be made when the next edition of this bulletin is published. If revisions are needed in subsequent quarters, these will be annotated in the tables.
9.1 Accompanying files
As well as this bulletin, the following products are published as part of this release:
-
A supporting guide providing further information on how the data is collected and processed, including a guide to the csv files, as well as legislation relevant to mortgage possessions and background information.
-
A set of overview tables, covering key sections of this bulletin.
-
CSV files of the map data and the possession action volumes by local authority and county court.
-
A CSV file of monthly data.
-
A data visualisation tool which provides a detailed view of the Mortgage and Landlord statistics. We welcome feedback on this tool to help improve it in later editions and to ensure it meets user needs.
9.2 National Statistics status
National Statistics status means that official statistics meet the highest standards of trustworthiness, quality and public value.
All official statistics should comply with all aspects of the Code of Practice for Statistics. They are awarded National Statistics status following an assessment by the Authority’s regulatory arm. The Authority considers whether the statistics meet the highest standards of Code compliance, including the value they add to public decisions and debate.
It is the Ministry of Justice’s responsibility to maintain compliance with the standards expected for National Statistics. If we become concerned about whether these statistics are still meeting the appropriate standards, we will discuss any concerns with the Authority promptly. National Statistics status can be removed at any point when the highest standards are not maintained, and reinstated when the standards are restored. These statistics have been audited and re-accredited as National Statistics. The most recent compliance check completed by the Office of Statistics Regulation can be found here.
9.3 Future publications
Our statisticians regularly review the content of publications. Development of new and improved statistical outputs is usually dependent on reallocating existing resources. As part of our continual review and prioritisation, we welcome user feedback on existing outputs including content, breadth, frequency and methodology. Please send any comments you have on this publication including suggestions for further developments or reductions in content.
9.4 Contact
Press enquiries should be directed to the Department for Levelling Up, Housing and Communities press office:
email: newsdesk@communities.gov.uk
Other enquiries and feedback on these statistics should be directed to the Data and Evidence as a Service division of the Ministry of Justice:
Rita Kumi-Ampofo - email: CAJS@justice.gov.uk
Next update: 19 May 2022
© Crown Copyright
Produced by the Ministry of Justice
Alternative formats are available upon request from ESD@justice.gov.uk
-
The law requires at least 4 and no more than 8 weeks between claim and court hearing. Possession orders stipulate when a tenant must vacate the property - typically within 4 weeks from the date the order was made. Landlords cannot issue a warrant until after this period (if the tenant has failed to comply). ↩