Mortgage and landlord possession statistics: October to December 2020
Published 11 February 2021

© Crown copyright 2021
This publication is licensed under the terms of the Open Government Licence v3.0 except where otherwise stated. To view this licence, visit nationalarchives.gov.uk/doc/open-government-licence/version/3 or write to the Information Policy Team, The National Archives, Kew, London TW9 4DU, or email: psi@nationalarchives.gov.uk.
Where we have identified any third party copyright information you will need to obtain permission from the copyright holders concerned.
This publication is available at https://www.gov.uk/government/statistics/mortgage-and-landlord-possession-statistics-october-to-december-2020/mortgage-and-landlord-possession-statistics-october-to-december-2020
1. Main Points
| All possession actions by both landlords and mortgage providers have reduced significantly following Covid-19 impact and associated actions | FCA announcements and the passing of the Coronavirus Act in March 2020 means that possession actions of all types have dropped to unprecedentedly low levels. As a result, the data is unlikely to be representative of general trends in possession actions. Caution should therefore be used when interpreting and applying these figures. |
| Mortgage claims, orders, warrants and repossessions have decreased significantly | Compared to the same quarter last year, mortgage possession claims, orders, warrants and repossessions by county court bailiffs have decreased by 96%, 99%, 99% and 99% respectively. |
| Landlord possession actions have also all decreased significantly | Landlord possession claims, orders, warrants and repossessions by county court bailiffs have decreased by 67%, 89%, 86% and 93% respectively (compared to the same quarter last year). |
| Mortgage and Landlord possession claims, and repossession rates have fallen across all regions | Decreases in possession claims have been recorded over all regions. Landlord claims remain concentrated in London (with 8 of the highest 10 claim rates). |
| Mortgage median average time (from claim to repossession) has increased to 47.3 weeks | The median average time from claim to mortgage repossession has increased to 47.3 weeks, up from 37.1 weeks in the same period in 2019. |
| Median timeliness for landlord repossessions has increased to 43.0 weeks | The median average time from claim to landlord repossession has increased to 43.0 weeks, up from 21.0 weeks in the same period in 2019. |
This publication provides mortgage and landlord possession statistics in October to December 2020, compared to the same quarter the previous year. For technical detail, please refer to the accompanying supporting document.
A new data visualization tool has also been published this quarter that provides further breakdowns in a web-based application. The tool can be found here.
For feedback related to the content of this publication and visualisation tool, please contact us at CAJS@justice.gov.uk
2. Statistician’s Comment
The latest quarter in this publication covers the second national lockdown. The impact this time has not been as stark on the courts as the first lockdown due to experience and lessons learned from managing previous restrictions and various policy interventions that were put in place.
All possession actions remain significantly low across all regions. The previous quarter (Jul-Sep) saw increased volumes of reactivation notices which had been previously stayed when restrictions were partially lifted. We expected the reactivations to continue increasing this quarter, however, this has not been the case. There were 2,990 reactivations this quarter. Over half of these were reactivated in October (1,595). The volumes dropped to 395 (13%) by December as a consequence of the second national lockdown in November. There was a pause in possession actions which was a consequence of policy changes such as an increase of notice periods from 3 to 6 months (apart from in the most egregious cases where tenants have demonstrated anti-social behaviour or committed fraud).
Following the halt to all county court bailiff repossessions in quarters 2 and 3 of 2020, a small number of repossessions did take place in Q4. It has thus been possible to provide “timeliness” data for this quarter and this has increased due to the pause placed on all such possessions actions (and that the time is taken from the initial claim without accounting for any enforced pauses). The increase noted should be taken in the context of extremely small volumes and the invariable additional time needed where normal courts procedures could not be followed.
While these statistics are of interest to the public, it is worth noting that the small volumes of repossession actions mean that the data is unlikely to be representative of general trends in possessions. Caution should therefore be used when interpreting and applying these figures. With regard to future publications, our statistical teams will consider the impact of the pause in repossessions in the timeliness series when we publish the average timeliness estimates.
3. Overview of Mortgage Possession
Mortgage possession figures have dropped significantly, with claims, orders, warrants and repossessions all dropping by more than 96% in comparison to October-December 2019
As a result of coronavirus and associated actions, all mortgage possession actions have dropped significantly. Compared to the same quarter in the previous year, mortgage possession claims (255), are down 96%. Mortgage orders for possession (29) are down 99%, warrants issued (45) are down 99% and repossessions (7) are down 99%.
Figure 1: Mortgage possession actions (actual and seasonally adjusted) in the county courts of England and Wales, October to December 2015 to October to December 2020 (Source: Table 10a)
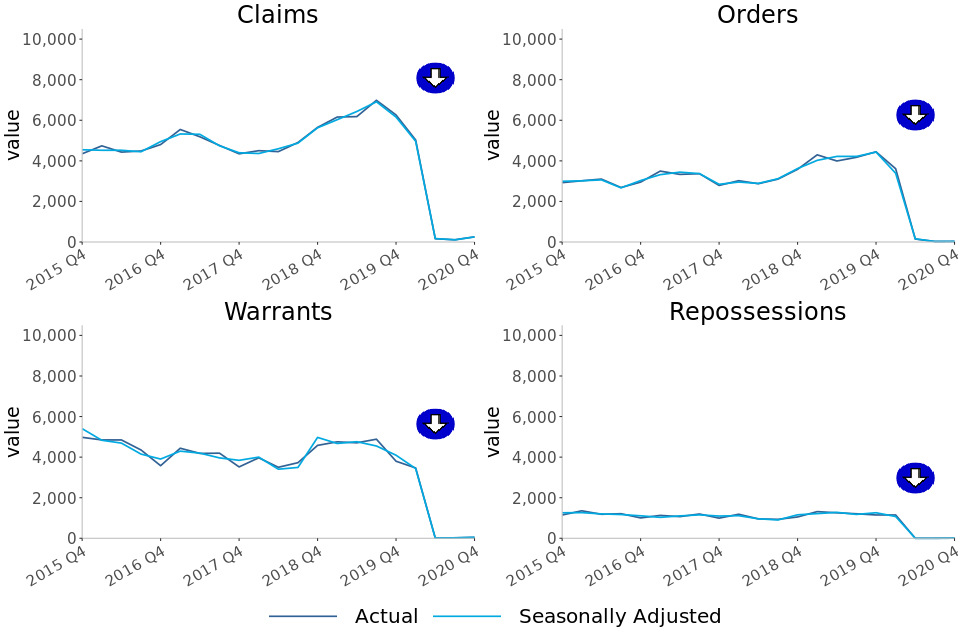
Mortgage possession claims fell from a peak of 26,419 in April to June 2009 before stabilising from April to June 2015 (4,849). In the most recent quarter, October to December 2020, there were 255 claims for possession, down 96% from the same quarter in 2019.
Orders and warrants for possession followed a similar trend to mortgage claims, falling from a peak of 23,850 orders in July to September 2009 and 21,350 warrants in January to March 2009, and stabilizing around 2016/17. Compared to the same quarter of the previous year, orders are down 99% to 29 and warrants are down 99% to 45 in October to December 2020.
Historically, repossessions by county court bailiffs fell from a high of 9,284 in Q1 of 2009 to 934 in Q3 of 2018, the lowest recorded level of the series at the time. Following the complete cessation of repossession proceedings in the previous quarter where no repossessions took place, there were 7 repossessions in October to December 2020, down 99% compared to the same quarter in 2019.
Before the impact of coronavirus, the historical fall in the number of mortgage possession actions since 2008 has generally coincided with lower interest rates, a proactive approach from lenders in managing consumers in financial difficulties and other interventions, such as the Mortgage Rescue Scheme and the introduction of the Mortgage Pre-Action Protocol. Additionally, the downward trend seen in recent years mirrors that seen in the proportion of owner-occupiers.
4. Mortgage Possession Action Timeliness
Median timeliness figures in recent quarters are volatile for mortgage orders, warrants and repossessions due to low volumes being processed
Median average time has increased for orders, warrants and repossessions. However due to the low volumes of possession actions this quarter, caution should be used when interpreting these results. It is unlikely that these timeliness figures are representative of any statistical trend and instead reflect the pause in actions and the wider impact on the courts.
The median average time from claim to repossession has increased to 47.3 weeks, up from 37.1 weeks in the same period in 2019.
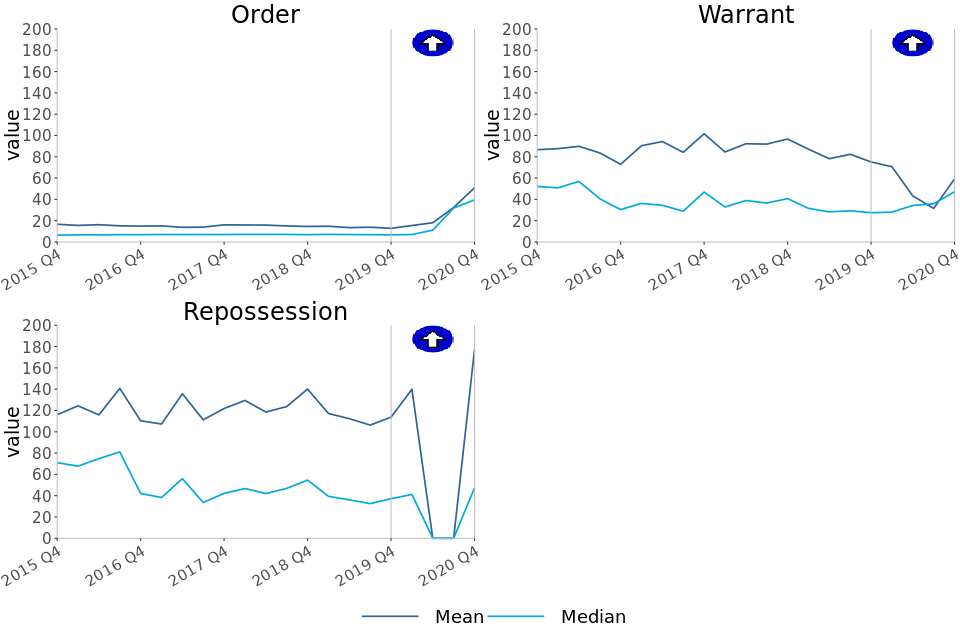
Figure 2: Average timeliness of mortgage possession actions, October to December 2015 to October to December 2020 (Source: Table 3)
Number of weeks taken from initial mortgage claim to…
-
Claims to order median timeliness has increased to 39.6 weeks, up from 6.7 weeks in the same period in 2019.
-
Claims to warrant median timeliness has increased to 47.1 weeks, up from 27.5 weeks in the same period in 2019.
-
Claims to repossession median timeliness has increased to 47.3 weeks, up from 37.1 weeks in the same period in 2019.
The above charts distinguish between the timeliness of possession claims at different stages of a case. Average time taken from claim to warrant or repossession can fluctuate and is affected by various factors. For example, the final two charts take account of the amount of time between the court order being issued and the claimant, such as the mortgage lender, applying for a warrant of possession.
The short-term increases noted over the past few quarters reflect the stay on most possession claims implemented between March and September for case progression and the ongoing stay to evictions (with some exceptions). Those cases that are able to progress to repossession therefore include the duration of the stay within their timeliness. This “hold stay period” will form part of many possession actions over the next few quarters.
The long-term increases in the mean average time from claim to warrant and claim to repossession are due to an increasing proportion of historic claims (dating from 2007 to 2013) reaching the warrant and repossession stages respectively in recent quarters. This is possibly due to defendants recently breaking the terms of the mortgage agreements put in place at the start of the process. Although these historical outlying cases inflate the mean average, they have less effect on the median.
5. Overview of Landlord Possession
The number of landlord possession actions for all court stages has also decreased significantly, with claims down 67% and the other stages down at least 86% in comparison to the same quarter of last year
As a result of coronavirus and associated policy actions, all landlord possession actions have dropped significantly. Compared to the same quarter the previous year, landlord possession actions; claims (8,382), orders for possession (2,195), warrants (1,792) and repossessions (548) have decreased by 67%, 89%, 86% and 93% respectively.
Figure 3: Landlord possession actions (actual and seasonally adjusted) in the county courts of England and Wales, October to December 2015 to October to December 2020 (Source: Table 10b)
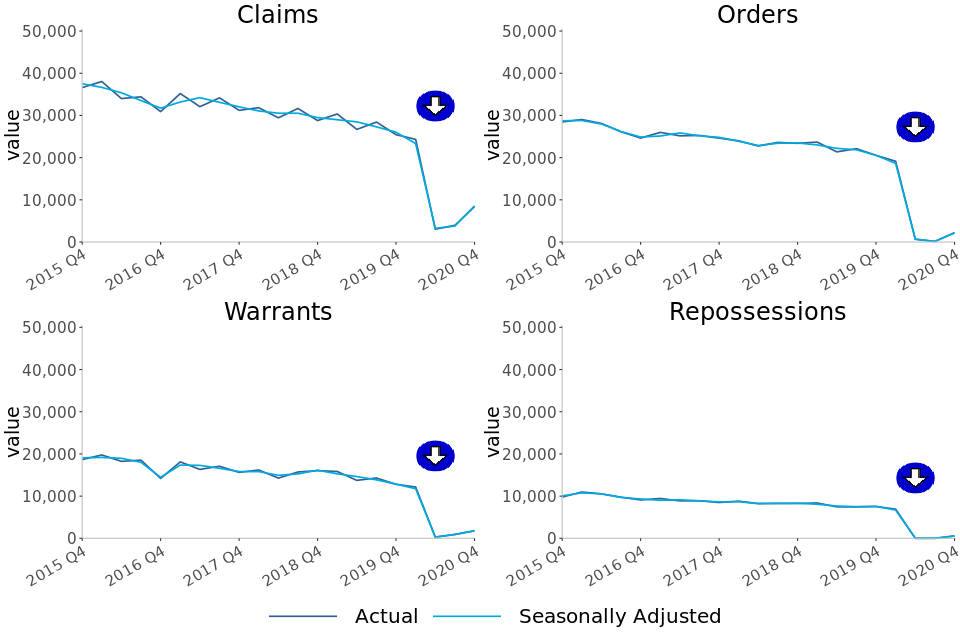
In October to December 2020, 27% (2,268) of all landlord possession claims were social landlord claims, and 30% (2,495) were accelerated claims. The group making up the largest proportion of landlord claims (43% or 3,619) were private landlord claims.
This is in contrast to previous quarters. For example, in October to December 2019, the majority (60% or 15,369) of all landlord possession claims were social landlord claims, and accelerated claims and private landlord claims made up just 17% and 22% of all landlord claims respectively.
The fall in claim and orders volumes is observed across all geographical regions. As in previous quarters, the majority of claims were in London wich had 2,379 landlord claims (accounting for 28% of all landlord possession claims), this was followed by the South East which had 1,922 landlord claims (23%). On the other hand, the South East had a higher number of orders than London, with 455 landlord orders in the South East and 349 in London for October to December 2020 (making up 16% of all landlord possession orders for London and 21% for the South East). Compared to October to December 2019, London still saw a decrease of 63% (from 6,344) for landlord claims, and the South East saw a decrease of 88% (from 3,910) for landlord orders.
The 86% decrease in landlord warrants in October to December 2020 when compared to October to December 2019, was again accompanied by large decreases across all regions. The largest regional number of warrants (429) was found in London, closely followed by the South East (424), both making up 24% of all landlord warrants. There was a decrease of 83% for landlord warrants in the South East (from 2,505 in October to December 2019 to 424 in October to December 2020). Likewise, there was a decrease of 87% for landlord warrants in London (from 3,355 in October to December 2019 to 429 in October to December 2020).
6. Landlord Possession Timeliness[footnote 2]
Median timeliness figures in recent quarters are volatile for landlord orders, warrants and repossessions due to low volumes being processed
Median and mean average time has increased for orders, warrants and repossessions. However due to the low volumes of possession actions this quarter, caution should be used when interpreting these results. It is unlikely that these timeliness figures are representative of any statistical trend in timeliness and will instead reflect the pause in actions.
The median average time from claim to repossession has increased to 43.0 weeks, up from 21.0 weeks in the same period in 2019.
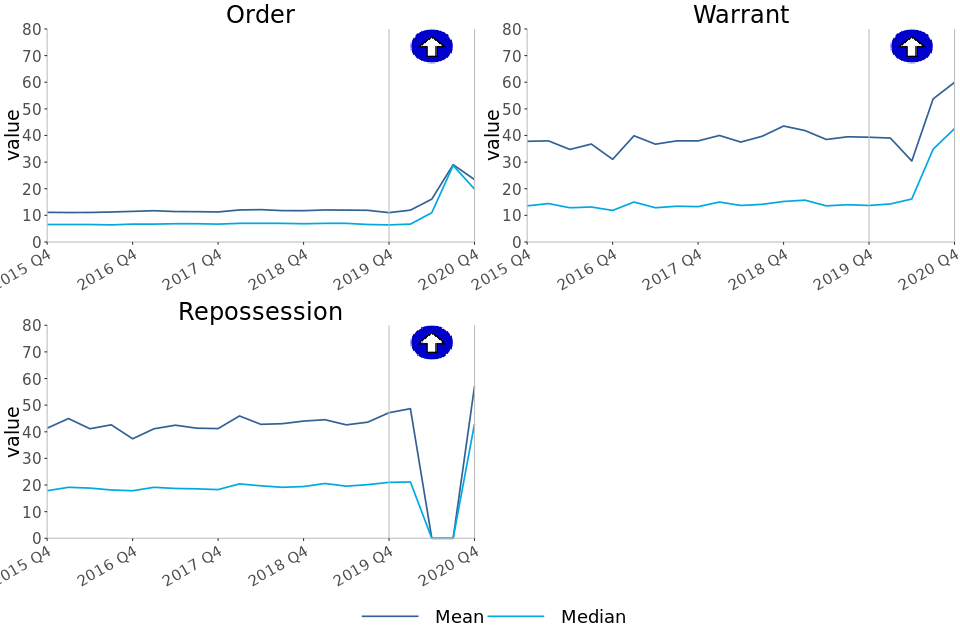
Figure 4: Mean and median average timeliness of landlord possession actions, October to December 2015 to October to December 2020 (Source: Table 6)
Number of weeks taken from initial landlord claim to…
-
Claims to order median timeliness has increased to 19.9 weeks, up from 6.4 weeks in the same period in 2019.
-
Claims to warrant median timeliness has increased to 42.6 weeks, up from 13.7 weeks in the same period in 2019.
-
Claims to repossessions median timeliness has increased to 43.0 weeks, up from 21.0 weeks in the same period in 2019.
The short-term increases noted over the past few quarters reflect the stay on most possession claims implemented between March and September for case progression and the ongoing stay to evictions (with some exceptions). Those cases that are able to progress to repossession therefore include the duration of the stay within their timeliness. This “hold stay period” will form part of many possession actions over the next few quarters.
Also, as shown by Figure 4, median figures are generally considerably lower than mean figures, demonstrating that on average, the progression from claim to successive stages can be positively skewed by outlying cases when using a mean measure of average timeliness.
7. Regional Possession Claims
Dartford in the South East region had the highest rate of mortgage possession claims at 8.7 per 100,000 households, followed by Runnymede (South East region) and Isle of Anglesey (Wales region); with 8.6 and 6.4 claims per 100,000 respectively. Note that these rates are based on small numbers of possession claims only.
The majority of the highest landlord possession claim rates were found in London, with 8 of the 10 highest rates occurring in the London region. However, Newham had the highest rate (118 per 100,000 households).
Figure 5: Mortgage possession Claims per 100,000 households, October to December 2020 (Source: map.csv; see supporting guide)
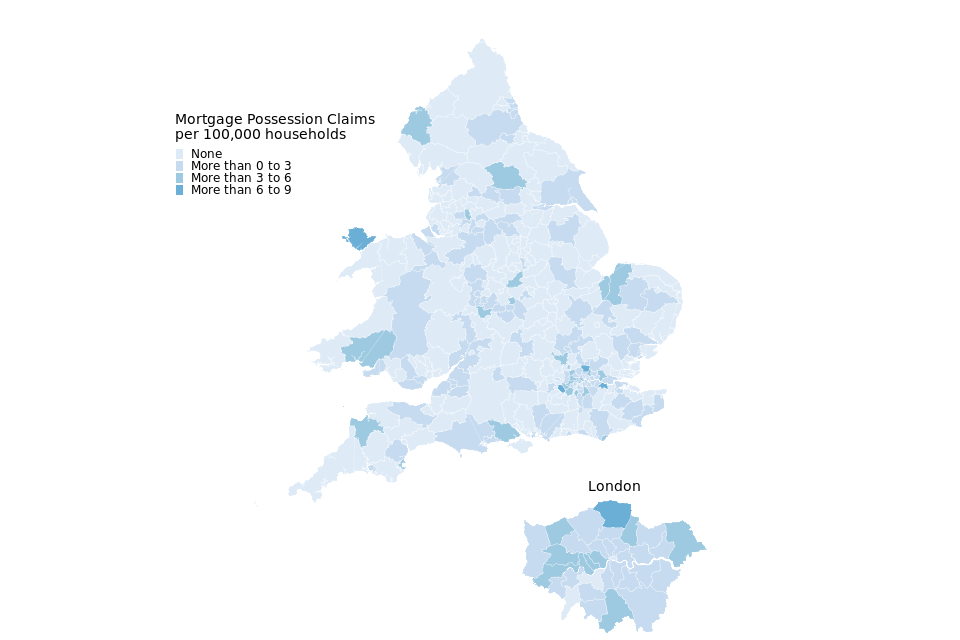
| Local Authority | Rate (per 100,000 households) | Actual number |
|---|---|---|
| Dartford | 8.7 | 4 |
| Runnymede | 8.6 | 3 |
| Isle of Anglesey | 6.4 | 2 |
200 local authorities had no mortgage possession claims during this period. Excluding these, Sheffield had the lowest rate of mortgage claims (0.4 per 100,000 households).
Figure 6: Landlord possession Claims per 100,000 households, October to December 2020 (Source: map.csv; see supporting guide)
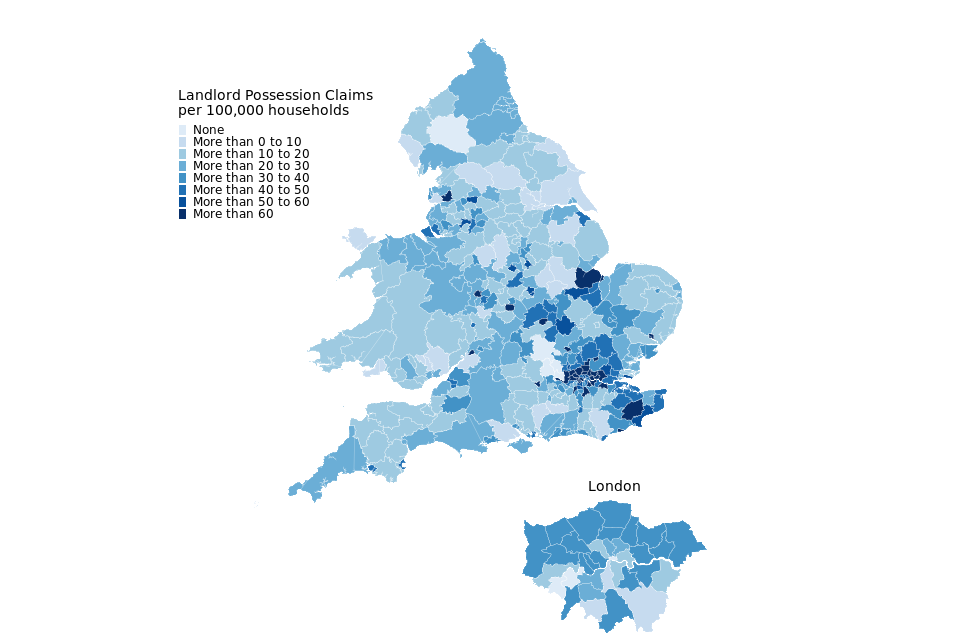
| Local Authority | Rate (per 100,000 households) | Actual number |
|---|---|---|
| Newham | 118 | 135 |
| Brent | 115 | 134 |
| Ealing | 106 | 131 |
London boroughs account for 8 of the 10 local authorities with the highest rate of landlord claims.
6 local authorities had no landlord claims during this period. Excluding this, Derbyshire Dales had the lowest rate of landlord claims (3.1 per 100,000 households).
8. Regional Repossessions (by County Court Bailiffs)
Due to very low numbers of mortgage repossessions this quarter, no mortgage repossession rates were calculated as they may be misleading.
Landlord repossessions were highest in Medway with 30 per 100,000 households. Landlord repossessions were mainly concentrated in the South East (6 out of the 10 highest rates), followed by the South West (the 3 highest rates).
Figure 7: Mortgage repossessions per 100,000 households, October to December 2020 (Source: map.csv; see supporting guide)
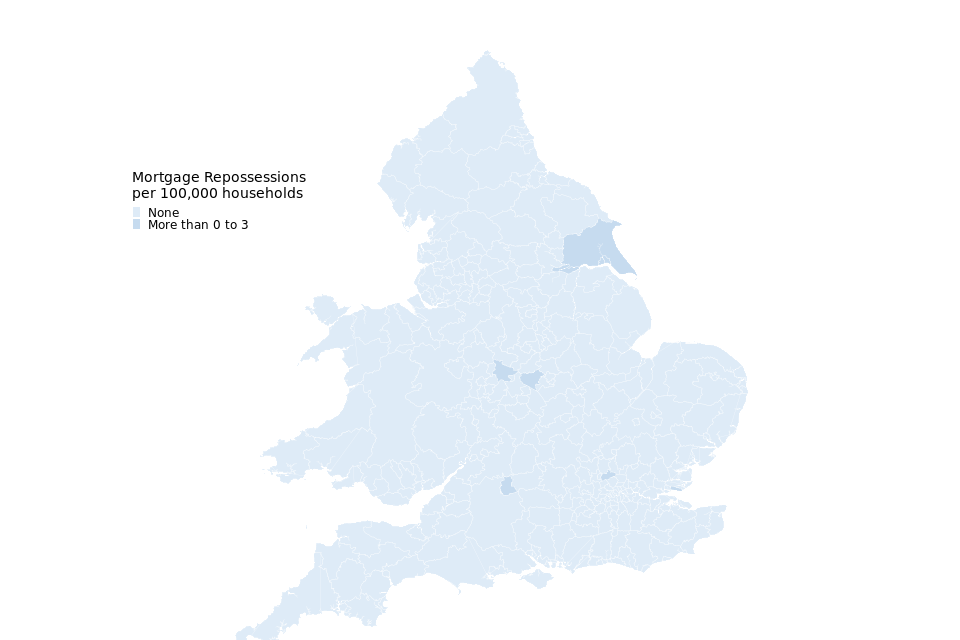
No repossessions by county court bailiffs were recorded during this period in 332 local authorities Of the remaining 7 local authorities that recorded repossessions, none recorded more than one.
The local authorities that recorded one repossession were; Kingston upon Hull, East Riding of Yorkshire, Swindon, Hinckley and Bosworth, Southend-on-Sea, Hertsmere and Lichfield. We have not used these figures to calculate rates per 100,000 households as the figures are so low and the resulting relativities between local authorities could be misleading.
Figure 8: Landlord repossessions per 100,000 households, October to December 2020 (Source: map.csv; see supporting guide)

| Local Authority | Rate (per 100,000 households) | Actual number |
|---|---|---|
| Medway | 30 | 34 |
| Milton Keynes | 17 | 18 |
| Gravesham | 16 | 7 |
South East account for 6 out of the 10 local authorities with the highest rate of landlord repossessions. This was followed by the South West which contained 3 out of the 10 of the highest rates.
184 local authorities had no landlord repossessions by county court bailiffs in October to December 2020.
9. Annex: Impact of changes in possession process related to Coronavirus
To respond to the coronavirus pandemic, there have been a number of policy interventions in the possession process. These have had an impact on possessions data from March 2020 throughout the second, third and fourth quarters of 2020 and this annex provides a monthly breakdown of this data[footnote 10].
The Master of the Rolls, with the agreement of the Lord Chancellor, suspended all ongoing housing possession cases[footnote 3] for 90 days from 27 March 2020[footnote 4]. The original legislation was subsequently extended by a further two months to 23 August 2020[footnote 5] and then an additional month was added before the stay was lifted on 21 September 2020[footnote 6]. Possession claims could be made during the stay but could not progress through the court until it was lifted.
The courts began to process possession cases from 21 September 2020. However, under Financial Conduct Authority (FCA) guidance, mortgage lenders were advised not to commence or continue possession proceedings against customers until 31 October 2020[footnote 7]. This has been further extended by the FCA and the guidance now expects mortgage firms to not enforce repossessions before 1 April 2021[footnote 1]. Therefore, it was primarily landlord cases that progressed through the courts during October to December.
Possession claims made before 3 August 2020 with no possession order made prior to 27 March 2020 needed to be reactivated after the end of the stay. These claims can only be reactivated by the claimant or defendant completing a reactivation notice and sending it to the court[footnote 8]. The claimant also had to provide what information they had about the impact of the coronavirus pandemic on the defendant, otherwise their case could be adjourned.
Possession claims can only be made after the relevant notice period has ended. In England and Wales, legislation has been passed to extend the notice periods which landlords must provide, except in the most serious circumstances. This will have a consequential effect on the volume of Claims for Possession being made by landlords from 2020 Q4 onwards.
In England, regulations were passed in August to extend notice periods in most private and social rented sector tenancies to six months except for in the most serious circumstances, such as anti-social behaviour or extreme rent arrears. Notice periods had previously been three months for notices issued between 26 March and 28 August 2020.
In Wales, notice periods given to tenants from the 26 March to 23 July 2020 had to be at least three months for all kinds of notice. Notice periods given on or after 24 July 2020 had to be at least six months, other than for grounds relating to anti-social behaviour which remained at 3 months until 28 September 2020 but have returned to their pre-Coronavirus Act 2020 lengths of one month or less, depending on the type of tenancy and ground used. The notice period for the eviction of a perpetrator of domestic abuse in a social tenancy in Wales returned to its pre-Coronavirus Act length for notices served after 29 September 2020.
New arrangements introduced to coincide with the resumption of possession proceedings on 21 September included a Review stage[footnote 9]. The new court arrangements required there to be at least 21 days’ notice of the Review date, and a further 28 days between the Review and the Substantive hearing. Reviews and Substantive Hearings did not take place in significant numbers until the last part of the Quarter. This will affect the volume of Possession Orders in this Quarter, because Orders can only generally be made in Private and Social Landlord cases at a substantive hearing, or at the new Review stage.
Prior to 21 September 2020, claimants who had a valid Possession Order could apply for a Warrant of Possession. The court would issue the Warrant but no eviction date would be set and no repossession would be carried out. From 21 September, courts began processing Warrants of Possession. However, local or national restrictions on repossession were in place throughout Q4.
During Q4, mortgage lenders were instructed by the FCA not to carry out enforcement activity. This was initially through an instruction not to continue any court action (until 30 October); lenders were subsequently advised, on 20 November, that court action up to and including an Order for Possession could proceed, but that the enforcement of repossession should not be sought until after 31 January 2021[footnote 8]. This has since been extended to 1 April 2021.
In England, bailiffs were asked not to carry out repossessions in local lockdown areas from 21 September (later, Local Covid Alert Areas or Tiers 2 and 3). Bailiffs were later asked not to carry out repossessions throughout England during the national lockdown from 5 November, and this was put on a legislative footing through Regulations which came into force on 17 November 2020[footnote 11]. However, there were some exemptions to the Regulations for serious circumstances, such as illegal occupation, anti-social behaviour and extreme rent arrears. The Regulations extended beyond the end of the national lockdown on 2 December 2020, to 11 January 2021. The restriction has since been renewed until at least the end of 21 February 2021 and is being kept under review[footnote 12].
In Wales, bailiffs were asked not to carry out repossessions during the Coronavirus firebreak between 23 October and 9 November. On 11 December 2020, regulations were introduced to prevent repossession in Wales until 11 January 2021, with exceptions for illegal occupation, domestic abuse in social tenancies and anti-social behaviour[footnote 13]. The restriction has since been renewed until 31 March 2021, although this is subject to periodic review[footnote 14].
Due to coronavirus, a repossession may be postponed even if it is exempt from the restriction. This is because bailiffs will not carry out a repossession at a property if they become aware, either in advance or upon attending the property, that anyone living there has Coronavirus, is self-isolating or has been identified as Clinically Extremely Vulnerable. In these circumstances, the eviction will be rescheduled with a minimum of 14 days’ notice.
Whilst these measures have impacted all of 2020 to date, the effect on Q1 (Jan-Mar) was not consistent throughout the quarter, with the most significant impact observed during the final days of March. Further, though the impact was generally as expected throughout the second and third quarter, there remains significant public interest in the monthly breakdown of these possession actions. This annex aims to more clearly demonstrate the impact of COVID-19-related action on the possession process. The initial claim stage and warrant issue stage have been chosen as they are considered to be representative of the early and late stages of a typical possession action, the repossession stage has also been chosen as the restrictions have had the biggest impact on this particular stage.
Alongside the figures for 2019 and 2020, we have presented a 5-year average which can be considered a baseline. This 5-year average is measured from 2015-2019 to exclude the anomalies seen in 2020.
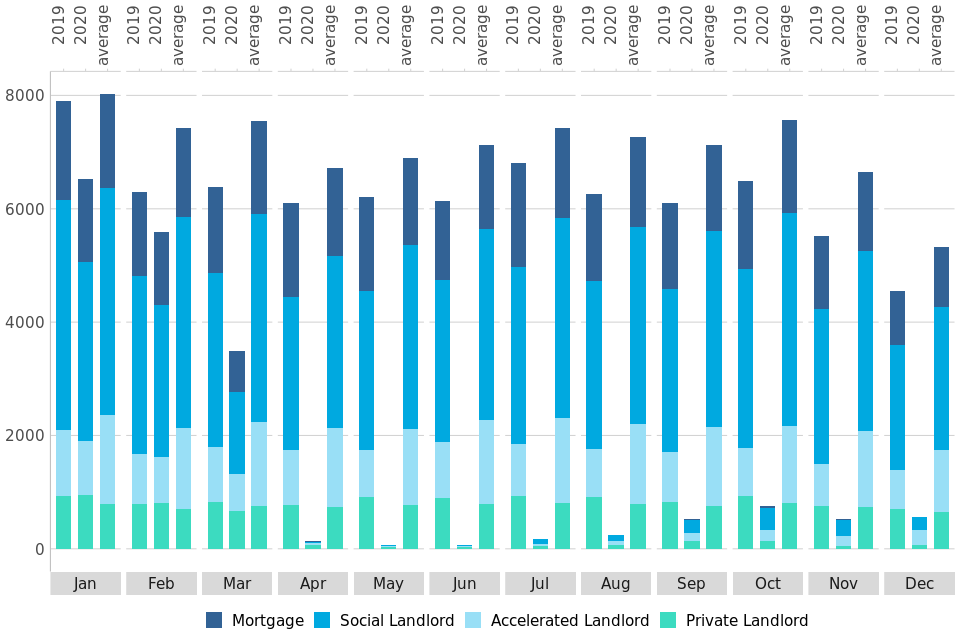
Figure 9: Comparison of all possession claims by month in the county courts of England and Wales (2019, 2020 and the 5-year average)
As can be seen in Figure 9, following the significant decrease in claim volumes in March, by April these figures had fallen to just 1,080 claims, 90% down on April 2019 and down 91% on the 5-year average. There was a steady, gradual increase from May to July (979 in May, 1,125 in June and 1,301 in July), followed by a slight decrease to 1,138 claims in August. The increasing trend then resumed in September, where it rose to 1,626 claims. Following the end of the stay on possession actions in late September, claims rose further in October and November (to 2,898 and 3,077 respectively) before falling slightly in December (to 2,662). Despite this, November is still down 75% compared to the five-year average.
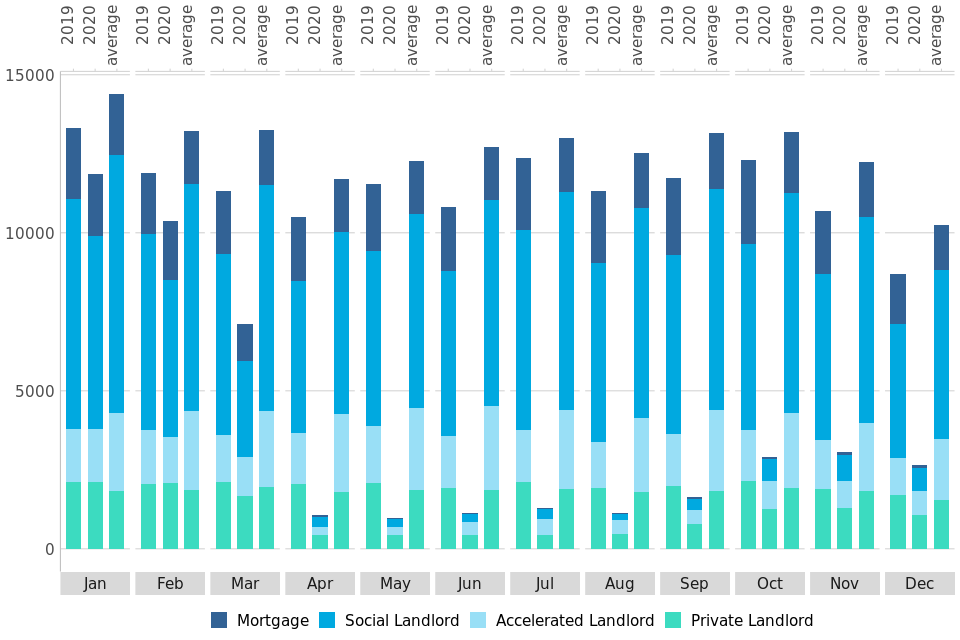
Figure 10: Comparison of monthly claims by possession type in the county courts of England and Wales (2019, 2020 and 5-year average)
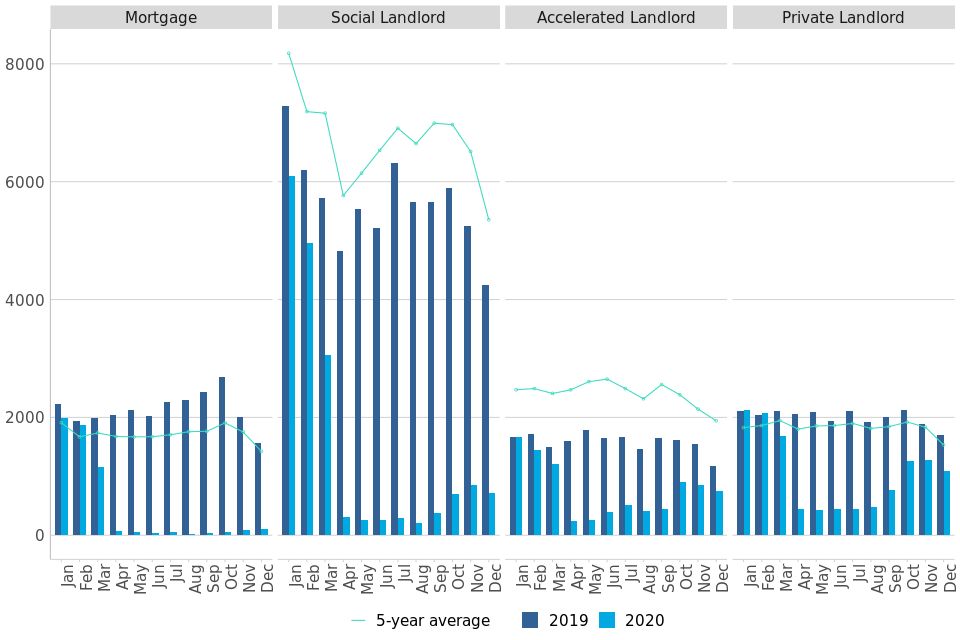
The total number of claims can be further subdivided by claim type, with Figure 10 showing the variation in claim numbers between landlord and mortgage claims.
The most significant decline was in mortgage possession claim numbers, suggesting that overwhelmingly mortgage lenders have complied with the FCA suspension of mortgage possession actions. Following the significant fall in claim numbers in April (79 claims, down 96% on 2019), claim numbers have remained low from May to September, never exceeding 60 claims per month. In this most recent quarter, there was a gradual rise with 49 in October, 96 in November and 110 in December. However, December is still down 93% on 2019.
The number of landlord claims registered by month varies greatly by type.
Social landlord claims follow a similar pattern to mortgage claims, with a significant fall in claim numbers in April (313 claims, down 94% on 2019), and have remained at low levels throughout the period from May to August (no more than 300 claims for each month), and showing a steady rise from August to November (from 215 to 849 claims). Unlike Mortgage claims, Social landlords then saw a decrease in December (to 721).
In contrast, accelerated and private landlord claims both show trends which differ from mortgage and social landlord claims. While both registered a decrease in claims in March 2020 (down 19% and 21% on 2019 respectively), this drop was less pronounced than was observed for social landlord claims. Claims dropped again in April; 245 claims for accelerated landlord (down 85% on 2019) and 443 claims for private landlords (down 78% on 2019). Claims remained steady for private landlords throughout the period from May to August (ranging between 424 and 479) before significantly increasing to 776 in September. In contrast, there was an increase for accelerated landlords from May to July (251 in May, 387 in June and 514 in July). Accelerated landlord claim numbers then dropped in August to 419 and remained at a similar level in September (442 claims).
Like Mortgage and Social Landlords, both Accelerated and Private Landlords saw their biggest increase in October (rising to 898 for Accelerated Landlords and 898 for Private Landlords). Accelerated Landlords then decreased between October and December (down to 748 in December). Despite this, October was still down 44% on 2019. As with Private Landlords, the trend in this most recent quarter mirrored Social Landlords, with a slight increase in November (to 1,283), decreasing again in December (to 1,083). December is still down 37% on 2019.
As a result, accelerated and private landlord claims made up the bulk of all claims from May to December (greater than the 69% of all claims in each month).
Figure 11: Possession claims where reactivation notices have been received[footnote 13], by week-commencing date
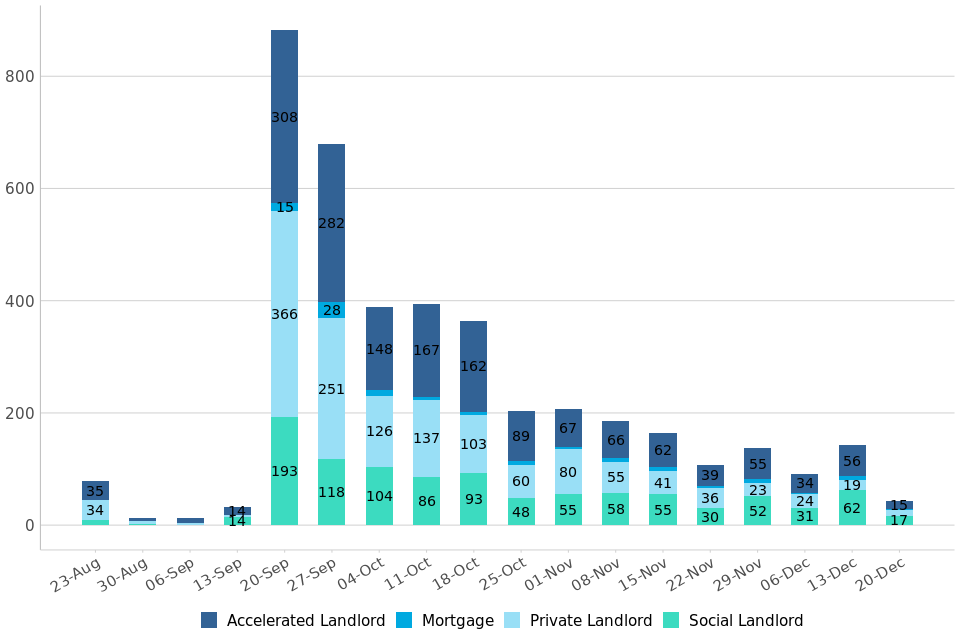
While only minimal increases in the number of new possession claims were recorded following the end of the stay in possession actions on 20 September, receipt of reactivation forms for existing claims has increased significantly since this time. During July-September 2020, 1,521 reactivation claims were received for claims started in 2020.[footnote 14] A further 2,687 reactivation claims were received during the fourth quarter of 2020. While a small number (79) of these reactivations were submitted week commencing 23 August (the first extension date for the stay), the second extension of the possession action stay until 20 September meant that numbers dropped following this date.
The majority of these reactivation requests were therefore not submitted until week commencing 20 September 2020 (882 requests in this week), with numbers falling in the subsequent months (only 43 requests in the week commencing 20 December). As with new claims, Accelerated and Private Landlord claims made up the bulk of reactivated claim applications; 39% and 33% respectively.
Figure 12: Comparison of all possession warrants issued by month in the county courts of England and Wales (2019, 2020 and 5-year average)
As can be seen in Figure 12, following the significant decrease in warrant volumes in March, by April these numbers had fallen to just 133 warrants, down 98% on both April 2019 and the 5-year average. After decreasing further in May to just 71 warrants, the number then started to increase, with a slight increase in June (to 72 warrants), and a more rapid increase from July to October (173 in July, 244 in August, 526 in September and 749 in October). Despite this increasing trend, and the end of the stay on possession actions in late September, October is still down 88% compared to September 2019 and down 93% compared to the five-year average. Warrant numbers then decreased in November (to 526) followed by a slight increase again in December (to 562).
Although this increasing trend is consistent across all landlord types, mortgage warrant volumes remained low from April to August (ranging between 2 and 6 warrants). In September and October, figures showed a slight increase (to 16 warrants in September and 23 in October), but October is down 99% compared to September 2019 and the five-year average. Following this, warrants decreased again in both November and December (to 16 and 6 respectively).
It should be noted that, during the suspension of possession activity, though warrants could still be issued where an individual has applied for one, that individual will be informed that no enforcement action can be undertaken at this time.
Figure 13: Comparison of all bailiff repossessions by month in the county courts of England and Wales (2019, 2020 and 5-year average)
As can be seen in Figure 13, across January and February 2020 the total number of repossessions was down on the same months of 2019 (down 8% and 13% respectively).
With the start of Covid-related actions impacting from the end of March, repossession numbers were down 34% on March 2019 (to 2,197 repossessions). As expected, no repossessions were recorded in Q2 and Q3 due to the stay on repossessions. There were 405 repossessions in October (down 88% on October 2019). Numbers then dropped to lower levels in November and December (to only 121 and 29 respectively).
10. Further information
The statistics in the latest quarter are provisional and revisions may be made when the next edition of this bulletin is published. If revisions are needed in subsequent quarters, these will be annotated in the tables.
10.1 Accompanying files
As well as this bulletin, the following products are published as part of this release:
-
A supporting guide providing further information on how the data is collected and processed, including a guide to the csv files, as well as legislation relevant to mortgage possessions and background information.
-
A set of overview tables, covering key sections of this bulletin.
-
CSV files of the map data and the possession action volumes by local authority and county court.
-
A CSV file of the data included in the Annex.
-
A new data visualisation tool which replaces the Tableau tool to provide a detailed view of the Mortgage and Landlord statistics. We welcome feedback on this tool to help improve it in later editions and to ensure it meets user needs.
10.2 National Statistics status
National Statistics status means that official statistics meet the highest standards of trustworthiness, quality and public value.
All official statistics should comply with all aspects of the Code of Practice for Statistics. They are awarded National Statistics status following an assessment by the Authority’s regulatory arm. The Authority considers whether the statistics meet the highest standards of Code compliance, including the value they add to public decisions and debate.
It is the Ministry of Justice’s responsibility to maintain compliance with the standards expected for National Statistics. If we become concerned about whether these statistics are still meeting the appropriate standards, we will discuss any concerns with the Authority promptly. National Statistics status can be removed at any point when the highest standards are not maintained, and reinstated when the standards are restored.
10.3 Future publications
Our statisticians regularly review the content of publications. Development of new and improved statistical outputs is usually dependent on reallocating existing resources. As part of our continual review and prioritisation, we welcome user feedback on existing outputs including content, breadth, frequency and methodology. Please send any comments you have on this publication including suggestions for further developments or reductions in content.
10.4 Contact
Press enquiries should be directed to the Ministry of Housing, Communities and Local Government press office:
Simon Varcoe - email: Simon.Varcoe@communities.gov.uk
Other enquiries and feedback on these statistics should be directed to the Justice Statistics Analytical Services division of the Ministry of Justice:
Carly Gray - email: CAJS@justice.gov.uk
Next update: 13 May 2021
© Crown Copyright
Produced by the Ministry of Justice
Alternative formats are available upon request from ESD@justice.gov.uk
-
The law requires at least 4 and no more than 8 weeks between claim and court hearing. Possession orders stipulate when a tenant must vacate the property - typically within 4 weeks from the date the order was made. Landlords cannot issue a warrant until after this period (if the tenant has failed to comply). ↩
-
https://www.fca.org.uk/publications/finalised-guidance/finalised-guidance-mortgages-and-coronavirus-updated-guidance-firms ↩
-
Though possession proceedings were suspended by the Civil Procedure Rules - Practice Direction 51Z, amendments have been made to allow exceptions from the stay, such as in Civil Procedure (Amendment No. 2) where claims against trespassers to which rule 55.6 applies, applications for case management directions which are agreed to by all parties and claims for injunctive relief were exempt from the stay. All updates to the Civil Procedure rules and amendments can be found ↩
-
https://www.justice.gov.uk/courts/procedure-rules/civil/rules/part51/practice-direction-51z-stay-of-possession-proceedings,-coronavirus ↩
-
https://www.legislation.gov.uk/uksi/2020/889/article/2/made ↩
-
https://www.fca.org.uk/publications/finalised-guidance/mortgages-and-coronavirus-updated-guidance-firms ↩
-
https://www.fca.org.uk/publications/feedback-statements/fs21-2-approach-repossessions-updated-tailored-support-guidance-firms-feedback-draft-guidance ↩
-
https://www.justice.gov.uk/courts/procedure-rules/civil/rules/practice-direction-55c-coronavirus-temporary-provision-in-relation-to-possession-proceedings ↩ ↩2
-
https://www.judiciary.uk/wp-content/uploads/2020/09/Possession-Proceedings-Overall-Arrangements-Version-1.0-17.09.20.pdf ↩
-
https://www.legislation.gov.uk/uksi/2020/1290/contents/made ↩
-
This data includes only reactivation notices received for possession claims initially made in 2020. ↩ ↩2
-
Duplicate reactivation notices received for the same claim were not counted. ↩ ↩2