Mortgage and landlord possession statistics: July to September 2020
Published 12 November 2020

© Crown copyright 2020
This publication is licensed under the terms of the Open Government Licence v3.0 except where otherwise stated. To view this licence, visit nationalarchives.gov.uk/doc/open-government-licence/version/3 or write to the Information Policy Team, The National Archives, Kew, London TW9 4DU, or email: psi@nationalarchives.gov.uk.
Where we have identified any third party copyright information you will need to obtain permission from the copyright holders concerned.
This publication is available at https://www.gov.uk/government/statistics/mortgage-and-landlord-possession-statistics-july-to-september-2020/mortgage-and-landlord-possession-statistics-july-to-september-2020
1. Main Points
| All possession actions by both landlords and mortgage providers have reduced significantly following Covid-19 impact and associated actions | As a result of FCA announcements and the passing of the Coronavirus Act in March 2020, possession actions of all types have dropped to unprecedentedly low levels. As a result, the data is unlikely to be representative of general trends in possession actions. Caution should therefore be used when interpreting and applying these figures. |
| Mortgage claims, orders, warrants and repossessions have decreased significantly | Compared to the same quarter last year, mortgage possession claims, orders and warrants have decreased by 98%, 99% and almost 100% respectively. No mortgage repossessions by county court bailiffs have been recorded for this quarter. |
| Landlord possession actions have also all decreased significantly | Landlord possession claims, orders and warrants decreased by 86%, 99% and 94% respectively (compared to the same quarter last year). No landlord repossessions by county court bailiffs have been recorded for this quarter. |
| Mortgage and Landlord possession claims and repossession rates have fallen across all regions | Decreases in possession claims have been recorded over all regions. Landlord claims remain concentrated in London (with 8 of the highest 10 claim rates). |
This publication provides mortgage and landlord possession statistics in July to September 2020, compared to the same quarter the previous year. For technical detail, please refer to the accompanying supporting document.
For feedback related to the content of this publication, please let us know at CAJS@justice.gov.uk
2. Statistician’s Comment
This quarter continues the general suppression of actions in line with the Covid-19 measures put in place by central government. Similar to what was seen in the previous quarter, the number of new possession actions remain at unprecedently low levels, with marked decreases in all types of repossession actions for both mortgages and landlords, and a complete cessation of any repossessions until 20 September 2020.
While lenders have generally complied with guidelines to suspend possession actions, we expect an increase in claims as the stay comes to an end. Various measures have been put in place to ensure that HMCTS can manage this incoming workload. The measures include some changes to the Civil Procedure Rules, such as the requirement to file a reactivation notice in older claims and provide the court with information of the impact of the pandemic on a tenant and their household.[footnote 1]
As noted in this release, significant volumes of reactivation notices pertaining to previously stayed possession claims are now being received by the courts. For example, from 20 September, when the complete cessation of repossession actions ended, to the 30 September, 1,513 such reactivations were received - most of the volume (78%) made up of accelerated and private landlords. It is expected that these reactivations will continue to make up a proportion of possession actions as new claim volumes rise.
While these statistics are of interest to the public, it is worth noting that the small volumes of repossession actions mean that the data is unlikely to be representative of general trends in possessions. Caution should therefore be used when interpreting and applying these figures. With regard to future publications, our statistical teams will consider the impact of the pause in repossessions in the timeliness series when we publish the average timeliness estimates.
3. Consultation Response
The MLP statistics team recently held a consultation for users to better understand who uses these statistics, how they use them and what changes might help the team meet user needs better. The consultation was launched on 13th August 2020 and run for 12 weeks. We received 11 responses to the survey of which only 3 indicated they used tables 3b and 6b. Alongside this we ran a campaign in the published tables to alert users these tables would be removed and invited feedback if users found it useful and would like to keep them. No responses were received. As a result, we have removed tables 3b and 6b as these proved the least valuable to users. Although the closing date for this consultation has now passed, user engagement is a continuous process, and users are invited to submit their comments and suggestions to the team at any time, using the contact details in this publication.
4. Overview of Mortgage Possession
Mortgage possession figures have dropped significantly, with claims, orders, warrants and repossessions all dropping by more than 95% in comparison to July-September 2019
As a result of coronavirus and associated actions, all mortgage possession actions have dropped significantly. Compared to the same quarter in the previous year, mortgage possession claims (110), are down 98%. Mortgage orders for possession (25) are down 99% and warrants issued (23) are down almost 100%. No repossessions were recorded in the current quarter.
Figure 1: Mortgage possession actions (actual and seasonally adjusted) in the county courts of England and Wales, July to September 2015 to July to September 2020 (Source: Table 10a)
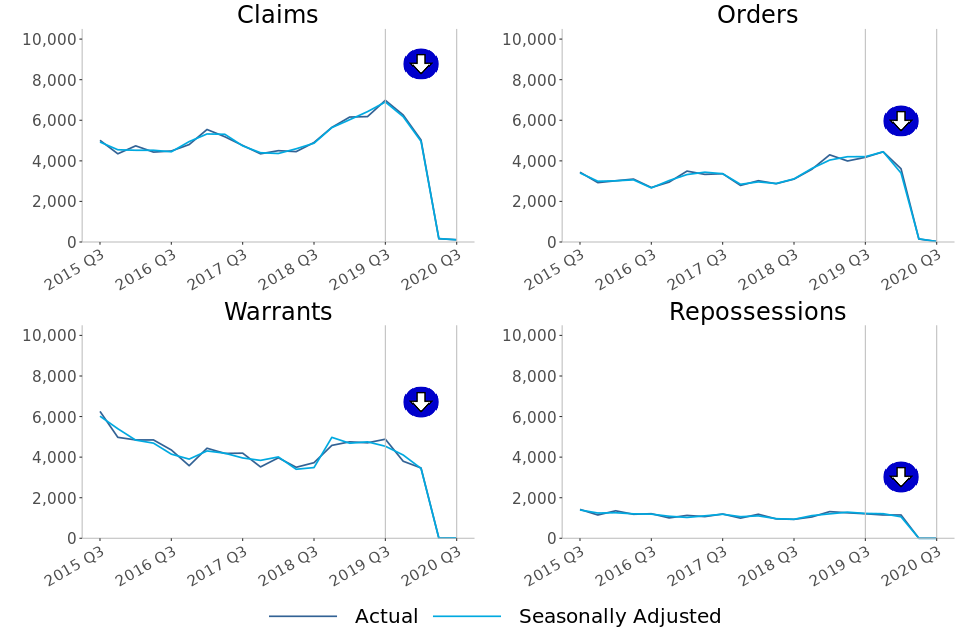
Four line charts of trends in volumes of mortgage claims, orders, warrants and repossessions over the past five years.
Mortgage possession claims fell from a peak of 26,419 in April to June 2009 before stabilising from April to June 2015 (4,849). In the most recent quarter, July to September 2020, there were 110 claims for possession, down 98% from the same quarter in 2019.
Orders and warrants for possession followed a similar trend to mortgage claims, falling from a peak of 23,850 orders in July to September 2009 and 21,350 warrants in January to March 2009, and stabilizing around 2016/17. Compared to the same quarter of the previous year, orders are down 99% to 25 and warrants are down almost 100% to 23 in July to September 2020.
Historically, repossessions by county court bailiffs fell from a high of 9,284 in Q1 of 2009 to 934 in Q3 of 2018, the lowest recorded level of the series at the time. In July to September 2020, there were no recorded repossessions. This is in line with the FCA guidance to firms not to commence or continue repossession proceedings against customers before 31 October 2020.
Before the impact of coronavirus, the historical fall in the number of mortgage possession actions since 2008 has generally coincided with lower interest rates, a proactive approach from lenders in managing consumers in financial difficulties and other interventions, such as the Mortgage Rescue Scheme and the introduction of the Mortgage Pre-Action Protocol. Additionally, the downward trend seen in recent years mirrors that seen in the proportion of owner-occupiers.
5. Mortgage Possession Action Timeliness
Median timeliness figures are volatile for mortgage orders, warrants and repossessions due to low volumes being processed
Median average time has increased for orders and warrants. However due to the low volumes of possession actions this quarter, caution should be used when interpreting these results. It is unlikely that these timeliness figures are representative of any statistical trend and instead reflect the pause in actions.
Over the last two years the median time from claim to repossession has varied between 33 and 54 weeks. No claims to repossession times have been recorded for this or last quarter, so timeliness cannot be calculated.
Figure 2: Average timeliness of mortgage possession actions, July to September 2015 to July to September 2020 (Source: Table 3)
Number of weeks taken from initial mortgage claim to…
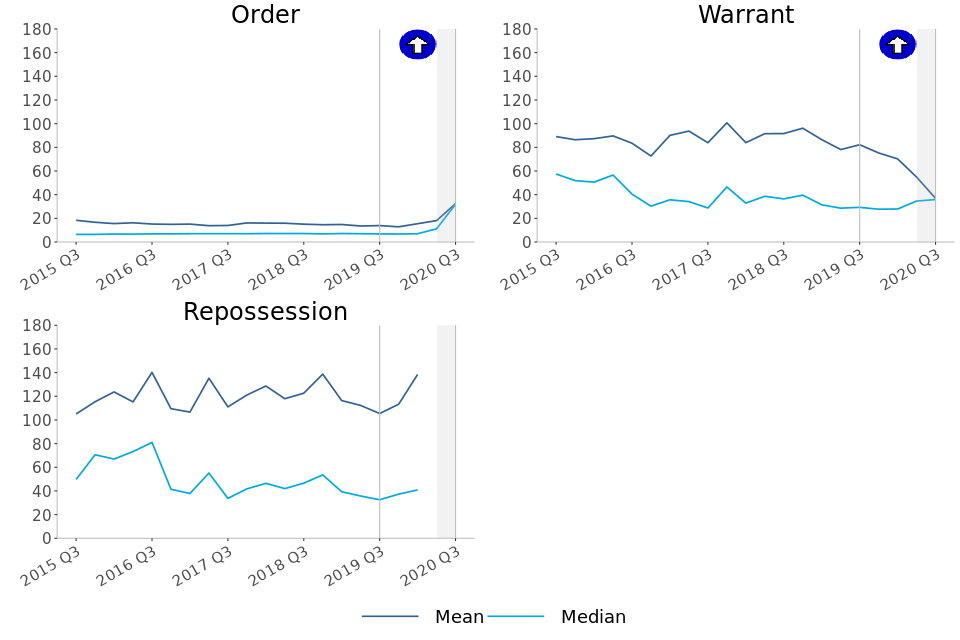
Three line charts of trends in median and mean mortgage possession claim timeliness in weeks, from time of claim to time of order, warrant and repossession.
-
Claims to order median timeliness has increased to 31.9 weeks from 6.9 weeks in the same period in 2019.
-
Claims to warrant median timeliness has increased to 35.9 weeks from 29.3 weeks in the same period in 2019.
-
No claims have been converted to repossessions this quarter.
The above charts distinguish between the timeliness of possession claims at different stages of a case. Average time taken from claim to warrant or repossession can fluctuate and is affected by various factors. For example, the final two charts take account of the amount of time between the court order being issued and the claimant, such as the mortgage lender, applying for a warrant of possession.
The long-term increases in the mean average time from claim to warrant and claim to repossession are due to an increasing proportion of historic claims (dating from 2007 to 2013) reaching the warrant and repossession stages respectively in recent quarters. This is possibly due to defendants recently breaking the terms of the mortgage agreements put in place at the start of the process. Although these historical outlying cases inflate the mean average, they have less effect on the median.
No claims have been converted to repossessions this quarter, so no timeliness estimate can be calculated.
6. Overview of Landlord Possession
The number of landlord possession actions for all court stages have also decreased significantly, down at least 86% in comparison to the same quarter of last year
As a result of coronavirus and associated actions, all landlord possession actions have dropped significantly. Compared to the same quarter the previous year, landlord possession actions; claims (3,954), orders for possession (131) and warrants (911) have decreased by 86%, 99%, and 94% respectively. No repossessions have been recorded this quarter.
Figure 3: Landlord possession actions (actual and seasonally adjusted) in the county courts of England and Wales, July to September 2015 to July to September 2020 (Source: Table 10b)
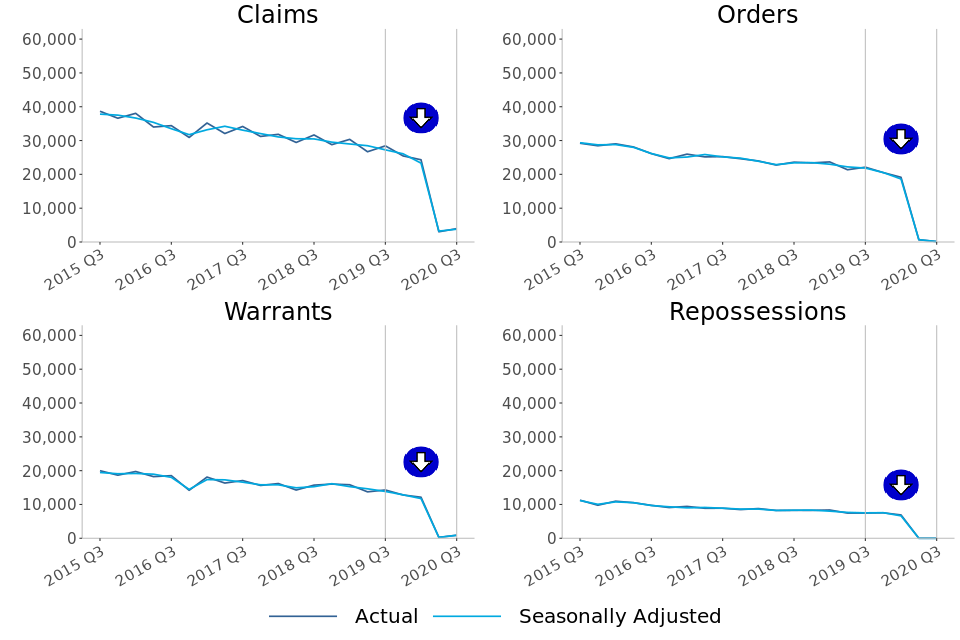
Four line charts of trends in landlord claims, orders, warrants and repossessions over the past five years.
In July to September 2020, a minority (22% or 887) of all landlord possession claims were social landlord claims, and 34% (1,354) were accelerated claims. The group making up the largest proportion of landlord claims (43% or 1,713) were private landlord claims.
This is in contrast to previous quarters, for example in July to September 2019, the majority (62% or 17,629) of all landlord possession claims were social landlord claims, and accelerated claims and private landlord claims made up just 17% and 21% of all landlord claims respectively.
The fall in claim and orders volumes is observed across all geographical regions. As in previous quarters, a concentration of claims was seen in London, with 1,259 landlord claims and 35 landlord orders at London courts in July to September 2020, accounting for 32% and 27% of all landlord possession claims and orders respectively. Despite this, in London there was still a decrease of 81% (from 6,638) for landlord claims and a decrease of 99% for landlord orders (from 4,724 in July to September 2019).
The 94% decrease in landlord warrants in July to September 2020 when compared to July to September 2019, was again accompanied by large decreases across all regions. The largest regional number of warrants (246) was again found in London, with this making up 27% of all landlord warrants. Despite this, there was a decrease of 93% for landlord warrants in London (from 3,542 in July to September 2019 to 246 in July to September 2020).
7. Landlord Possession Timeliness[footnote 2]
Median timeliness figures are volatile for landlord orders, warrants and repossessions due to low volumes being processed
Median and mean average time has increased for orders and warrants. However due to the low volumes of possession actions this quarter, caution should be used when interpreting these results. It is unlikely that these timeliness figures are representative of any statistical trend in timeliness and will instead reflect the pause in actions.
There have been no claims to repossession times recorded this quarter, but timeliness for landlord possession actions has remained stable across the previous five years.
Figure 4: Mean and median average timeliness of landlord possession actions, July to September 2015 to July to September 2020 (Source: Table 6)
Number of weeks taken from initial landlord claim to…
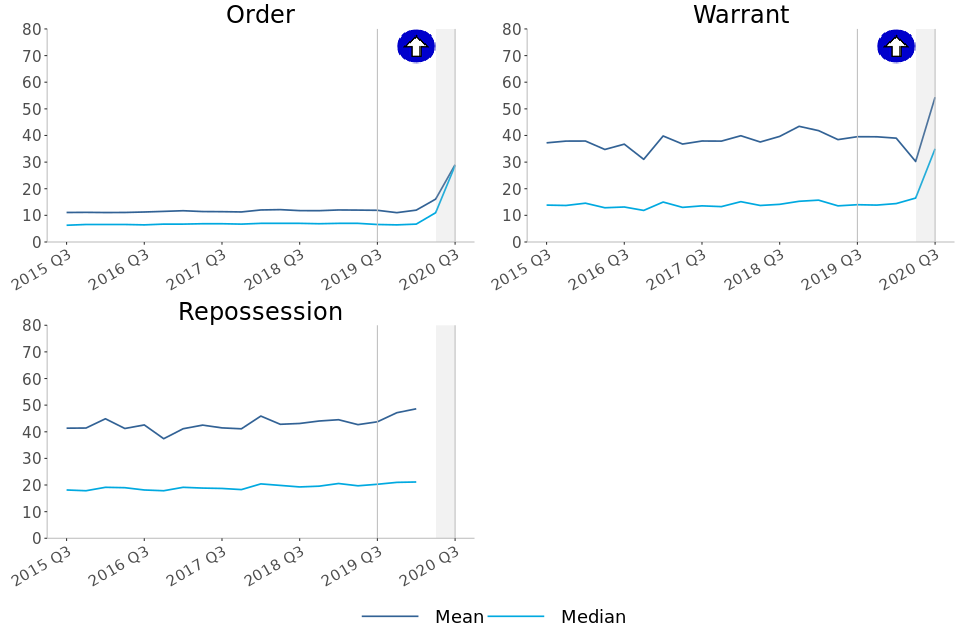
Three line charts of trends in median and mean landlord possession claim timeliness in weeks, from time of claim to time of order, warrant and repossession.
-
Claims to order median timeliness has increased to 28.7 weeks from 6.6 weeks in the same period in 2019.
-
Claims to warrant median timeliness has increased to 35.0 weeks from 14.0 weeks in the same period in 2019.
-
No claims to repossessions were recorded this quarter.
As shown by Figure 4, median figures are generally considerably lower than mean figures, demonstrating that on average, the progression from claim to successive stages can be positively skewed by outlying cases when using a mean measure of average timeliness.
8. Regional Possession Claims
Bolton in the North West region had the highest rate of mortgage possession claims at 7.5 per 100,000 households, followed by South Hams (South West region) and Eden (North West region); with 5 and 4.1 claims per 100,000 respectively. Note that these rates are based on small numbers of possessions only.
The majority of the highest landlord possession claim rates were found in London, with 8 of the 10 highest rates occurring in the London region. However, Wolverhampton had the highest rate (86 per 100,000 households).
Figure 5: Mortgage possession Claims per 100,000 households, July to September 2020 (Source: map.csv; see supporting guide)
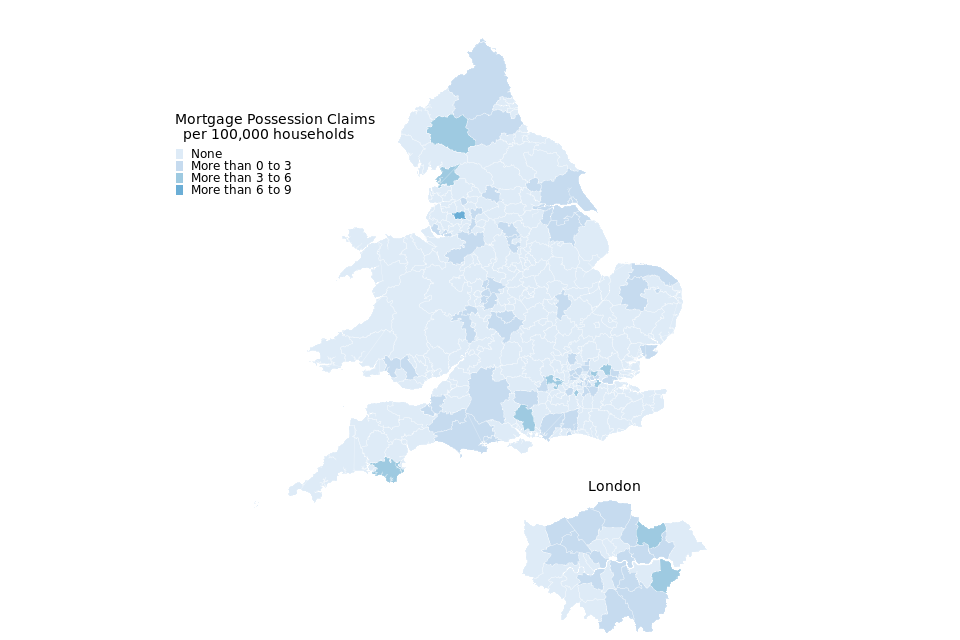
Map of mortgage claims per 100,000 households in English and Welsh regions, with number of claims indicated by colour.
| Local Authority | Rate (per 100,000 households) | Actual number |
|---|---|---|
| Bolton | 7.5 | 9 |
| South Hams | 5.0 | 2 |
| Eden | 4.1 | 1 |
265 local authorities had no possession claims during this period. Excluding these, Birmingham had the lowest rate of mortgage claims (0.2 per 100,000 households).
Figure 6: Landlord possession Claims per 100,000 households, July to September 2020 (Source: map.csv; see supporting guide)
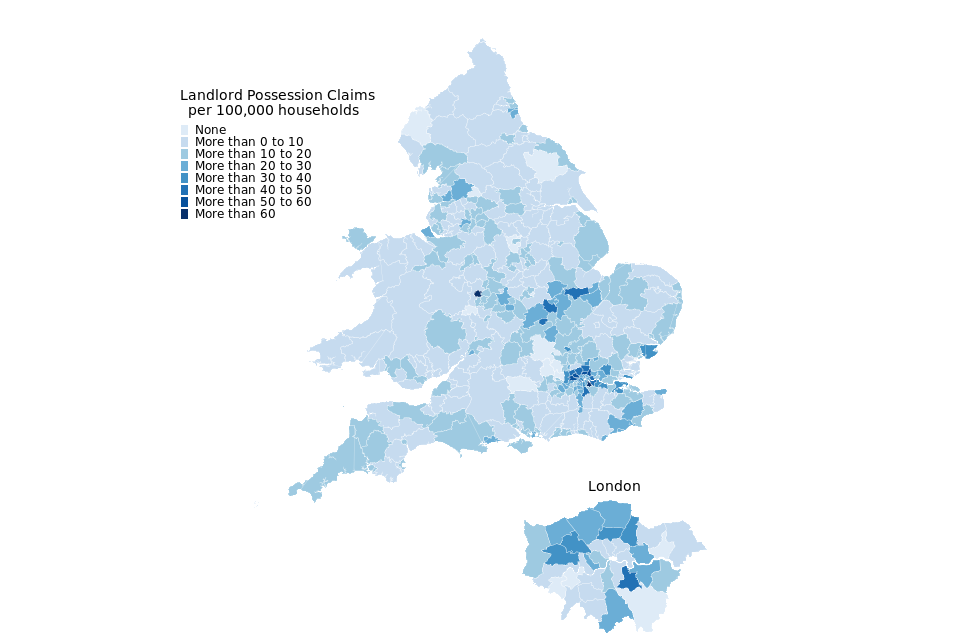
Map of landlord claims per 100,000 households in English and Welsh regions, with number of claims indicated by colour.
| Local Authority | Rate (per 100,000 households) | Actual number |
|---|---|---|
| Wolverhampton | 86 | 92 |
| Lewisham | 72 | 93 |
| Ealing | 56 | 69 |
London boroughs account for 8 of the 10 local authorities with the highest rate of landlord claims.
13 local authorities had no landlord claims during this period. Excluding this, Flintshire had the lowest rate of landlord claims (1.5 per 100,000 households).
9. Regional Repossessions (by County Court Bailiffs)
There were no bailiff repossessions for either mortgages or landlord case types during July to September 2020, similar to the previous quarter.
10. Annex: Impact of changes in possession process related to Coronavirus
On 17 March 2020, the Chancellor announced additional support aimed at limiting short-term hardships faced by home owners and renters. This was followed by the passing of the Coronavirus Act by royal assent on 25 March 2020, which extended the notice period to three months for some tenancies in the private and social sectors. Notice periods on the majority of tenancies have subsequently been extended to six months.[footnote 3]
Furthermore, the Master of the Rolls, with the agreement of the Lord Chancellor, suspended all ongoing housing possession cases[footnote 4] for 90 days from 27 March 2020.[footnote 5] The original legislation was subsequently extended by a further two months to 23 August 2020[footnote 6] and then an additional month, lifting the stay on 21 September 2020.[footnote 7] Despite this, no repossessions can occur before 5 October 2020, as Bailiffs must give a minimum of two weeks notice for eviction.
In addition to this, any possession claims made before 3 August 2020 with no possession order made prior to 27 March 2020 need to be reactivated after the end of the stay. These claims can only be reactivated by the claimant or defendant completing a reactivation notice and sending it to the court.[footnote 8]
These actions have had an impact on possessions data from March 2020 throughout the second and third quarters of 2020 and this annex provides a monthly breakdown of this data.[footnote 9]
Covid-19 had several related actions which have all had a significant impact on mortgage and landlord possession actions. These have included The Financial Conduct Authority (FCA) announcement on the 20th March 2020[footnote 10] that they expected all lenders to cease any mortgage repossession action, and the passing of the Coronavirus Act by royal assent on 25 March 2020.[footnote 11] Under FCA guidance, mortgage lenders currently can’t carry out repossessions until after 31 January 2021.[footnote 12]
Whilst these measures have impacted all of 2020 to date, the effect on Q1 was not consistent throughout the quarter, with the most significant impact observed during the final days of March. Further, though the impact was generally as expected throughout the second and third quarter, there remains significant public interest in the monthly breakdown of these possession actions. This annex aims to more clearly demonstrate the impact of COVID-19-related action on two stages of the possession process. The initial claim stage and warrant issue stage have been chosen as they are considered to be representative of the early and late stages of a typical possession action.
Alongside the figures for 2019 and 2020, we have presented a 5-year average which can be considered a baseline.
Figure 7: Comparison of all possession claims by month in the county courts of England and Wales (January to September for 2019, 2020 and the 5-year average)
Bar chart of number of possession claims by month for January to September in 2019, 2020, and a five year average.
As can be seen in Figure 7, following the significant decrease in claim volumes in March, by April these figures had fallen to just 1,080 claims, 90% down on April 2019 and down 91% on the 5-year average. These figures showed a steady, gradual increase from May to July (979 in May, 1,125 in June and 1,302 in July), followed by a slight decrease to 1,138 claims in August. The increasing trend then resumed in September, up to 1,624 claims. Despite this overall increasing trend, and the end of the stay on possession actions, September is still down 88% compared to the five-year average.
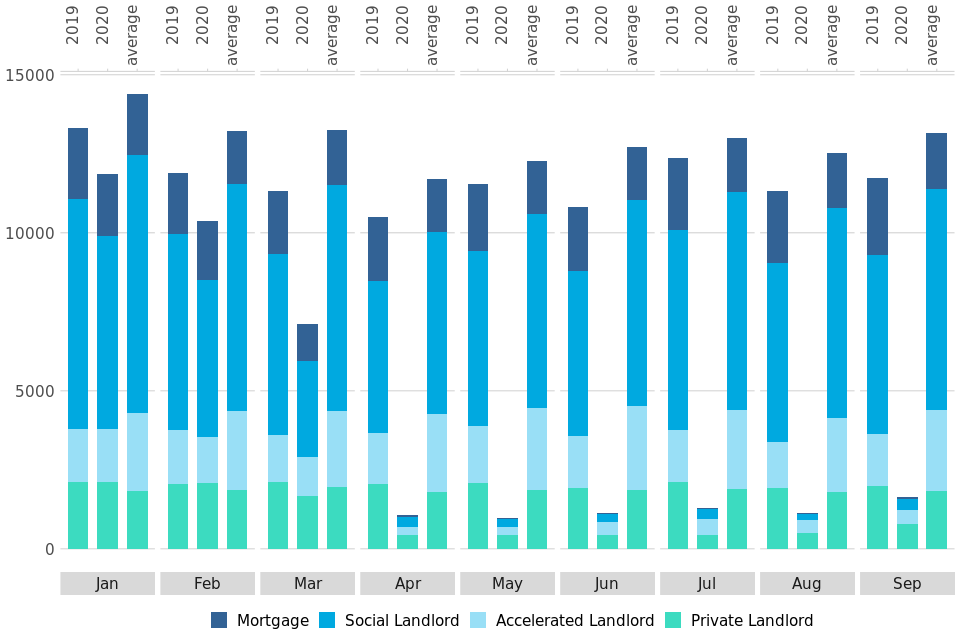
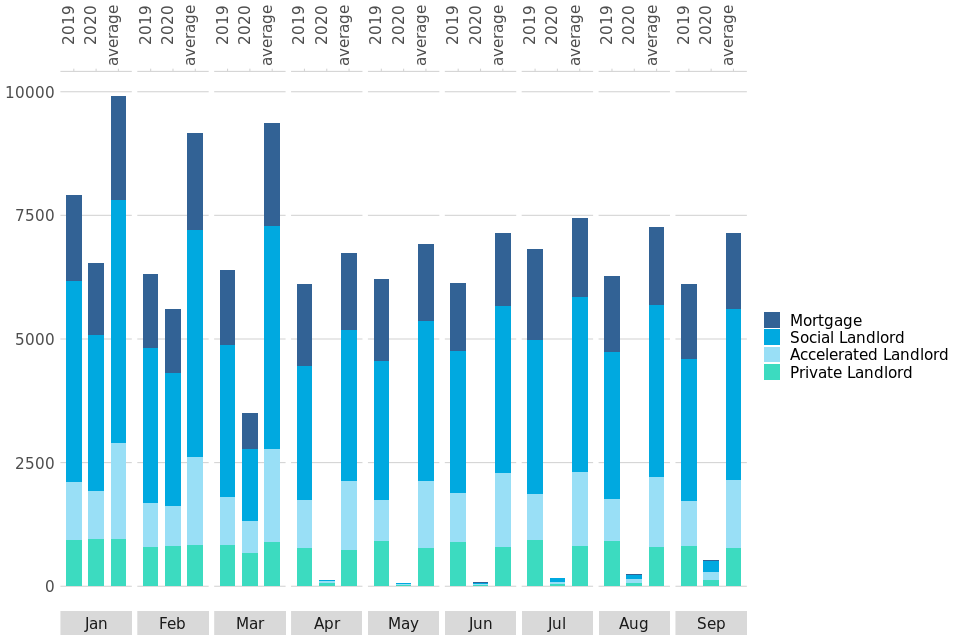
Figure 8: Comparison of monthly claims by possession type in the county courts of England and Wales (January to September 2019, 2020 and 5-year average)
Bar and line chart showing number of possession claims by month, split by possession type (mortgage, social landlord, private landlord, accelerated landlord)
The total number of claims can be further subdivided by claim type, with Figure 8 showing the variation in claim numbers between landlord and mortgage claims.
Mortgage figures saw the most significant decline in claim numbers, suggesting that overwhelmingly mortgage lenders have complied with the FCA suspension of mortgage possession actions. Following the significant fall in claim numbers in April (79 claims, down 96% on 2019), claim numbers have remained low from May to September, never exceeding 60 claims per month.
The number of landlord claims registered by month varies greatly by type.
Social landlord claims follow a similar pattern to mortgage claims, with a significant fall in claim numbers in April (313 claims, down 94% on 2019), and have remained at low levels throughout the period from May to August (no more than 300 claims for each month), and showing only a small rise in September (to 374 claims).
In contrast, accelerated and private landlord claims both show trends which differ from mortgage and social landlord claims. While both registered a decrease in claims in March 2020 (down 19% and 21% on 2019 respectively), this drop was less pronounced than observed for social landlords. Claims dropped again in April; 245 claims for accelerated landlord (down 85% on 2019) and 443 claims for private landlords (down 78% on 2019). Claims remained steady for private landlords throughout the period from May to August (ranging from 424 to 490) before showing a significant increase to 779 in September (61% down on September 2019). In contrast, there was an increase for accelerated landlords from May to July (251 in May, 387 in June and 509 in July), although this was still down 69% on July 2019. Accelerated landlord claim numbers then dropped in August to 408 and remained at a similar level for September (437 claims).
As a result, accelerated and private landlord claims made up the bulk of all claims from May to September (greater than the 69% of all claims in each month).
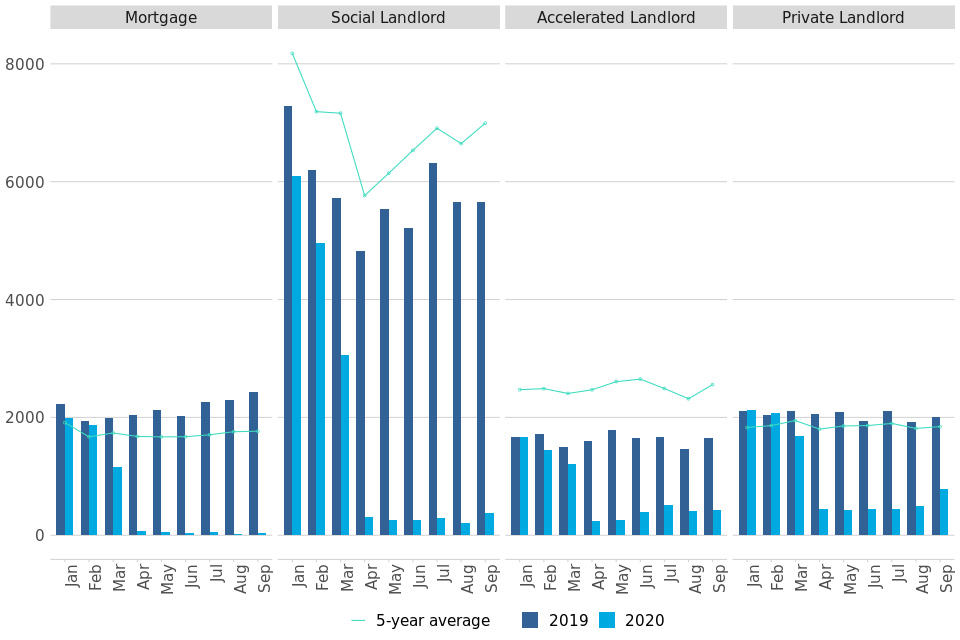
Figure 9: Possession claims where reactivation notices have been received[footnote 13], by week-commencing date
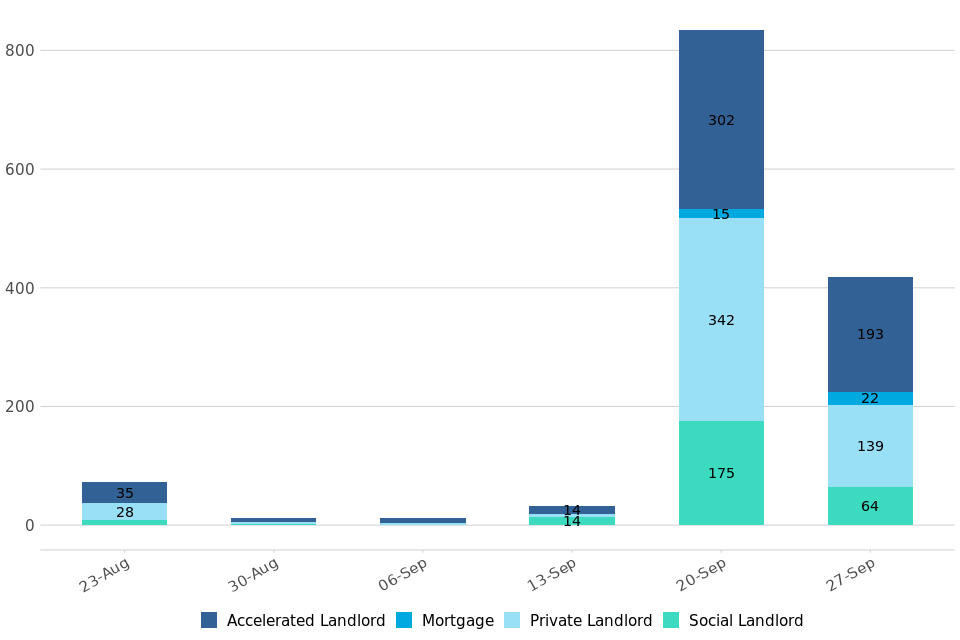
Bar chart showing number of claims for which reactivation requests have been received from week commencing 23 August to 27 September, split by possession type (mortgage, social landlord, private landlord, accelerated landlord).
While only minimal increases in the number of new possession claims were recorded following the end of the stay in possession actions on 20 September, receipt of reactivation forms for existing claims has increased significantly since this time. During July-September 2020, 1,380 reactivation claims were received for claims started in 2020[footnote 14]. While a small number (72) of these reactivations were submitted week commencing 23 August (the first extension date for the stay), the second extension of the possession action stay until 20 September meant that numbers dropped following this date.
The majority of these reactivation requests were therefore not submitted until week commencing 20 September 2020. In September, 1513 reactivation requests were received. As with new claims, accelerated landlord and private landlord claims made up the bulk of reactivated claim applications; 40% and 38% respectively.
Out of all reactivation applications for claims made in 2020, 34% were from claims that were made this quarter (474).
Figure 10: Comparison of all possession warrants issued by month in the county courts of England and Wales (January to September 2019, 2020 and 5-year average)
Bar chart of number of warrants issued by month for January to September in 2019, 2020, and a five year average.
As can be seen in Figure 10, following the significant decrease in warrant volumes in March, by April these numbers had fallen to just 136 warrants, down 98% on both April 2019 and the 5-year average. After decreasing further in May to just 72 warrants, figures then started to increase, with a slight increase in June (to 76 warrants), and a more rapid increase from July to September (174 in July, 242 in August and 521 in September). Despite this increasing trend, and the end of the stay on possession actions, September is still down 91% compared to September 2019 and down 93% compared to the five year average.
Although this increasing trend is consistent across all landlord types, mortgage warrant volumes remained low from April to August (ranging from between 2 and 5 warrants). In September, figures showed a slight increase (to 16 warrants), but this is down 99% compared to September 2019 and the five-year average.
It should be noted that, during the suspension of possession activity, though warrants could still be issued where an individual has applied for one, that individual will be informed that no enforcement action can be undertaken at this time.
11. Further information
The statistics in the latest quarter are provisional and revisions may be made when the next edition of this bulletin is published. If revisions are needed in subsequent quarters, these will be annotated in the tables.
11.1 Accompanying files
As well as this bulletin, the following products are published as part of this release:
-
A supporting guide providing further information on how the data is collected and processed, including a guide to the csv files, as well as legislation relevant to mortgage possessions and background information.
-
A set of overview tables, covering key sections of this bulletin.
-
CSV files of the map data and the possession action volumes by local authority and county court.
-
A CSV file of the data included in the Annex.
-
The effect of the COVID-19 pandemic on our capacity means we have not updated the data visualisation tool this quarter. The tool containing data to Q4 2019 is still available https://public.tableau.com/profile/moj.analysis.
11.2 National Statistics status
National Statistics status means that official statistics meet the highest standards of trustworthiness, quality and public value.
All official statistics should comply with all aspects of the Code of Practice for Statistics. They are awarded National Statistics status following an assessment by the Authority’s regulatory arm. The Authority considers whether the statistics meet the highest standards of Code compliance, including the value they add to public decisions and debate.
It is the Ministry of Justice’s responsibility to maintain compliance with the standards expected for National Statistics. If we become concerned about whether these statistics are still meeting the appropriate standards, we will discuss any concerns with the Authority promptly. National Statistics status can be removed at any point when the highest standards are not maintained, and reinstated when the standards are restored.
11.3 Future publications
Our statisticians regularly review the content of publications. Development of new and improved statistical outputs is usually dependent on reallocating existing resources. As part of our continual review and prioritisation, we welcome user feedback on existing outputs including content, breadth, frequency and methodology. Please send any comments you have on this publication including suggestions for further developments or reductions in content.
11.4 Contact
Press enquiries should be directed to the Ministry of Housing, Communities and Local Government press office:
Simon Varcoe - email: Simon.Varcoe@communities.gov.uk
Other enquiries and feedback on these statistics should be directed to the Justice Statistics Analytical Services division of the Ministry of Justice:
Carly Gray - email: CAJS@justice.gov.uk
Next update: 11 February 2021
© Crown Copyright
Produced by the Ministry of Justice
Alternative formats are available upon request from ESD@justice.gov.uk
-
The Overall Arrangements provides full detail on the measures that are in place, can be found here ↩
-
The law requires at least 4 and no more than 8 weeks between claim and court hearing. Possession orders stipulate when a tenant must vacate the property - typically within 4 weeks from the date the order was made. Landlords cannot issue a warrant until after this period (if the tenant has failed to comply). ↩
-
Government has changed the law so most renters have a 6 month notice period ↩
-
Though possession proceedings were suspended by the Civil Procedure Rules - Practice Direction 51Z, amendments have been made to allow exceptions for the stay, such as in Civil Procedure (Amendment No. 2) where claims against trespassers to which rule 55.6 applies, applications for case management directions which are agreed to by all parties and claims for injunctive relief were exempt from the stay. All updates to the Civil Procedure rules and amendments can be found here. ↩
-
Civil Procedure (Amendment No. 2) (Coronavirus) Rules 2020 ↩
-
Civil Procedure (Amendment No. 5) (Coronavirus) Rules 2020 ↩
-
The underlying data used for this section is available in CSV format accompanying this publication. ↩
-
https://www.fca.org.uk/news/press-releases/new-guidance-mortgage-providers-lenders-coronavirus ↩
-
Coronavirus Act 2020: An Act to make provision in connection with coronavirus; and for connected purposes. ↩
-
FCA announces further proposals to support mortgage borrowers impacted by coronavirus ↩
-
This data includes only reactivation notices received for possession claims initially made in 2020. ↩
-
Duplicate reactivation notices received for the same claim were not counted. ↩