Mortgage and landlord possession statistics: January to March 2023
Published 18 May 2023

© Crown copyright 2023
This publication is licensed under the terms of the Open Government Licence v3.0 except where otherwise stated. To view this licence, visit nationalarchives.gov.uk/doc/open-government-licence/version/3 or write to the Information Policy Team, The National Archives, Kew, London TW9 4DU, or email: psi@nationalarchives.gov.uk.
Where we have identified any third party copyright information you will need to obtain permission from the copyright holders concerned.
This publication is available at https://www.gov.uk/government/statistics/mortgage-and-landlord-possession-statistics-january-to-march-2023/mortgage-and-landlord-possession-statistics-january-to-march-2023
1. Main Points
This publication provides mortgage and landlord possession statistics up to January to March 2023. In general, we have compared figures to the same quarter in the previous year. Should users wish to compare the latest outturn against 2019 as a pre-covid baseline, or to a period during the covid pandemic, they can do so using the accompanying statistical tables. For technical detail, please refer to the accompanying supporting document.
| Mortgage claims, orders, warrants and repossessions have increased significantly when compared to the same quarter in 2022. | Compared to the same quarter in 2022, mortgage possession claims increased from 2,889 to 4,035 (40%), orders from 2,288 to 2,540 (11%), warrants from 2,184 to 2,624 (20%) and repossessions by county court bailiffs increased from 579 to 718 (24%). |
| Landlord possession actions have all increased significantly. | The pattern is repeated for landlord possession actions. When compared to the same quarter in 2022, landlord possession claims increased from 19,031 to 23,395 (23%), orders from 12,966 to 17,660 (36%), warrants from 6,874 to 10,469 (52%) and repossessions from 3,809 to 6,421 (69%). |
| Mortgage and Landlord possession claims rates have risen across all regions. | Increases in possession claims have been recorded in all regions. Private and social landlord claims remained concentrated in London (with 5 and 2 of the highest 10 claim rates respectively). |
| Mortgage median average time (from claim to repossession) has decreased. | The median average time from claim to mortgage repossession has decreased to 60.2 weeks, down from 110.2 weeks in the same period in 2022. |
| Median timeliness for landlord repossessions has decreased when compared to 2022. | The median average time from claim to landlord repossession has decreased to 22.3 weeks, down from 27.3 weeks in the same period in 2022. |
A data visualisation tool has also been published that provides further breakdowns in a web-based application. The tool can be found here.
For feedback related to the content of this publication and visualisation tool, please contact us at CAJS@justice.gov.uk
2. Statistician’s Comment
Mortgage and landlord possession volumes across all activities continue to increase this quarter. In general, volumes have risen steadily since restrictions ended although they remain below pre-covid levels.
Mortgage and landlord possession claims now sit around 66% and 77% (respectively) of their pre-covid baselines, mainly driven by private and accelerated possession claims. Social landlord claims are still significantly suppressed possibly due to their secure tenancies which gives greater protection from eviction and enhanced rights compared to those renting privately.
Within the landlord possession actions, the Accelerated procedures have particularly risen across all action types. In Wales the Accelerated procedure for claims, orders and warrants increased by 236%, 249% and 275% respectively when compared to the same quarter in 2022. In comparison Accelerated procedure for claims, orders and warrants in England increased by 16%, 46% and 95%. This large increase in Wales could be the effect of landlords exiting the sector due to the Renting Homes (Wales) Act that came into effect on 1st December 2022 with more changes set to come in from June 2023.
Despite the increase in volumes, the civil court is managing demand. This is evident in the decrease in timeliness across all mortgage and landlord stages to pre-covid levels. Median average time for mortgage claim to repossession has decreased to 60.2 weeks from 110.2 weeks in the same period in 2022. Similarly, median average time for landlord claim to repossession has decreased to 22.3 weeks from 27.3 weeks in that period.
3. Overview of Mortgage Possession
Mortgage possession actions: claims, orders and warrants are all currently above the previous year’s levels.
Compared to the same quarter in 2022, mortgage possession claims (4,035) are up 40%. Mortgage orders for possession (2,540) are up 11%, warrants issued (2,624) are up 20% and repossessions (718) are up 24%.
Figure 1: Mortgage possession actions in the county courts of England and Wales, January to March 2018 to January to March 2023 (Source: Table 1)
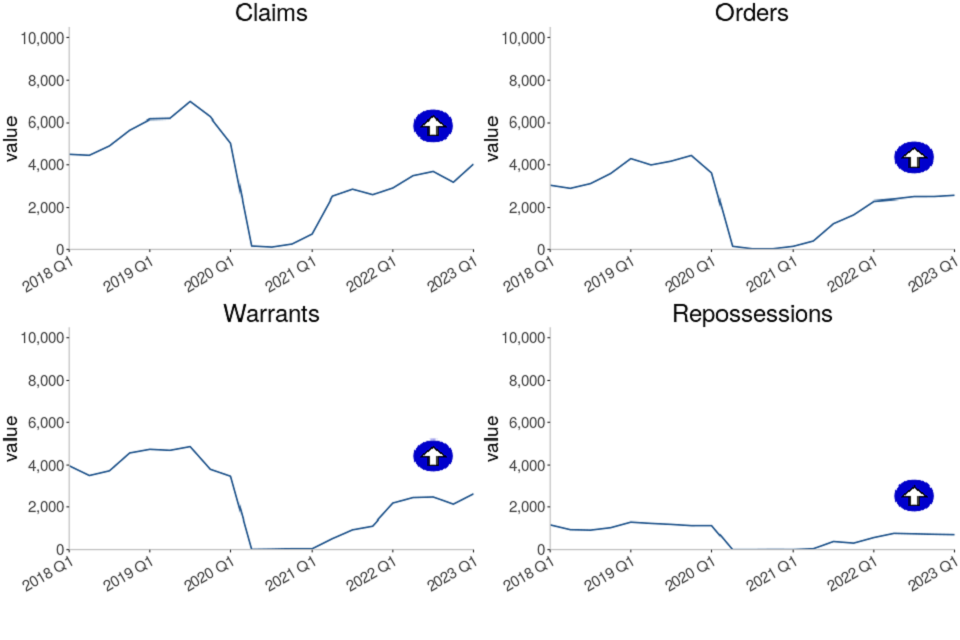
All Mortgage possession case types have been steadily increasing since Q2 2021 (apart from a small dip in Q4 2021 and Q4 2022). Claims, warrants and repossessions volumes are now at 34%, 45% and 45% below their pre-covid baseline. This is a significant increase when compared to the same quarters 2020 to 2022. However it is still short of the pre-covid 2019 baseline.
Mortgage possession claims fell from a peak of 26,419 in April to June 2009 (in the aftermath of the 2008 financial crash) before stabilising from April to June 2015 (4,849, see table 1). In the most recent quarter, January to March 2023, there were 4,035 claims for possession, up 40% from the same quarter in 2022.
Orders and warrants for possession followed a similar trend to mortgage claims, falling from a peak of 23,850 orders in July to September 2009 and 21,350 warrants in January to March 2009, and stabilizing around 2016/17. Compared to the same quarter in 2022, orders are up 11% to 2,540 and warrants are up 20% to 2,624 in January to March 2023.
Historically, repossessions by county court bailiffs fell from a high of 9,284 in Q1 of 2009 to 934 in Q3 of 2018, the lowest recorded level of the series at the time. Following the complete cessation of repossession proceedings from March to September 2020 where no repossessions took place, the FCA guidance advised mortgage lenders not to commence or continue possession proceedings until April 2021 (unless there were special circumstances). As a result, there were only 10 repossessions from April 2020 to March 2021 (Q2 2020 to Q1 2021), this has now risen to 718 in January to March 2023.
Before the impact of coronavirus, the historical fall in the number of mortgage possession actions since 2008 has generally coincided with lower interest rates, a proactive approach from lenders in managing consumers in financial difficulties and other interventions, such as the Mortgage Rescue Scheme and the introduction of the Mortgage Pre-Action Protocol. The trend seen in recent years mirrors that seen in the proportion of owner-occupiers.
4. Mortgage Possession Action Timeliness
Median timeliness figures have decreased for all actions; claim to orders, claim to warrant and claim to repossession.
The median average time from claim to repossession has decreased to 60.2 weeks, down from 110.2 weeks in the same period in 2022.
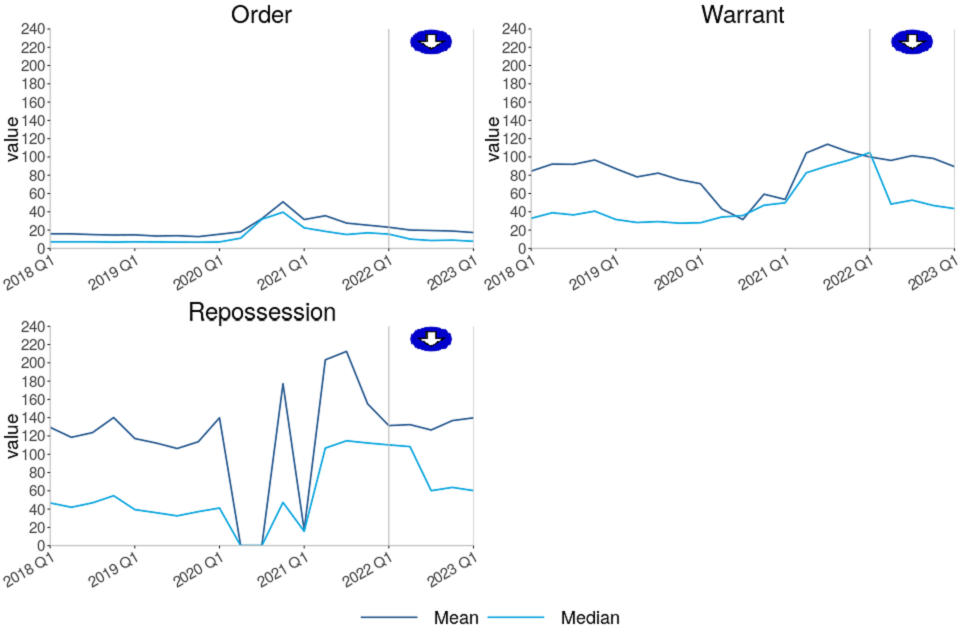
Figure 2: Average timeliness of mortgage possession actions, January to March 2018 to January to March 2023 (Source: Table 3)
Number of weeks taken from initial mortgage claim to…
-
Claims to order median timeliness has decreased to 7.7 weeks, down from 15.6 weeks in the same period in 2022.
-
Claims to warrant median timeliness has decreased to 43.5 weeks, down from 104.8 weeks in the same period in 2022.
-
Claims to repossession median timeliness has decreased to 60.2 weeks, down from 110.2 weeks in the same period in 2022.
The above charts distinguish between the timeliness of possession claims at different stages of a case. Average time taken from claim to warrant or repossession can fluctuate and is affected by various factors. For example, the final two charts take account of the amount of time between the court order being issued and the claimant, such as the mortgage lender, applying for a warrant of possession.
The long-term increases in the mean average time from claim to warrant and claim to repossession are due to an increasing proportion of historic claims reaching the warrant and repossession stages respectively in recent quarters. This is possibly due to defendants recently breaking the terms of the mortgage agreements put in place at the start of the process. Although these historical outlying cases inflate the mean average, they have less effect on the median.
5. Overview of Landlord Possession
The number of landlord possession actions for all court stages have increased compared to the same quarter of last year.
Compared to the same quarter in 2022, landlord possession actions; claims (23,395), orders for possession (17,660), warrants (10,469) and repossessions (6,421) have increased by 23%, 36%, 52% and 69% respectively.
Figure 3: Landlord possession actions in the county courts of England and Wales, January to March 2018 to January to March 2023 (Source: Table 4)
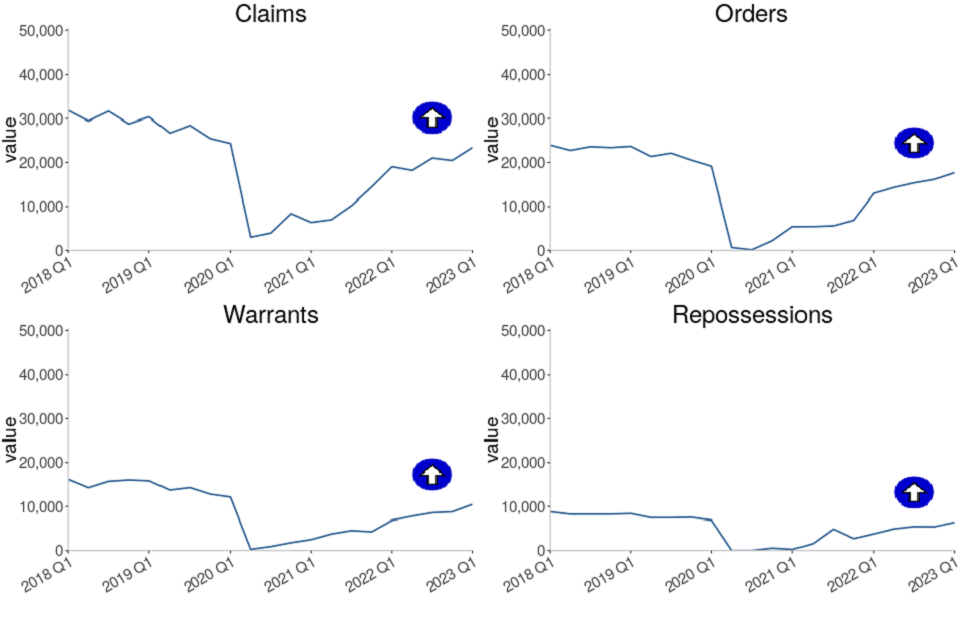
Landlord possession actions have been increasing since Q2 2021. Claims, orders and warrants volumes increased by 23%, 36% and 52% respectively while landlord repossessions in the county courts rose by 69% when compared to the same quarter in 2022.
Within the landlord possession actions, the Accelerated procedures have particularly risen across all the action types, claims, orders and warrants. In Wales the Accelerated procedure for claims, orders and warrants increased by 236%, 249% and 275% respectively. In comparison in England, the Accelerated procedure for claims, orders and warrants increased by 16%, 46% and 95%. This large relative increase in Wales has coincided with the introduction to the Renting Homes (Wales) Act that was introduced on 1st December 2022.
Some of the main changes introduced in the Renting Homes Act include:
-
All landlords being required to provide a written copy of the occupation contract to the tenant (this sets out the rights and responsibilities of both parties).
-
‘No-fault’ notice periods increasing from two months to six months for new tenants, and for existing tenants from Thursday, June 1. It will no longer be possible to issue a notice in the first six months, meaning all contract-holders will have a minimum 12 months of security at the start of their tenancy.
-
A strengthened duty on landlords, to ensure the property they rent is fit for human habitation including the installation of smoke and carbon monoxide alarms, and regular electrical safety testing.
-
Addressing the practice of ‘retaliatory eviction’ (whereby a landlord serves notice on a tenant because they ask for repairs or complain about poor conditions).
-
The introduction of a consistent approach across sectors to eviction where antisocial behaviour and domestic violence occurs.
The changes in regulations and rising interest rates with the corresponding increases in mortgages would have contributed to uncertainty for landlords in the short term and has very likely led to some landlords selling their properties and exiting the rental market.
In January to March 2023, 37% or 8,715 of all landlord possession claims were social landlord claims compared to private landlord claims (31% or 7,269). 32% (7,411) were accelerated claims. This contrasts with pre-covid proportions when a majority of claims (around 60%) were social landlord claims.
The rise in claim and orders volumes is observed across all geographical regions. As in previous quarters, a concentration was seen in London, with 6,738 landlord claims and 4,781 landlord orders at London courts in January to March 2023, accounting for 29% and 27% of the respective totals. In London, there was an increase of 39% (from 4,851 in January to March 2022) for landlord claims and an increase of 95% for landlord orders (from 2,457 in January to March 2022).
The 52% increase in landlord warrants compared to January to March 2022, was accompanied by large increases across all regions. The largest regional number (3,333) was again found in London, making up 32% of all landlord warrants. There was an increase of 105% for landlord warrants in London (from 1,622 in January to March 2022 to 3,333 in January to March 2023).
6. Landlord Possession Timeliness
Median timeliness figures have decreased for landlord orders, warrants and repossessions and are returning to pre-Covid levels.
The median average time from claim to repossession has decreased to 22.3 weeks, down from 27.3 weeks in the same period of 2022.
Timeliness figures are higher than the legal guidelines. The law requires at least 4 and no more than 8 weeks between claim and court hearing. Possession orders stipulate when a tenant must vacate the property - typically within 4 weeks from the date the order was made. Landlords cannot issue a warrant until after this period (if the tenant has failed to comply).
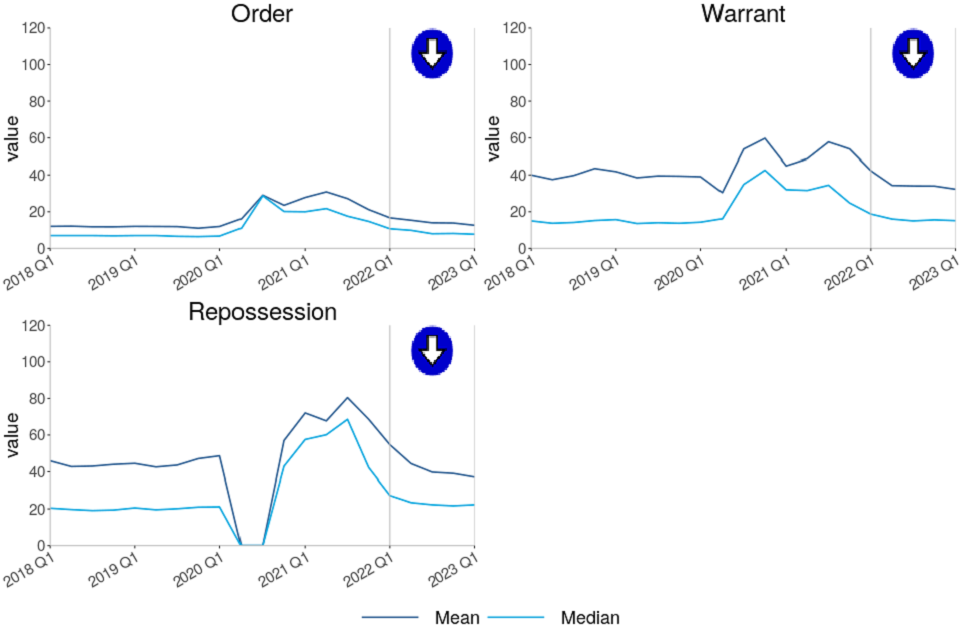
Figure 4: Mean and median average timeliness of landlord possession actions, January to March 2018 to January to March 2023 (Source: Table 6)
Number of weeks taken from initial landlord claim to…
-
Claims to order median timeliness has decreased to 7.7 weeks, down from 10.7 weeks in the same period in 2022.
-
Claims to warrant median timeliness has decreased to 15.1 weeks, down from 18.7 weeks in the same period in 2022.
-
Claims to repossessions median timeliness has decreased to 22.3 weeks, down from 27.3 weeks in the same period in 2022.
As shown by Figure 4, median figures are generally considerably lower than mean figures, demonstrating that on average, the progression from claim to successive stages can be positively skewed by outlying cases.
7. Regional Possession Claims
Since Q4 2022, the methodology used for calculating the rates of possession claims and repossessions had been modified to take into account the variation in proportions of tenure types in each local authority as shown in the 2021 census. The previous methodology used total household figures as the denominator for all claims and repossessions rates. This has now been modified to use household volumes by tenure[footnote 1]; mortgage, social and private landlord volumes for each local authority. For example, the rate of mortgage claims is now calculated as the number of mortgage claims divided by the number of households owned by a mortgage or loan in each LA. Similarly, rates for private and social landlord claims and repossessions have now been calculated separately[footnote 2] as a rate of households in each LA owned by a private or social landlord respectively. More information on this change is provided in the accompanying guide here.
Kensington and Chelsea, in the London region, had the highest rate of mortgage possession claims at 177 per 100,000 households owned by mortgage or loan, followed by Newham (London region) and Hackney (London region); with 158 and 146 claims per 100,000 respectively. Kensington and Chelsea, Newham and Hackney have 14%, 26% and 18% respectively of their accommodation owned with a mortgage or loan. It should be noted that the number of possessions in the Kensington and Chelsea is less than 10, so represents a small number, and there are also a small number of households owned with a mortgage or loan.
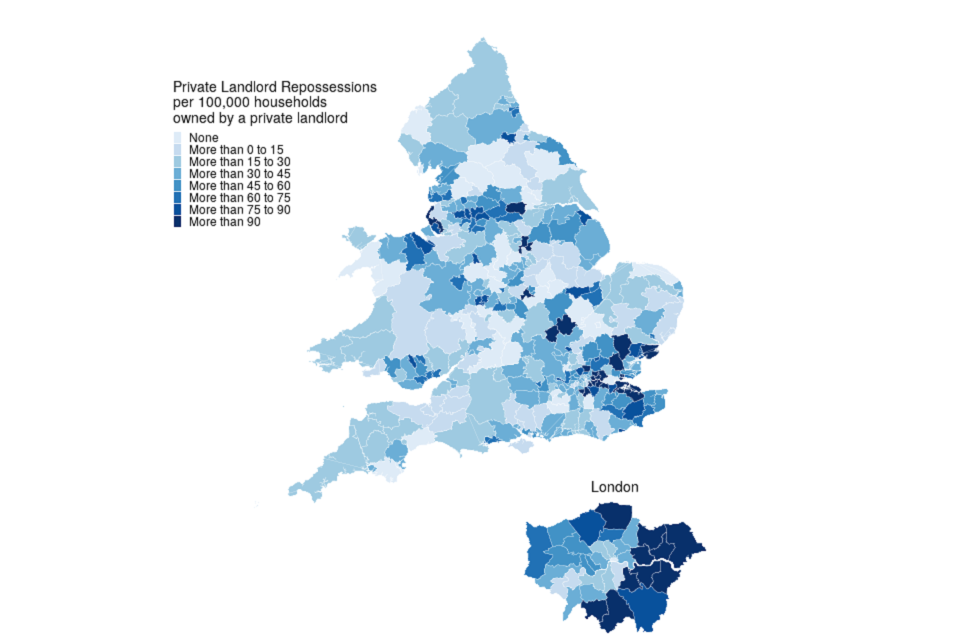
The highest private landlord possession claim rates were found in London, with 5 of the 10 highest rates occurring in this region. Harlow had the highest rate for private landlord claims (429 per 100,000 households owned by a private landlord). 39% of the households in Harlow were privately rented.
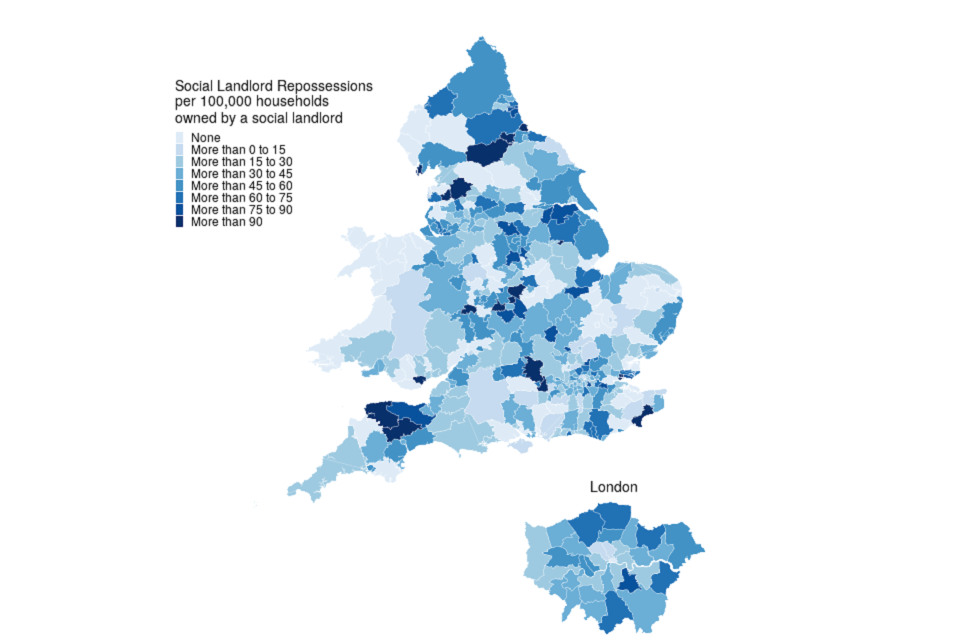
The highest social landlord possession claim rates were also found in London with 2 of the 10 highest rates occurring in this region. Watford had the highest rate for social landlord claims (794 per 100,000 households owned by a social landlord). 16% of all households in Watford were in the social rented sector, for example through the local council or housing association.
Figure 5: Mortgage possession Claims per 100,000 households owned by a mortgage or loan, January to March 2023 (Source: map.csv; see supporting guide)
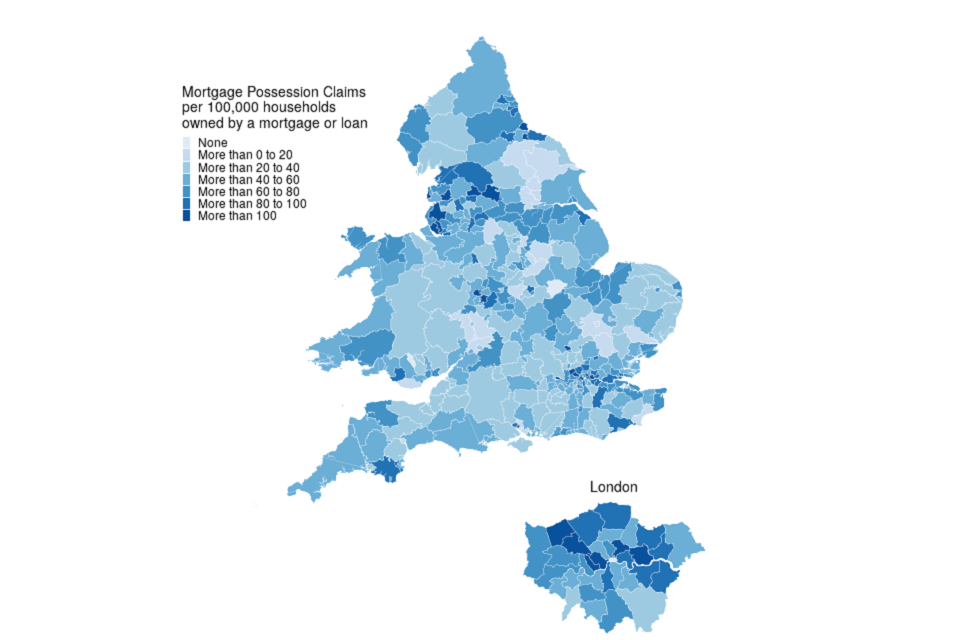
| Local Authority | Rate (per 100,000 households owned by a mortgage or loan) | Actual number |
|---|---|---|
| Kensington and Chelsea | 177 | 14 |
| Newham | 158 | 33 |
| Hackney | 146 | 23 |
3 local authorities had no mortgage possession claims during this period. Excluding these, Gedling had the lowest rate of mortgage claims (5.7 per 100,000 households owned by a mortgage or loan).
Figure 6: Private landlord possession Claims per 100,000 households owned by a private landlord, January to March 2023 (Source: map.csv; see supporting guide)
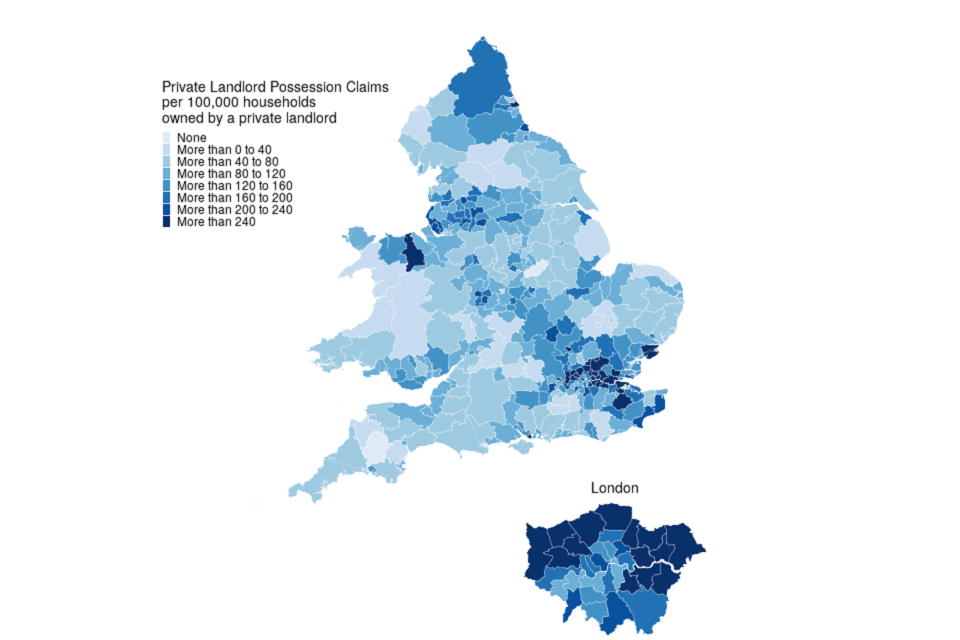
| Local Authority | Rate (per 100,000 households owned by a private landlord) | Actual number |
|---|---|---|
| Harlow | 429 | 25 |
| Basildon | 405 | 44 |
| Barking and Dagenham | 402 | 72 |
London boroughs accounted for 5 of the 10 local authorities with the highest rate of private landlord claims.
3 local authorities had no private landlord claims during this period. Excluding this, Vale of White Horse had the lowest rate of private landlord claims (11.1 per 100,000 households owned by a private landlord).
Figure 7: Social landlord possession Claims per 100,000 households owned by a social landlord, January to March 2023 (Source: map.csv; see supporting guide)
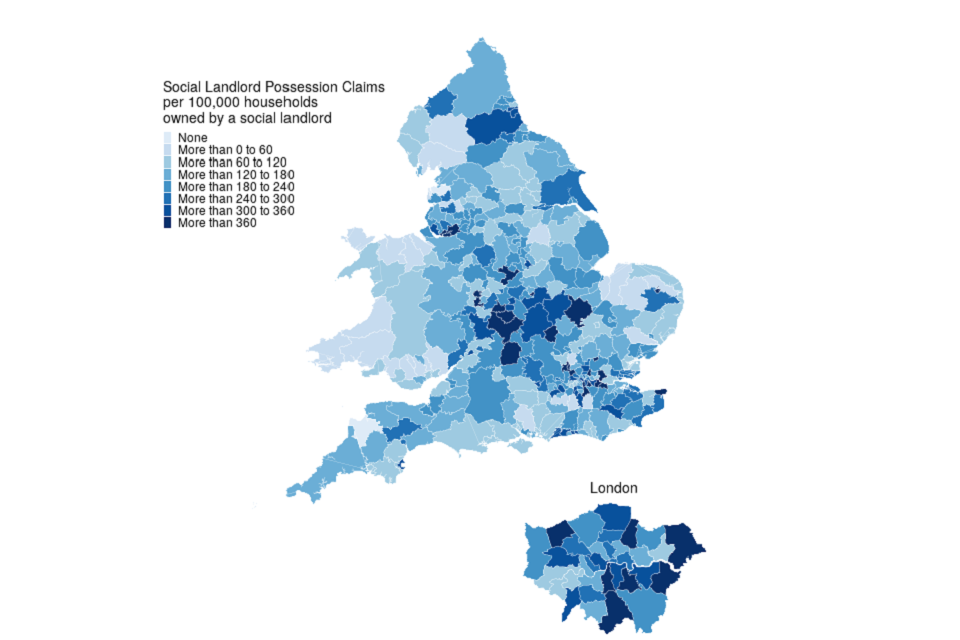
| Local Authority | Rate (per 100,000 households owned by a social landlord) | Actual number |
|---|---|---|
| Watford | 794 | 49 |
| Dartford | 554 | 35 |
| Warwick | 488 | 43 |
London boroughs accounted for 2 of the 10 local authorities with the highest rate of social landlord claims.
3 local authorities had no social landlord claims during this period. Excluding this, Conwy had the lowest rate of social landlord claims (16 per 100,000 households owned by a social landlord).
8. Regional Repossessions (by County Court Bailiffs)
Blaenau Gwent had the highest overall rate of mortgage repossessions at 65 per 100,000 households owned by a mortgage or loan.
Private landlord repossessions were highest in Barking and Dagenham with 235 per 100,000 households owned by a private landlord.
Social landlord repossessions were highest in Castle Point with 146 per 100,000 households owned by a social landlord.
Figure 8: Mortgage repossessions per 100,000 households owned by a mortgage or loan, January to March 2023 (Source: map.csv; see supporting guide)
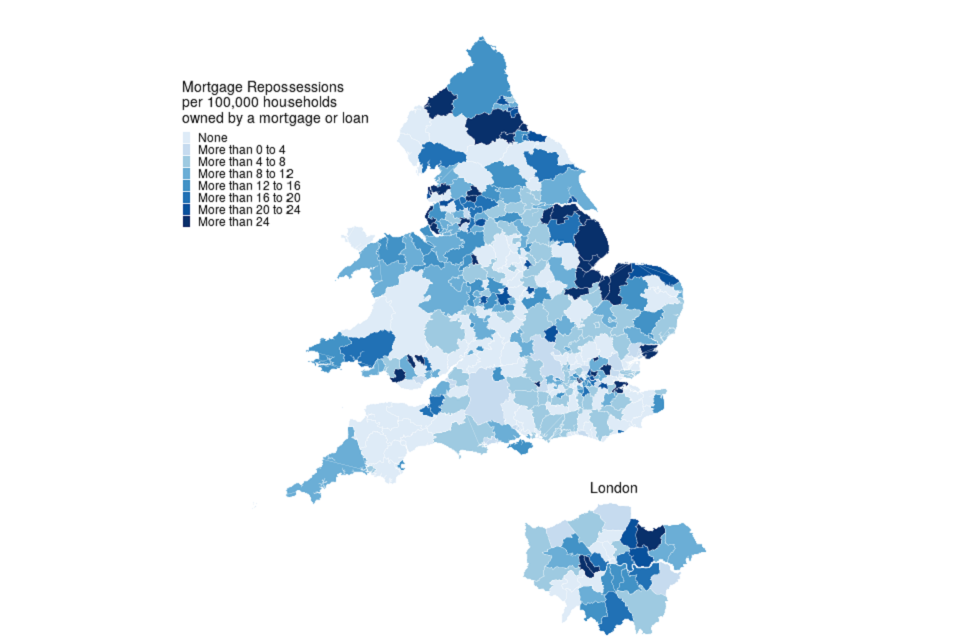
| Local Authority | Rate (per 100,000 households owned by a mortgage or loan) | Actual number |
|---|---|---|
| Blaenau Gwent | 65 | <10 |
| Wyre | 55 | <10 |
| Pendle | 47 | <10 |
No repossessions by county court bailiffs were recorded during this period in 96 local authorities out of a total of 331.
Figure 9: Private landlord repossessions per 100,000 households owned by a private landlord, January to March 2023 (Source: map.csv; see supporting guide)
| Local Authority | Rate (per 100,000 households owned by a private landlord) | Actual number |
|---|---|---|
| Barking and Dagenham | 235 | 42 |
| Havering | 194 | 31 |
| Tendring | 187 | 25 |
London local authorities account for 4 of the 10 boroughs with the highest rate of private landlord repossessions.
35 local authorities had no private landlord repossessions by county court bailiffs in January to March 2023.
Figure 10: Social landlord repossessions per 100,000 households owned by a social landlord, January to March 2023 (Source: map.csv; see supporting guide)
| Local Authority | Rate (per 100,000 households owned by a social landlord) | Actual number |
|---|---|---|
| Castle Point | 146 | <10 |
| Ribble Valley | 139 | <10 |
| Preston | 137 | 15 |
50 local authorities had no social landlord repossessions by county court bailiffs in January to March 2023.
As with claims, it should be noted that for some of these areas the rates are based on a small number of possessions.
9. Further information
The statistics in the latest quarter are provisional and revisions may be made when the next edition of this bulletin is published. If revisions are needed in subsequent quarters, these will be annotated in the tables.
9.1 Accompanying files
As well as this bulletin, the following products are published as part of this release:
-
A supporting guide providing further information on how the data is collected and processed, including a guide to the csv files, as well as legislation relevant to mortgage possessions and background information.
-
A set of overview tables, covering key sections of this bulletin.
-
CSV files of the map data and the possession action volumes by local authority and county court.
-
A data visualisation tool which provides a detailed view of the Mortgage and Landlord statistics. We welcome feedback on this tool to help improve it in later editions and to ensure it meets user needs.
9.2 National Statistics status
National Statistics status means that official statistics meet the highest standards of trustworthiness, quality and public value.
All official statistics should comply with all aspects of the Code of Practice for Statistics. They are awarded National Statistics status following an assessment by the Authority’s regulatory arm. The Authority considers whether the statistics meet the highest standards of Code compliance, including the value they add to public decisions and debate.
It is the Ministry of Justice’s responsibility to maintain compliance with the standards expected for National Statistics. If we become concerned about whether these statistics are still meeting the appropriate standards, we will discuss any concerns with the Authority promptly. National Statistics status can be removed at any point when the highest standards are not maintained, and reinstated when the standards are restored. These statistics have been audited and re-accredited as National Statistics. The most recent compliance check completed by the Office of Statistics Regulation can be found here.
9.3 Future publications
Our statisticians regularly review the content of publications. Development of new and improved statistical outputs is usually dependent on reallocating existing resources. As part of our continual review and prioritisation, we welcome user feedback on existing outputs including content, breadth, frequency and methodology. Please send any comments you have on this publication including suggestions for further developments or reductions in content.
9.4 Contact
Press enquiries should be directed to the Department for Levelling Up, Housing and Communities press office:
email: newsdesk@levellingup.gov.uk
Other enquiries and feedback on these statistics should be directed to the Data and Evidence as a Service division of the Ministry of Justice:
Rita Kumi-Ampofo - email: CAJS@justice.gov.uk
Next update: 10 August 2023
© Crown Copyright
Produced by the Ministry of Justice
Alternative formats are available upon request from ESD@justice.gov.uk
-
Tenure - Office for National Statistics ons.gov.uk. ↩
-
Please note rates for private and social landlord possession claims and repossessions do not include accelerated claims. This is because accelerated claims are recorded onto the case management system at point of entry so do not specify the tenure type. ↩