Maintained schools and academies inspections and outcomes as at 31 March 2017
Updated 25 October 2017

© Crown copyright 2017
This publication is licensed under the terms of the Open Government Licence v3.0 except where otherwise stated. To view this licence, visit nationalarchives.gov.uk/doc/open-government-licence/version/3 or write to the Information Policy Team, The National Archives, Kew, London TW9 4DU, or email: psi@nationalarchives.gov.uk.
Where we have identified any third party copyright information you will need to obtain permission from the copyright holders concerned.
This publication is available at https://www.gov.uk/government/statistics/maintained-schools-and-academies-inspections-and-outcomes-as-at-31-march-2017/maintained-schools-and-academies-inspections-and-outcomes-as-at-31-march-2017
This release contains:
- most recent inspection outcomes as at 31 March 2017
- provisional data for inspections completed between 1 January 2017 and 31 March 2017
- revised data for inspections completed between 1 September 2016 and 31 December 2016
A similar proportion of schools have been judged good or outstanding this year as last year
Seventy five per cent of inspections this year to date resulted in a good or outstanding judgement (see figure 1). This is similar to the 73% seen in the 2015/16 academic year.
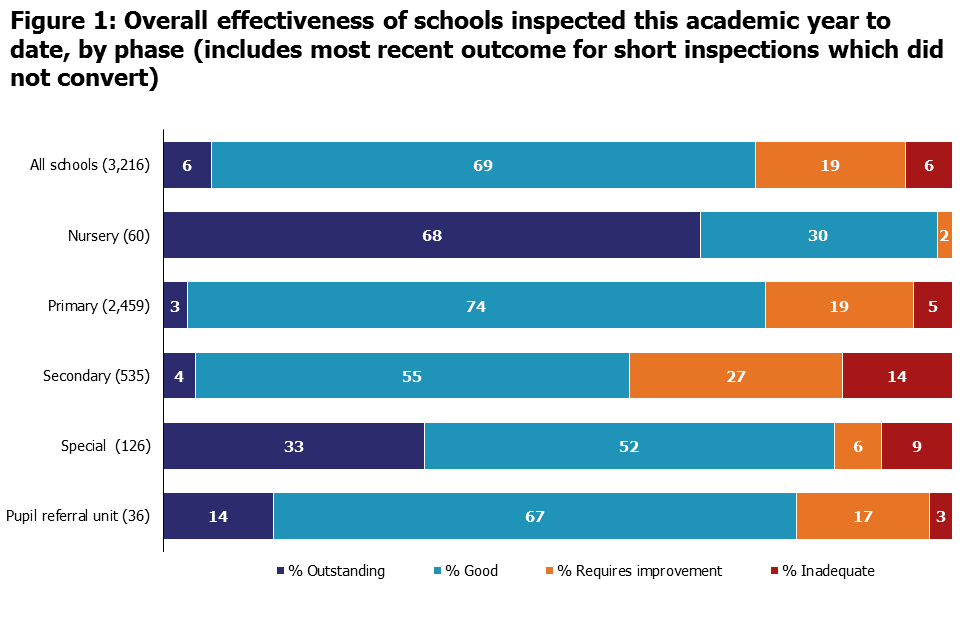
Figure 1
Fewer short inspections are converting to full inspections but a higher proportion of those converting are then declining
Twenty nine per cent of short inspections between 1 September 2016 and 31 March 2017 converted to full inspections. In 2015/16, 35% converted. Sixty per cent of converted inspections resulted in the school declining to less than good, compared to 46% in 2015/16.
Some of the schools that did not improve this year have performed poorly for a long time
Out of the schools that previously required improvement and were inspected this year but did not improve, there are 97 primary and secondary schools that have not been judged to be good or outstanding in any inspection since 2005.
1. Inspections between 1 September 2016 and 31 March 2017
There were 1,612 section 5 inspections conducted from 1 September 2016 to 31 March 2017 where the inspection report was published by 30 April 2017. Forty per cent of these were short inspections that converted to a full section 5. There were additionally 1,604 short inspections that did not convert to a full section 5.
The proportion of full section 5 inspections resulting in a good or outstanding grade has fallen from 63% in the 2015/16 academic year to 49% in the current academic year to date. However, when the most recent outcome for short inspections which did not convert to a full inspection are also included, a higher proportion are good or outstanding - 73% judged good or outstanding in 2015/16 compared with 75% this academic year.
The pattern of overall effectiveness outcomes seen in a single year is influenced by the previous inspection grades of schools inspected in that year. The mix of schools inspected so far this year is a much stronger group than those inspected last year. Seventy seven per cent of the schools inspected had been judged good or outstanding at their previous inspection, compared with 46% of those inspected in the 2015/16 academic year. This is mainly due to conducting more short inspections of good and outstanding schools this year (1,477 in 2015/16 compared with 2,251 this academic year to date). Despite this change in the mix of schools inspected, there is only a marginal improvement in the inspection outcomes seen so far this year.
The reason for only marginally better inspection outcomes despite a much higher previous grade profile, is the lack of improvement of schools that require improvement (RI). As can be seen in figure 2, the proportion of good schools retaining their grade or improving has remained relatively constant (81% good or outstanding in 2015/16 compared to 82% in 2016/17 to date). However, the proportion of schools judged to require improvement subsequently improving to good or outstanding has decreased by 11 percentage points this year compared to 2015/16.
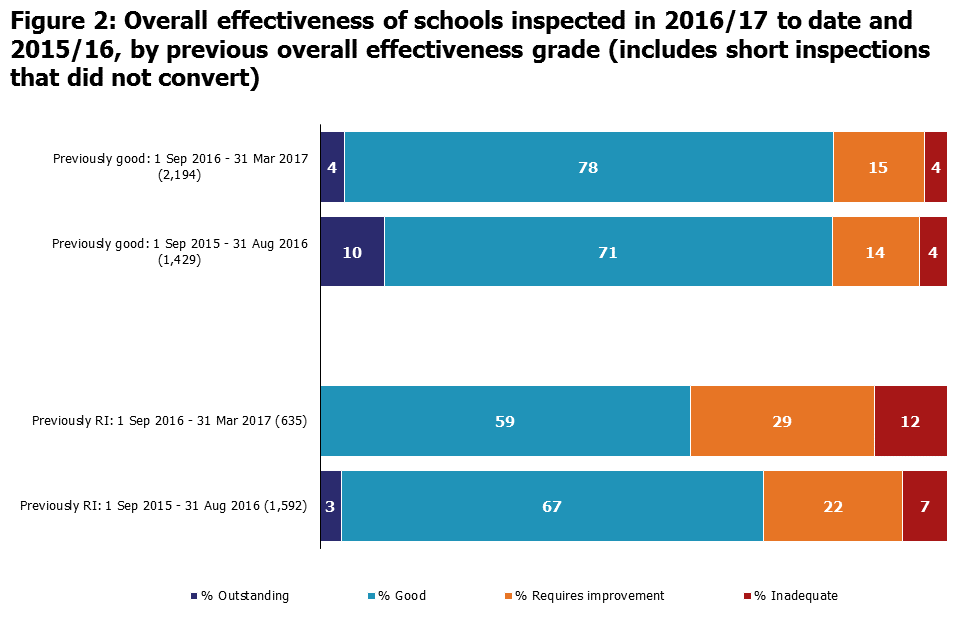
Figure 2
Inspections of schools previously judged to require improvement
There were 635 full section 5 school inspections between September 2016 and March 2017 of schools that were previously judged to require improvement. Fifty nine per cent of these inspections resulted in the school improving to good. Less than one per cent (four schools) improved to outstanding. A higher proportion of primary schools improved to good or outstanding than secondary schools, 64% compared with 41%. Additionally, fewer primary schools declined to inadequate, 8% compared with 23% for secondary schools (see figure 3). The proportion of schools that improved from requires improvement to good or outstanding has fallen for both primary and secondary schools this year when compared to last year.
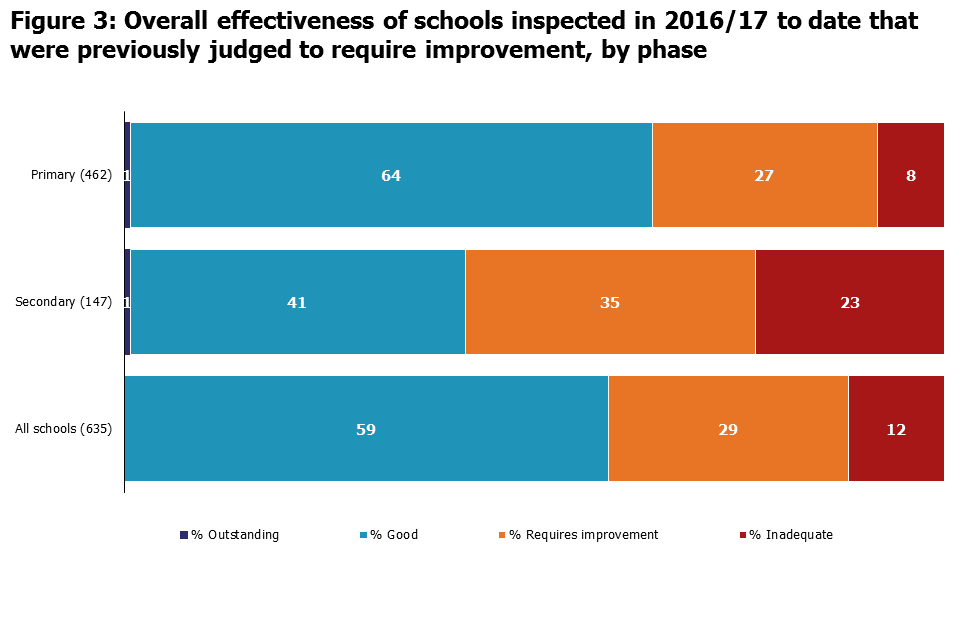
Figure 3
Longer term inspection history of schools previously judged to require improvement
At the end of March 2017, 9% of schools were judged to require improvement at their most recent inspection. This is a marked improvement from August 2012, when 28% of schools were ‘satisfactory’[footnote 1]. However a lower proportion of schools previously judged to require improvement improved at their inspection this year (figure 2). Some of the schools that did not improve this year have had consistently poor inspection outcomes for an extended period of time.
Of the 86 secondary schools which remained RI or declined to inadequate this year, 42 (49%) have never been judged good or outstanding in any inspection since 2005[footnote 2]. Over 35,000 pupils currently attend these schools.
Of the 165 primary schools which remained RI or declined to inadequate this year, 55 (33%) have never been judged good or outstanding in any inspection since 2005. Over 18,000 pupils currently attend these schools.
Inspection outcomes by level of deprivation
Comparing the overall effectiveness grade with the effectiveness of leadership and management grade of schools inspected this academic year, shows that schools with more pupils from deprived areas[footnote 3] are more likely to receive a higher leadership and management grade than overall effectiveness grade (see figure 4).
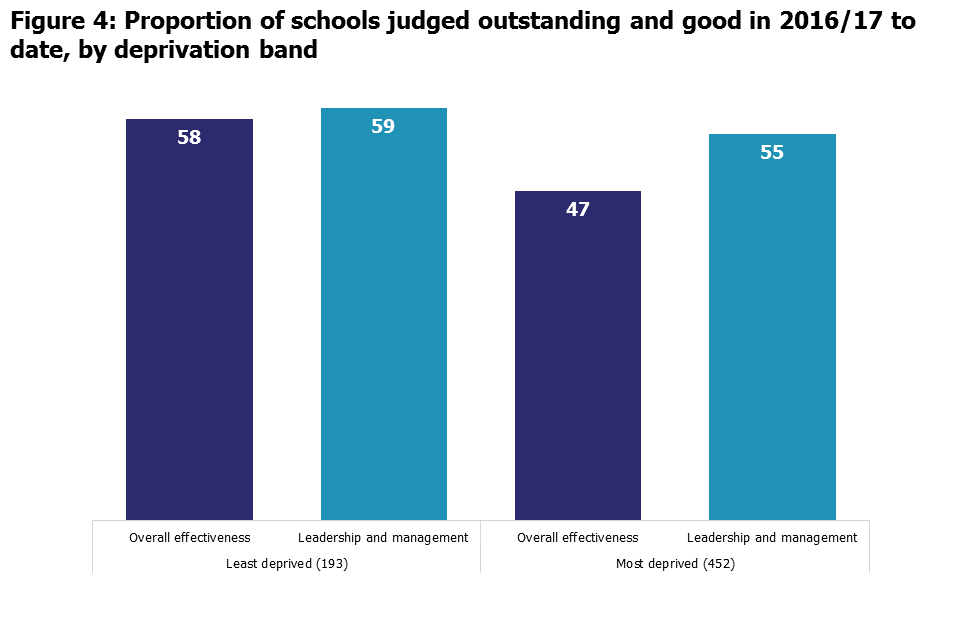
Figure 4
This can be seen when looking at the gap between good and outstanding overall effectiveness and leadership and management grades in areas with differing levels of deprivation:
- in the least deprived areas 58% of schools have a good or outstanding overall effectiveness grade and a very similar proportion, 59%, have a good or outstanding leadership and management grade
- in the most deprived areas 47% of schools have a good or outstanding overall effectiveness grade, but 55% have a good or outstanding leadership and management grade
There is also a difference between schools in different deprivation bands when looking at the proportion of schools that retained their good judgement on their inspection this year (inclusive of short inspections). Schools with less deprived intakes are more likely to retain their good grade than schools with more deprived intakes.
For primary schools inspected so far in 2016/17 that were judged to be good at their previous inspection:
- 89% with the least deprived intakes retained their good grade or improved to outstanding
- 74% with the most deprived intakes retained their good grade or improved to outstanding
For secondary schools inspected so far in 2016/17 that were judged to be good at their previous inspection:
- 82% with the least deprived intakes retained their good grade or improved to outstanding
- 64% with the most deprived intakes retained their good grade or improved to outstanding
This suggests that schools with more deprived intakes find it more difficult to maintain strong performance, and retain a good overall effectiveness grade at their subsequent inspection.
Short inspections of good or outstanding schools
There were 2,251 short inspections carried out between 1 September 2016 and 31 March 2017. The vast majority of short inspections (2,165) were of schools which were good at their previous inspection, and a small minority (86) were of schools which were outstanding at their previous inspection. Almost two thirds of short inspections were carried out in the spring term[footnote 4] (1,426).
The proportion of short inspections converting to a full section 5 inspection has reduced again in the last few months, to 29%. This compares with 35% in 2015/16 and 31% in the previous official statistics publication from 1 September to 31 December 2016.
Of the schools that have a short inspection which converts to a full inspection, a higher proportion so far this year are declining to less than good – 60% declined to less than good on conversion this year to date, compared with 46% in 2015/16. A higher proportion of schools declined to requires improvement - 49% this year compared to 37% in 2015/16. Also fewer schools are improving from good to outstanding in a converted inspection this year – 13% of previously good schools compared with 28% in 2015/16.
Last year a higher proportion of secondary schools than primary schools declined following a converted short inspection. This year, a similar proportion of both primary and secondary schools are declining on conversion:
- so far this year, 62% of primary schools and 61% of secondary schools declined on conversion
- in 2015/16, 43% of primary schools and 53% of secondary schools declined on conversion
Figure 5 shows the results of short inspections for primary and secondary schools in 2016/17 to date. All of these schools were judged to be good at their previous inspection[footnote 5].

Figure 5
Note that data on short inspections for nurseries, special schools and pupil referral units is included in table 6 of the associated charts and tables Excel document.
2. Schools at their most recent inspection
Since the end of August 2016 there has been little change in the proportion of schools graded outstanding, good, requires improvement and inadequate. Eighty nine per cent of schools were good or outstanding at their most recent inspection, the same as in August. The proportion remains at 90% for primary schools, but has increased from 78% to 79% for secondary schools.
The slight increase in the proportion of good or outstanding secondary schools is due to a one percentage point increase in the proportion judged outstanding, and a one percentage point decrease in the proportion judged requires improvement, compared to the end of August 2016.
Pupil referral units
Pupil referral units (PRUs) are a type of alternative provision for children who are not able to attend a mainstream school for reasons such as long or short term illness or who are excluded from school. Within Ofsted statistics PRUs also includes some academy and free school alternative provision.
The overall number of pupil referral units has fallen, and their grade profile has been changing over time. The overall number of PRUs in England has fallen by around 50 since 2012, by 31 March 2017 there were 350 units. The proportion of PRUs judged good for overall effectiveness at their most recent inspection has increased over the same period (see figure 6). The proportion of PRUs judged to be good has increased as more PRUs have improved from requires improvement. The proportion judged to be inadequate or outstanding has been fairly stable over the period.
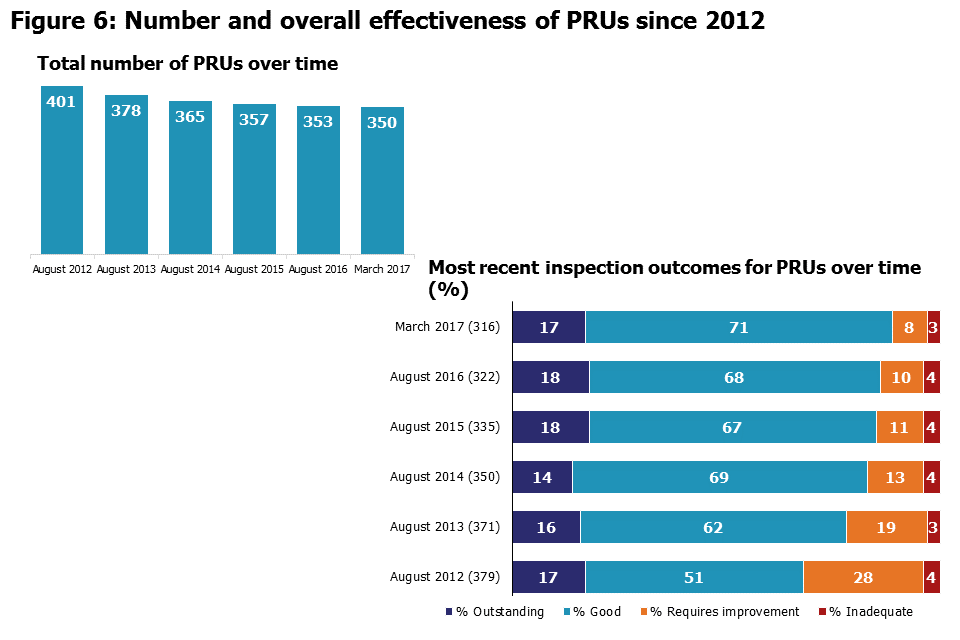
Figure 6
The gradual increase in the proportion of good or outstanding PRUs now means that the proportion currently judged good or outstanding at their most recent inspection (89%) is the same as the proportion of all state-funded schools judged good or outstanding.
The length of time since each school’s most recent inspection
Ofsted is required to inspect schools at prescribed intervals. Regulations set the intervals for primary and secondary schools ‘within 5 school years from the end of the school year in which the last inspection took place chart’. Exceptions to this are outstanding schools that are exempt from routine inspection and are only inspected if there is a cause for concern[footnote 6]. Figure 7[footnote 7] shows the time of the most recent Ofsted inspection of all primary and secondary schools.
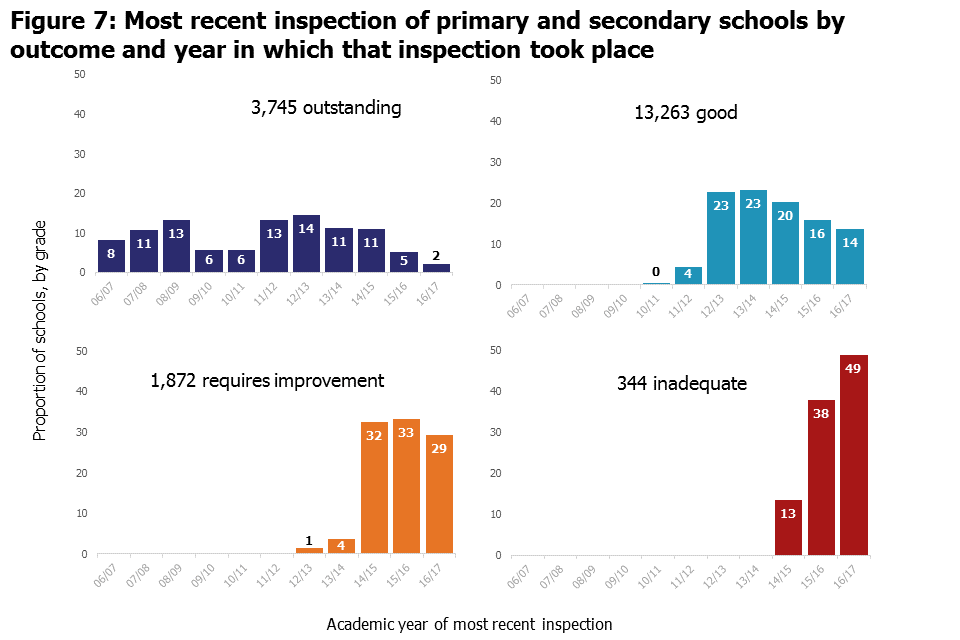
Figure 7
This illustrates that:
- almost 90% of schools most recently judged inadequate have been inspected within the last eighteen months (as at 31 March 2017)
- 95% of school most recently judged to require improvement have been inspected in the last two and a half years
- 95% of good schools have been inspected within the last 5 years
Outstanding primary and secondary schools are exempt from routine inspection. As a result, for 8% of outstanding schools their last inspection was as long ago as 2006/7. However, for more than half of outstanding schools their most recent inspection was within the last 6 years.
School closures and academy orders
Seven hundred and fifty seven schools have closed since the end of August 2016. All but 40 of these have re-opened, the vast majority (97%) as academies[footnote 8].
Since The Education and Adoption Act came in to force in April 2016 the Department for Education (DfE) now issues a directive academy orders to any local authority school judged to be inadequate. Since the end of August 2016, 65 schools have closed and re-opened as academies as the result of a directive academy order.
There are currently 1,012 open schools with no inspection grade. As schools close and re-open they can lose their inspection history[footnote 9] and this can affect the national proportions of overall effectiveness grades. Of the schools with no inspection grade:
- 73% are sponsor-led academies
- 20% are new free schools, studio schools and university technical colleges
- 4% are local authority schools
- 3% are academy converters
The academy converters with no inspection grade are likely to be academies that have been ‘rebrokered’ from one academy trust to another. As part of this process the DfE may sometimes treat the academy as a new school, assign a new URN and LAESTAB, and the school loses its inspection history.
3. Revisions to previous release
Provisional data indicated that there were 927 section 5 inspections between 1 September 2016 and 31 December 2016, as published by 31 January 2017. Revised data shows that an additional 39 inspections took place where the report was published too late for inclusion in the provisional data. Twenty one were inspections of primary schools, 17 were inspections of secondary schools and one was an inspection of a special school.
Twenty three of these 39 additional inspections resulted in an inadequate judgement. Inspections leading to an inadequate judgement undergo additional moderation and are sometimes published later than reports for schools with other overall effectiveness grades. See the methodology and quality report for more details.
The addition of these inspection outcomes slightly changes the pattern seen in inspections between 1 September and 31 December 2016. The percentage of good or outstanding secondary schools reduces by two percentage points to 34%, and the percentage of good or outstanding primary schools reduces by one percentage point to 55%. The percentage of inadequate secondary schools increases from 19% to 23%, and the percentage of inadequate primary schools increases by one percentage point to 11%.
Further details can be found in the revised table 2 of the charts and tables Excel document.
4. Consultation on changes to short inspections
Please note that Ofsted is currently consulting on changes to the way we conduct short inspections for good schools. The consultation closes on 18 August 2017 and users are encouraged to read and respond to the consultation.
5. Notes
Data in this release is from inspections undertaken between 1 September 2016 and 31 March 2017 and most recent inspections of open schools at 31 March 2017, where the inspection report was published by 30 April 2017. If an inspection report is not published by 30 April 2017 then the previous inspection, where available, will be reported as a school’s most recent inspection.
Inspections are conducted under sections 5 and 8 of the Education Act 2005. Under exceptional circumstances Ofsted may withhold publication of an inspection report.
An explanation of the key uses of this data and further contextual information and the arrangements for quality assurance is provided in the accompanying methodology and quality report.
The methodology and quality report provides information about strengths and limitations of the statistics.
6. Glossary
Academies
Academies are publicly funded independent schools. Academies do not have to follow the national curriculum and can set their own term times. They still have to follow the same rules on admissions, special educational needs and exclusions as other state schools.
Academies get money direct from the government, not the local authority. They are run by an academy trust, which employs the staff. Some academies have sponsors such as businesses, universities, other schools, faith groups or voluntary groups. Sponsors are responsible for improving the performance of their schools.
Academies include converter and sponsor-led academies, free schools, university technical colleges and studio schools.
Academy converters
Academy converters are schools which have opted to become an academy, most of which were good or outstanding local authority maintained schools before they became an academy. They do not have to follow the national curriculum and can set their own term times. They still have to follow the same rules on admissions, special educational needs and exclusions as other state schools.
Academy converters retain their latest inspection grade, even if the most recent inspection was of the predecessor school.
Sponsor-led academies
Sponsor-led academies are academies which have sponsors such as businesses, universities, other schools, faith groups or voluntary groups. Sponsors are responsible for improving the performance of their schools.
Sponsor-led academies are viewed as new legal entities and do not retain their inspection history.
Free schools
Free schools are funded by the government but are not run by the local authority. They are set-up on a not-for-profit basis by charities, universities, and community and faith groups, among others.
Free schools are ‘all-ability’ schools, so cannot use academic selection processes like a grammar school. They can set their own pay and conditions for staff and change the length of school terms and the school day. Free schools do not have to follow the national curriculum.
Local authority maintained schools
Maintained schools are funded by the government and run by the local authority. They must follow the national curriculum.
Short inspections
All good schools now receive short inspections, as do outstanding nursery, pupil referral units and special schools. Short inspections include one day in the school and take place approximately every three years. A short inspection determines whether the school continues to provide the same good or outstanding standard of education for pupils. A short inspection does not result in individual graded judgements nor does it change the overall effectiveness grade of the school. If the inspection is converted to a full inspection then inspectors will make the full set of graded judgements required under section 5.
7. Further information
Contact for comments or feedback
If you have any comments or feedback on this publication, please contact Louise Butler on 03000 131 457 or Louise.Butler@ofsted.gov.uk
Acknowledgements
Thanks to the following for their contribution to this statistical release: Oli Bayntun, Talan George, James Jordan, Ralph McDevitt and Issa Mohamed.
-
The ‘satisfactory’ grade was replaced with ‘requires improvement’ in September 2012. ↩
-
This analysis draws on the full inspection history of these schools from 1 September 2005 onwards. Prior to that schools were inspected under Section 10, under very different inspection frameworks, so grades prior to 2005 are not comparable. The 97 schools which have never been judged to be good or outstanding at any point since 2005 have all had multiple inspections in this period, though some have not been open for the full period (for instance some academies). ↩
-
A school’s deprivation band is based on the Income Deprivation Affecting Children Index (IDACI) score for each school. The score for each school is derived from the home post codes of the pupils that attend the school. ↩
-
1 January 2017 to 31 March 2017. ↩
-
Short inspections are used for previously good schools for all phases (primary, secondary, special, nursery and PRU). They are also used for previously outstanding special schools, nurseries and PRUs. ↩
-
Concerns can include concerns about the performance of the school, or complaints made against the school. Outstanding nursery schools, special schools and pupil referral units are not exempt from routine inspection, and are inspected every 3 years. ↩
-
Percentages in the chart are rounded and may not add to 100. ↩
-
A small number of local authority schools have closed and re-opened with a new URN due to a merger or a change of religious character. ↩
-
Further detail available methodology and quality report that accompanies this release. ↩