Maintained schools and academies inspection outcomes as at 31 December 2016
Published 22 March 2017

© Crown copyright 2017
This publication is licensed under the terms of the Open Government Licence v3.0 except where otherwise stated. To view this licence, visit nationalarchives.gov.uk/doc/open-government-licence/version/3 or write to the Information Policy Team, The National Archives, Kew, London TW9 4DU, or email: psi@nationalarchives.gov.uk.
Where we have identified any third party copyright information you will need to obtain permission from the copyright holders concerned.
This publication is available at https://www.gov.uk/government/statistics/maintained-schools-and-academies-inspections-and-outcomes-as-at-31-december-2016/maintained-schools-and-academies-inspection-outcomes-as-at-31-december-2016
This release contains:
- provisional data for inspections completed between 1 September 2016 and 31 December 2016
- most recent inspection outcomes as at 31 December 2016
- revised data for inspections completed between 1 September 2015 and 31 August 2016
A slightly lower proportion of schools have been judged good and outstanding this year than last year
Six per cent of schools were judged to be outstanding in the autumn term 2016 compared to 8% in 2015/16. Sixty four per cent of schools were judged to be good compared to 65% last year[footnote 1]. These changes have had minimal impact on the profile of outcomes for all schools at their most recent inspection.
Chart 1: Overall effectiveness of schools inspected in 2016/17, by phase (includes most recent outcomes for short inspections which did not convert)
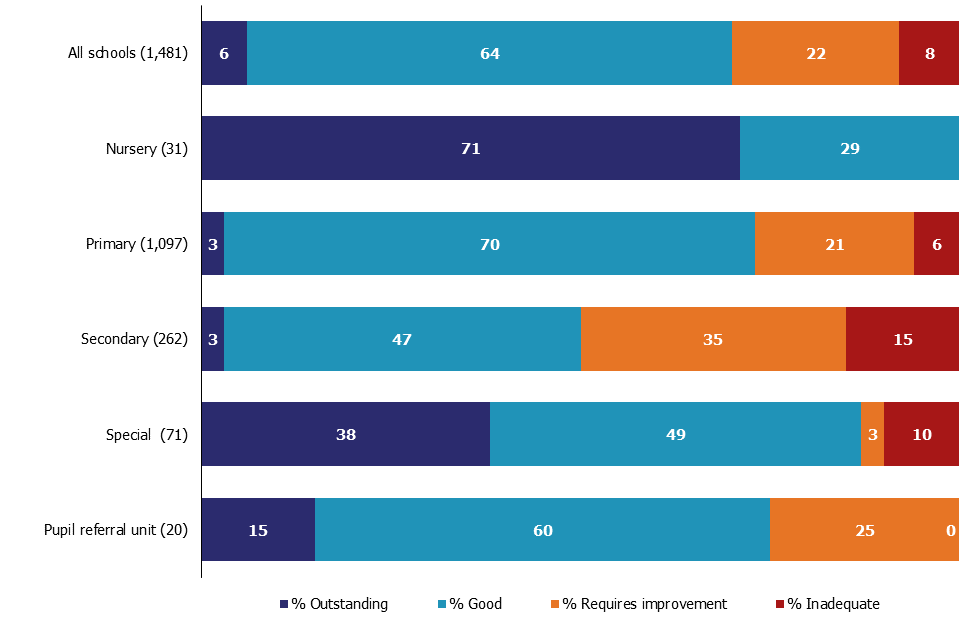
Chart 1
A lower proportion of schools previously judged to require improvement improved at their inspection this year
The proportion of schools previously judged to require improvement that improved their grade has decreased from 71% last year to 61% this year. Within this secondary schools were less likely to improve than primary schools, and schools with a higher proportion of pupils from deprived areas were less likely to improve than schools with less deprived pupils.
1. Inspections between 1 September 2016 and 31 December 2016
There were 927 section 5 inspections conducted from 1 September 2016 to 31 December 2016 where the inspection report was published by 31 January 2017. This includes 254 short inspections which converted to a full section 5 inspection.
The proportion of full section 5 inspections resulting in a good or outstanding judgement has fallen from 63% in the 2015/16 academic year to 52% in the autumn term 2016. However, when the most recent outcome for short inspections which did not convert to a full inspection are also included, this fall is much smaller: 73% judged good or outstanding in 2015/16 compared to 70% in autumn 2016.
The profile of inspection outcomes seen in a single year is influenced by the mix of schools inspected plus the outcomes of those inspections. The mix of schools inspected this year is a stronger group than those inspected last year, because 63% of the schools inspected had been judged at least good or outstanding at their previous inspection, compared to 46% of those inspected in the 2015/16 academic year. Despite this the profile of inspection outcomes has been slightly lower this year than last year, and this is driven by two factors. Firstly, there has been a two percentage point increase in the number of previously good schools dropping to requires improvement or inadequate this year. Secondly, there has been a ten percentage point decrease in the proportion of schools that require improvement that improved to good or better this year compared to last year.
Chart 2: Overall effectiveness of schools inspected in 2016/17 and 2015/16, by previous overall effectiveness grade (includes short inspections that did not convert)
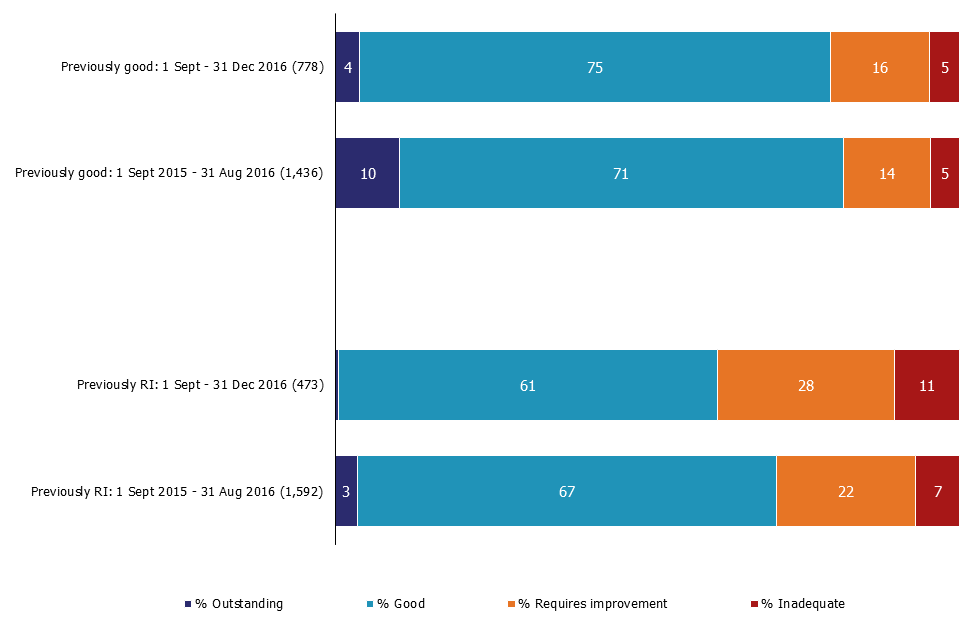
Chart 2
Inspections of schools previously judged to require improvement or to be inadequate
There were 473 full inspections between September and December 2016 of schools that were previously judged to require improvement. Sixty one per cent of these inspections resulted in the school improving to good, and less than one per cent (two schools) improved to outstanding. A higher proportion of primary than secondary schools improved to good or outstanding: 67% compared to 39%. Additionally fewer primary than secondary schools declined to inadequate: 8% compared to 18%. The proportion of schools that improved from requires improvement to good or outstanding has fallen for both primary and secondary schools this year, when compared to last year.
Chart 3: Overall effectiveness of schools inspected in 2016/17 that were previously judged to require improvement, by phase
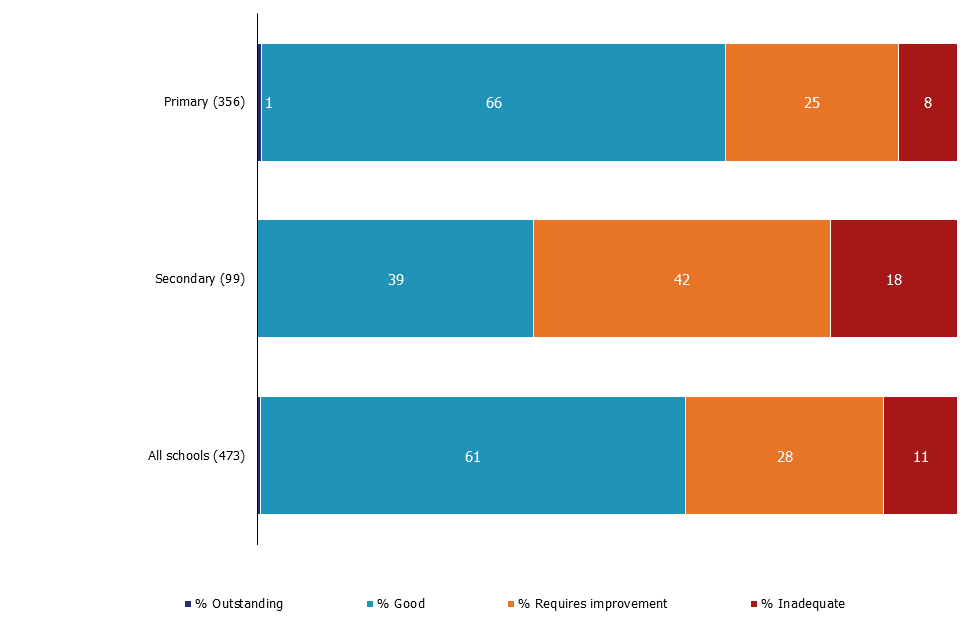
Chart 3
Across all schools previously judged to require improvement, those with higher proportions of deprived pupils were less likely to improve at their inspection this year, compared to those with lower proportions of deprived pupils. (See deprived/most deprived versus least/less deprived in chart 4[footnote 2]). Similarly schools with higher proportions of deprived pupils were more likely to decline to inadequate. However, the number of schools in each quintile is quite small, and there is not a smooth pattern across the five deprivation bands. There were only two schools that improved from requires improvement to outstanding this year, and both of these schools were in the most deprived quintile[footnote 3].
Chart 4: Overall effectiveness of schools inspected in 2016/17 that were previously judged to require improvement, by level of deprivation
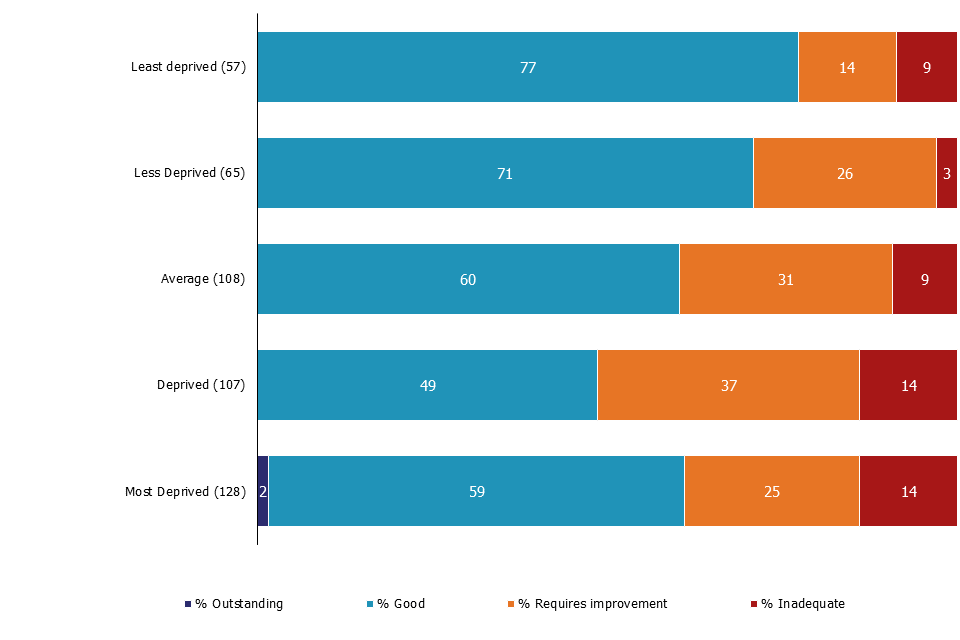
Chart 4
Out of the 473 schools inspected this year that had previously been judged to require improvement, 122 (26%) had been judged to require improvement at both of their last two inspections. This is a higher proportion than in 2015/16 (8%). This is to be expected because it is now four years since the requires improvement grade was introduced in September 2012.
These schools that had been judged to require improvement at each of their last two inspections were slightly more likely to decline to inadequate this year, when compared to schools which had only been judged to require improvement at one previous inspection[footnote 4] (16% compared to 9%). Conversely, the schools which had been judged to require improvement at their last two inspections were also slightly more likely to improve to good or outstanding (64% compared to 60%). Therefore, the fact that a growing proportion of schools have now been judged to require improvement at two previous inspections does not seem to be driving the fall seen this year in the proportion of schools improving from requires improvement.
There have been 27 inspections of schools previously judged inadequate this year. Of these, 22 resulted in the school improving: six to good and 16 to requires improvement. The remaining five schools were judged to be inadequate.
Short inspections of good or outstanding schools
There have been 808 short inspections carried out so far this academic year. This is more than twice the 344 conducted in the autumn term 2015/16, following a slow start at the beginning of the common inspection framework in September 2015.
Overall a lower proportion of short inspections have converted to a full inspection this year than last year, but a greater proportion have then declined at that full inspection. The net result has been a small increase in the proportion of schools declining overall.
Overall:
- thirty one per cent of short inspections converted to full inspections, compared to 35% in the previous year. At these inspections, 61% of schools saw a decline in their overall effectiveness grade, compared to 48% in the previous year.
- the result was that 19% of good or outstanding schools declined, compared to 17% last year
By phase:
- forty one per cent of inspections of secondary schools converted, compared to 32% for primary schools. At these inspections, 75% of secondary schools saw a decline in their overall effectiveness grade, compared to 60% of primary schools.
- the result was that 19% of good or outstanding schools primary schools declined, compared to 31% of secondary schools
2. Schools at their most recent inspection
Between August and December 2016 there have been very minor changes to the grade profile of all schools at their most recent inspection. The proportion of schools judged to be good or outstanding at their most recent inspection remains at 89%, as in the last release. Within this 21% of all schools were judged to be outstanding and 68% were judged to be good (no change).
For primary schools the proportion of good schools increased from 71% to 72%, while the proportion of schools judged to require improvement decreased from 9% to 8%. For secondary schools the proportion judged to be outstanding has increased from 22% to 23%, while the proportion judged to require improvement has decreased from 17% to 16%. All 400 nursery schools are now judged to be good or outstanding following the recent closure of one school that had been judged to require improvement.
Chart 5: Most recent overall effectiveness grade of schools
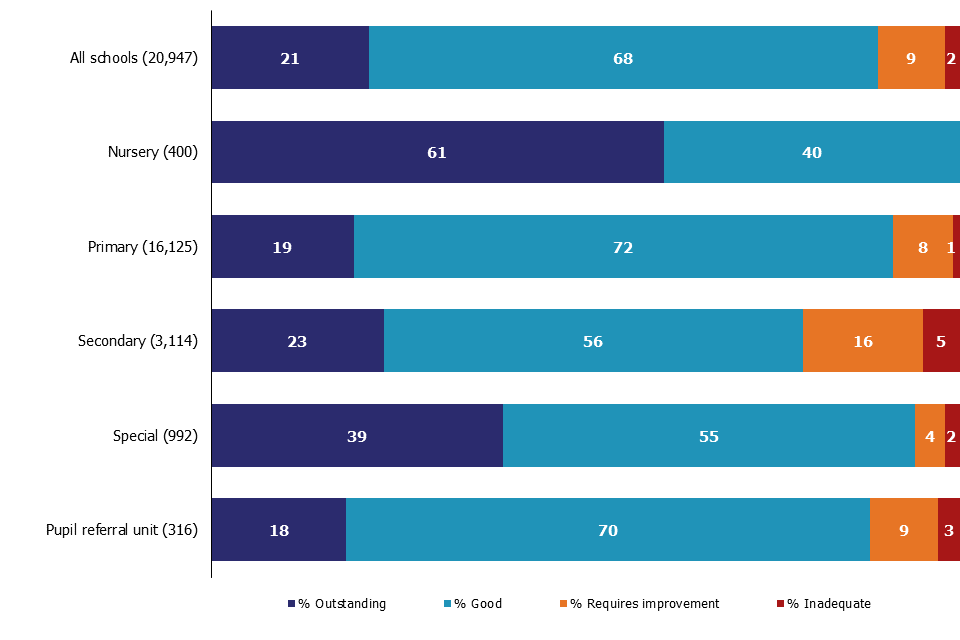
Chart 5
While the grade profile for schools inspected this academic year has been weaker than that for all schools at their most recent inspection, more schools improved their grade than declined at their inspection this year. This means that the inspections have still had a slightly positive effect on the overall picture of all schools at their most recent inspection. In addition, the majority of schools that have closed since August (and therefore dropped out of the figures) were less than good, while over half of schools inspected for the first time (which have therefore been added in to the dataset) were judged to be good or outstanding.
The impact of school closures and new schools on the data
Since August 2016, 533 schools have closed, of which 496 were local authority schools and 37 were academies. Three hundred and sixty five of the schools that closed have since re-opened as academy converters and remain in the dataset for this release. However 168 closed schools have dropped out of the dataset, either because they haven’t re-opened, or because they have re-opened as sponsor led academies and therefore are treated as new schools.
Out of the 168 schools that no longer appear in the dataset, 117 were judged to require improvement or to be inadequate at their last inspection. Weaker schools dropping out of the data has a small positive impact on the profile of inspection outcomes for schools at their most recent inspection.
Since The Education and Adoption Act came in to force in April 2016 the Department for Education now issues directive academy orders to any local authority schools judged to be inadequate. Nineteen of the 169 schools that have dropped out of the dataset since the last release have closed as a result of this process. Further local authority schools judged to be inadequate are likely to close over the coming months.
There are 1,018 schools which have not yet been inspected, which is 5% of all schools currently operating. These schools are mainly new sponsor led academies and free schools, and will be inspected in their third year of operation. These new schools will appear in the official statistics following their first inspection as the new academy.
Outstanding schools
Twenty one per cent of schools were judged to be outstanding at their most recent inspection (4,404 schools). Eighty four per cent of these outstanding schools are primary and secondary schools. Since the Education Act 2011 came in to force outstanding primary and secondary schools have been exempt from routine inspection and are only inspected if there is a cause for concern[footnote 5]. For 49% of these exempt schools their most recent inspection was within the last 5 years, but for 3% of these schools their most recent inspection was 10 years ago or longer[footnote 6] .
Regional outcomes of schools at their most recent inspection
London has the highest proportion of outstanding schools for both the primary and secondary phases (26% and 37% respectively). Yorkshire and the Humber has the highest proportion of inadequate primary schools (2%) and the North East has the highest proportion of inadequate secondary schools (9%). See table 1.
For both the primary and secondary phases there has been a slight increase in the proportion of schools judged good or outstanding compared to August 2016 in six of the nine regions: Yorkshire and Humber, East Midlands, West Midlands, East of England, South East, and London. For primary schools the largest positive shift has been in the West Midlands, with a one percentage point increase in good schools and a two percentage point decrease in schools requiring improvement. The largest negative shift was in the North East, with a one percentage point increase in schools requiring improvement and a one percentage point decrease in good schools. For secondary schools the largest positive shift has been in the East of England, with a five percentage point increase in good schools, a four point decrease in schools judged to require improvement, and a one point decrease in schools judged to be inadequate. As with primary schools the largest negative shift for secondary schools has been in the North East, with a two percentage point increase in both requires improvement and inadequate and a four percentage point decrease in good schools.
Table 1: Most recent overall effectiveness of primary and secondary schools, by region[footnote 7]
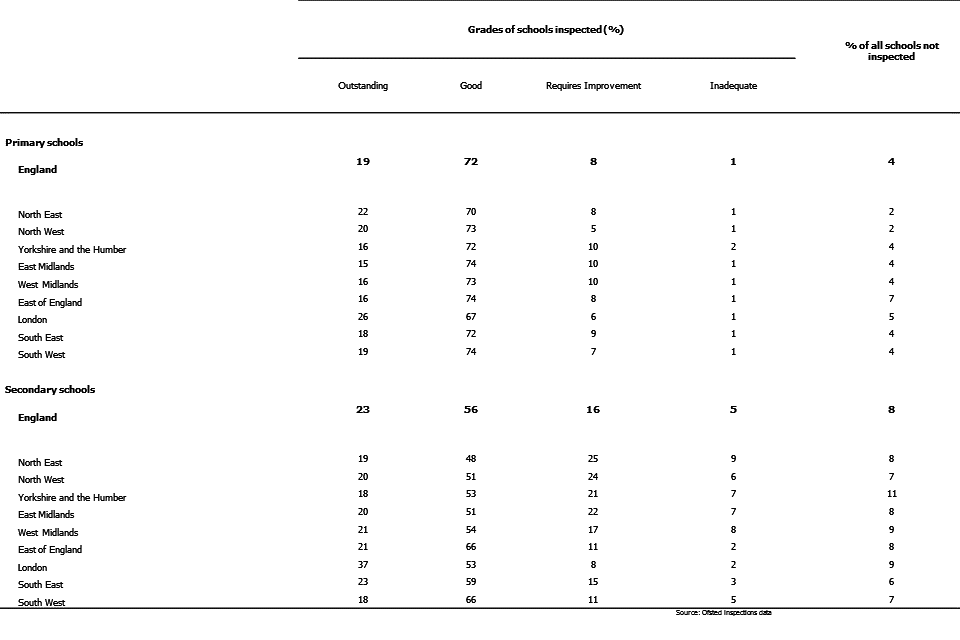
Table 1
3. Revisions to previous release
Provisional data indicated that there were 2,401 section 5 inspections between 1 September 2015 and 31 August 2016, as published by 30 September 2016. Revised data shows that an additional 14 inspections took place where the report was published too late for inclusion in the provisional data. Eight were inspections of primary schools and six of secondary schools.
Nine of these 14 inspections resulted in an inadequate judgement. Inspections leading to an inadequate judgement undergo additional moderation and are sometimes published slightly later than reports for schools with other overall effectiveness grades. See the methodology and quality report for more details.
The addition of these inspection outcomes reduces the percentage of good or better secondary schools for 2015/16 by one percentage point to 46%, and increases the percentage of inadequate secondary schools to 15%.
Further details can be found in the revised table 2 of the charts and tables file.
4. Notes
Data in this release is from inspections undertaken between 1 September 2016 and 31 December 2016 and most recent inspections of open schools at 31 December 2016, where the inspection report was published by 31 January April 2017. If an inspection report is not published by 31 January 2017 then the previous inspection, where available, will be reported as a school’s most recent inspection.
Inspections are conducted under sections 5 and 8 of the Education Act 2005. Under exceptional circumstances Ofsted may withhold publication of an inspection report.
An explanation of the key uses of this data and further contextual information and the arrangements for quality assurance is provided in the accompanying quality and methodology report. The quality and methodology report can be found at the following webpage: www.gov.uk/government/collections/maintained-schools-and-academies-inspections-and-outcomes-official-statistics under the heading ‘inspections and outcomes’. This report also provides information about strengths and limitations of the statistics.
Glossary
A full glossary of terms can be found at the back of the word and pdf version of this release.
If you have any comments or feedback on this publication, please contact Louise Butler on 03000 131 457 or Louise.Butler@ofsted.gov.uk
-
Short inspections that did not convert are included as schools that remained at their previous grade. ↩
-
The deprivation quintile is based on the Income Deprivation Affecting Children Index (IDACI) score for each school. The score for each school is derived from the home post codes of the pupils that attend the school. ↩
-
The schools are Ashmole Primary School (URN 100556) and Herbert Morrison Primary School (URN 100604). ↩
-
Analysis compares schools judged to require improvement at their last two consecutive inspections against those only judged to require improvement at their last previous inspection. Inspections which resulted in a judgement of satisfactory are not included. If a local authority that required improvement closed to become a sponsor led academy it is treated as a new school, so does not carry over its inspection history. ↩
-
Concerns can include concerns about the performance of the school, or complaints made against the school. Outstanding nursery schools, special schools and pupil referral units are not exempt from routine inspection, and are inspected every three years. ↩
-
Analysis is based on inspections conducted since 31/12/2011 (within five years) and on or before 31/12/06 (10 years ago or longer). ↩
-
The percentages of schools at each grade are based on inspected schools only. The percentage not inspected is based on all schools currently operating. ↩