Local authority collected waste management - annual results 2021/22
Updated 14 April 2023
Applies to England

© Crown copyright 2023
This publication is licensed under the terms of the Open Government Licence v3.0 except where otherwise stated. To view this licence, visit nationalarchives.gov.uk/doc/open-government-licence/version/3 or write to the Information Policy Team, The National Archives, Kew, London TW9 4DU, or email: psi@nationalarchives.gov.uk.
Where we have identified any third party copyright information you will need to obtain permission from the copyright holders concerned.
This publication is available at https://www.gov.uk/government/statistics/local-authority-collected-waste-management-annual-results-202122/local-authority-collected-waste-management-annual-results-202122
This release relates to the collection and management of waste under the possession or control of local authorities in England. It covers three principal measures as summarised in the table below.
The next update to this National statistics notice and accompanying datasets is scheduled to be in November/December 2023.
What data is confirmed in this release?
| Measure | Time period |
|---|---|
| Waste from Households – This is the official recycling measure that is used as the basis for reporting at a harmonised UK level. | First publication of figures for the 2021 calendar year and for the 2021/22 financial year. |
| Local authority collected waste – This is all waste within the remit of local authorities. It includes household waste plus other non-household waste collected by local authorities. | First publication of figures for the 2021/22 financial year. |
| Household waste – This is broader than ‘waste from households’, and includes waste from street bins, street sweepings, and parks and grounds. It does not include metals from incinerator bottom ash. | First publication of figures for the 2021/22 financial year. |
For more information about what data is included in the three measures listed in the table above, please refer to the section on Glossary of terms and measures and the separate methodology document. A reference document giving an explanation of what recycling is and comparing measures across England, Wales, Scotland and Northern Ireland is available.
Datasets for the national and regional data, as well as data at local authority level—including the ex-National Indicator measures—are available at the gov.uk website
1. Key points
The changes detailed below are based on unrounded figures.
England Waste from Households: 2021 and 2021/22
- The official England ‘waste from households’ recycling rate was 44.1 per cent in 2021, up 0.1 percentage points from 44.0 per cent in 2020.
- Metal recovered and then recycled from waste that has been through incineration (IBA metal) added approximately 1.0 percentage points to the recycling rate in 2021, this was unchanged from 2020.
- In 2021, total ‘waste from households’ increased to 23.1 million tonnes from 2020 when it was 22.6 million tonnes. This is equivalent to 409 kg per person, up from 399 kg per person in 2020, an increase of 2.4 per cent.
- The amount of residual waste treated was 12.8 million tonnes, up from 12.6 million tonnes in 2020, an increase of 2.0 per cent.
- The total amount of waste recycled increased. In 2021, it was 10.2 million tonnes, up from 9.9 million tonnes in 2020. This was an increase of 2.7 per cent.
- The amount of dry material recycled in 2021 was 6.0 million tonnes up by 0.1 million tonnes from 2020, an increase of 1.7 per cent.
- The tonnage of separately collected food waste sent for recycling was 512 thousand tonnes, an increase of 5.7 per cent from 485 thousand tonnes in 2020.
- ‘Other organic’ waste sent for recycling was 3.7 million tonnes, an increase of 139 thousand tonnes or 3.9 per cent on 2020.
- The rolling 12-month ‘waste from households’ recycling rate was 44.1 per cent at the end of March 2022. This is an increase of 0.3 percentage points compared with the previous 12-month period. This figure includes IBA metal.
England Local Authority and Household Waste: 2021/22 financial year
- In 2021/22, total local authority managed waste increased by 0.9 per cent to 26.1 million tonnes.
- 8.1 per cent of all local authority waste (2.1 million tonnes) was disposed of via landfill in 2021/22. This was up by 0.1 million tonnes (4.6 per cent) from 2020/21.
- Waste sent for incineration decreased by 0.1 million tonnes (0.6 per cent) to 12.4 million tonnes in 2021/22 compared to 2020/21. It was the disposal method used for 47.4 per cent of all local authority waste.
- There are no changes to definitions or methodology for all local authority and ‘household waste’ recycling figures; IBA metal is not included.
- 10.8 million tonnes of local authority waste was sent for recycling in 2021/22, an increase of 0.1 million tonnes (1.2 per cent) on 2020/21.
- Amongst the 333 local authorities in England, there is considerable variation in ‘household waste’ recycling rates, ranging from 17.7 to 63.5 per cent in 2021/22.
1.1 Data Revisions
There are no revisions to historic data presented in this notice.
2. Coronavirus (COVID-19): The impact of the pandemic on local authority waste collection and services
The latest figures shown in this publication include the period from April 2021 to March 2022.
The COVID-19 pandemic, which commenced in March 2020, caused widespread disruption to local authority waste collection services, with services heavily disrupted during April to June 2020.
Some local authorities were unable to maintain collections of dry recyclate, some garden waste collections were suspended and there was widespread closure of household waste recycling centres (HWRC). This disruption was due to staff shortages and the introduction of changes to working practice. The national lockdown and rules for the operation of some commercial enterprises had a significant impact on the generation of waste during this period.
Lockdown restrictions eased through the summer and into the autumn of 2020. Local authorities and businesses acclimatised to working under lockdown and the COVID-19 pandemic, and as a result there was less disruption to waste collection operations during the remainder of 2020. Notably the second national lockdown commencing in November 2020 had less of an impact on waste and recycling tonnages reported in these statistics. During 2021 lockdown restrictions were eased and despite further waves of infection there was less disruption to waste services.
The tables and charts below show quarterly collection tonnages for selected waste streams. They do not include the tonnages of all waste sources and will not sum to the overall tonnages in the other sections of this statistical notice and datasets.
A timeline of the COVID-19 pandemic in England for March 2020 to December 2021 is available.
2.1 The impact of the COVID-19 pandemic and lockdown on household waste arisings collected at the kerbside
Figure 1: Quarterly kerbside collections from household by waste stream April 2018 to March 2022
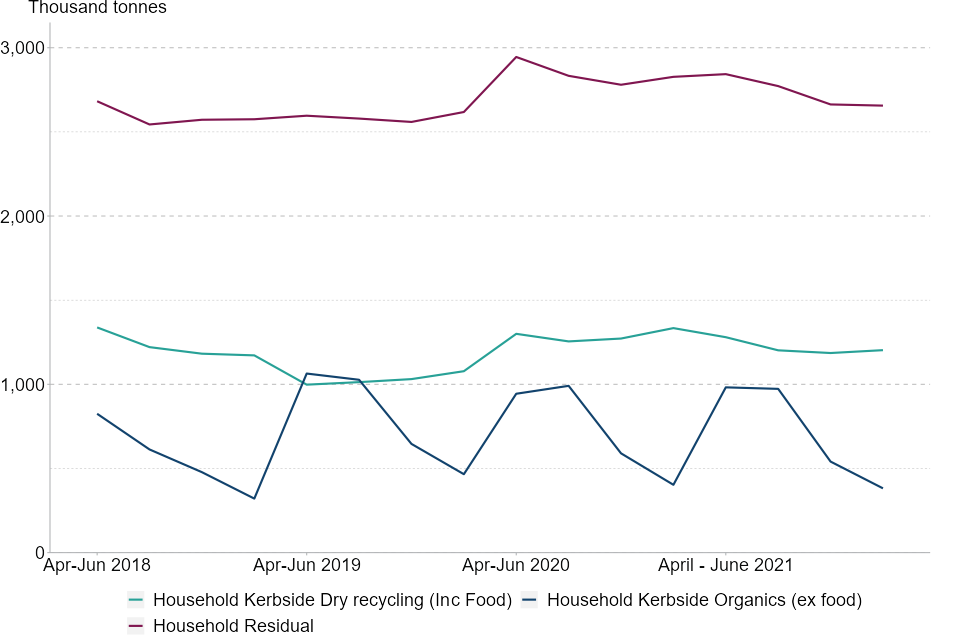
In 2021/22, household arisings decreased from the high levels seen under the national lockdowns during the COVID-19 pandemic in 2020/21.
Download the data for this chart
- In 2021/22, household arisings decreased from the high levels seen under the national lockdowns during the COVID-19 pandemic in 2020/21. This was only a partial reversal of the increase during the first year of the pandemic and tonnages remained above those seen in 2019/20.
- Figure 1 above shows the decreases in 2021/22 in the quantity of waste collected kerbside from households. Residual waste decreased by 4 per cent in 2021/22 compared to 2020/21, and dry recycling decreased by 6 per cent. Organics collected kerbside from households were 2 per cent lower over the year. It should be noted that tonnages of organics can vary considerably from year to year according to climatic conditions affecting plant growth.
2.2 The impact of the COVID-19 pandemic and lockdown on household waste collected at the kerbside
Figure 2: Quarterly tonnages of household waste deposited at HWRC during April 2018 to March 2022
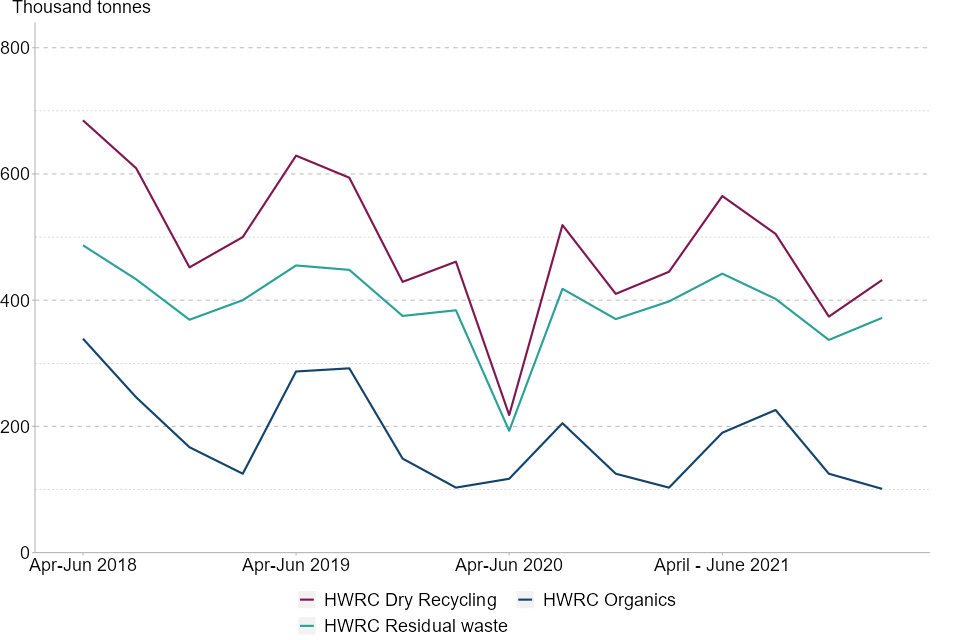
HWRC household residual waste increased by 13% in 2021/22, while HWRC dry recycling and organics increased by 18 % and 17% respectively.
Download the data for this chart
Figure 2 shows the impact of widespread HWRC closures in response to the COVID-19 pandemic in 2020.
- In 2021/22, HWRC household residual waste increased by 13 per cent compared to 2020/21, while HWRC dry recycling and organics increased by 18 per cent and 17 per cent respectively. These increases are a result of a more “normal” service during April to June 2021, compared to HWRC closures of the previous year.
- Despite the increase in April to June 2021, waste tonnages deposited at HWRC were lower than the pre pandemic levels of 2019/20.
- In 2021/22 the tonnage of residual household waste collected kerbside or deposited at HWRC decreased by 2.2% compared to 2020/21.
Figure 3: Other residual waste streams collected by local authorities, April 2018 to March 2022
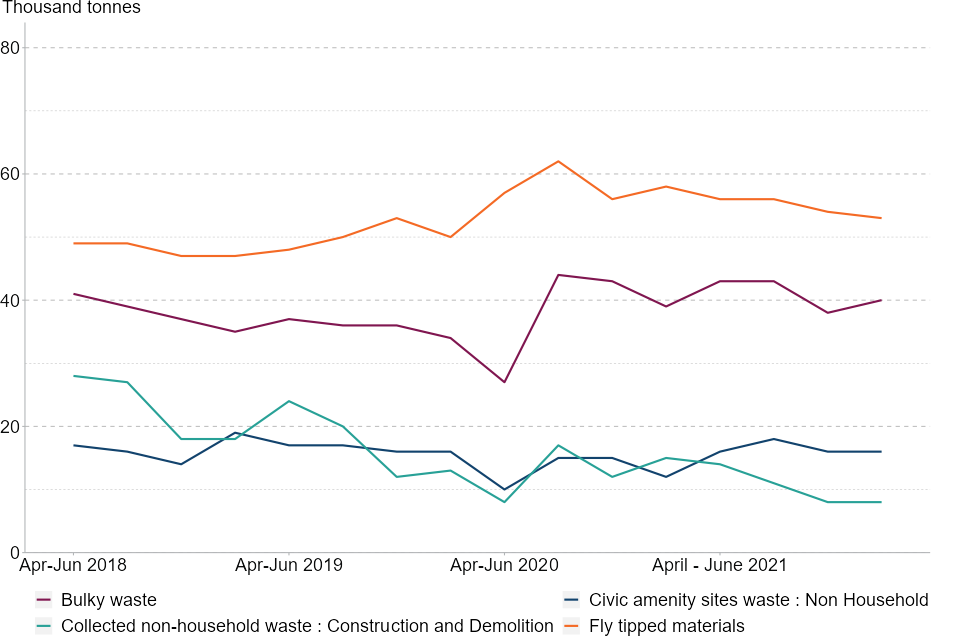
Bulky waste collected from households increased by 7% in 2021/22. Tonnages of Fly-tipped waste are 6 % lower than in 2020/21.
Download the data for this chart
Figure 3 shows other significant residual waste stream types reported by local authorities.
- Bulky waste collected from households increased by 7.0 per cent in 2021/22. This increase is mainly due to the impact of the pandemic affecting local authority services in April to June 2020. Since July to Sept 2020 bulky waste tonnages have remained higher than in pre pandemic 2019/20.
- Tonnages of Fly-tipped waste have decreased in each quarter of 2021/22 and overall are 6 per cent lower than in 2020/21.
3. Waste from Households
3.1 Waste from Households (Table 1)
‘Waste from households’ is the measure introduced by the UK in 2014 to provide a harmonised UK indicator for reporting recycling rates at a UK level. It excludes local authority collected waste not considered to have come directly from households, such as street bins, street sweepings, parks and grounds waste, and compost-like output.
For more information, refer to the Data and Methodology section of this notice.
Table 1: Composition breakdown and recycling rate of ‘waste from households’ in England, 2017 to 2021, (thousand tonnes)
| Waste type | 2017 | 2018 | 2019 | 2020 | 2021 | % change 2021 over 2020 |
|---|---|---|---|---|---|---|
| Total Recycling of which: | 10,139 | 9,840 | 10,054 | 9,931 | 10,200 | 2.7% |
| — Dry recycling of which: | 5,917 | 5,866 | 5,874 | 5,867 | 5,969 | 1.7% |
| —— IBA Metal | 181 | 187 | 201 | 222 | 228 | 2.6% |
| — Separately collected food waste | 386 | 414 | 437 | 485 | 512 | 5.7% |
| — Other organics recycling | 3,836 | 3,561 | 3,743 | 3,579 | 3,718 | 3.9% |
| Total Residual | 12,266 | 12,151 | 11,967 | 12,574 | 12,824 | 2.0% |
| Total waste from Households | 22,437 | 22,033 | 22,074 | 22,586 | 23,120 | 2.4% |
| Waste from households recycling rate (including IBA metal) | 45.2% | 44.7% | 45.5% | 44.0% | 44.1% | 0.1 percentage points |
| Waste from households recycling rate (excluding IBA metal) | 44.4% | 43.8% | 44.6% | 43.0% | 43.1% | 0.1 percentage points |
Notes - Table 1
Total recycling is calculated from disposal tonnages sent to reprocessors as reported in WasteDataFlow. The processing of collected waste and recycling, stockpiling, process loss and transfer means that there are inevitably differences between collected and disposal tonnages reported by local authorities. Where information on some secondary waste treatments of smaller waste tonnages are not available these may not appear in disposal tonnages in this table. For these reasons Total Recycling and Total Residual Waste will not sum to Total Waste from Households. Subtotals in the table may not add due to rounding.
Total waste from households is calculated from collection tonnages reported in WasteDataFlow. It includes dry recycling/preparing for reuse and organics, and residual waste (or ‘black bag’ waste) and rejects from recycling. It excludes collected tonnages of plasterboard, rubble, or soil. IBA metal is included in the recycling figures.
Download the data for this table
- In 2021, the total weight of ‘waste from households’ in England was 23.1 million tonnes, up from 22.6 million tonnes in 2020.
- The weight of waste sent for recycling was 10.2 million tonnes in 2021, a 2.7 per cent increase from 9.9 million tonnes in 2020.
- Residual waste was 12.8 million tonnes in 2021, up from 12.6 million tonnes in 2020. This was an increase of 2.0 per cent.
- The ‘waste from households’ recycling rate was 44.1 per cent in 2021, an increase of 0.1 percentage points from 2020 when the rate was 44.0 per cent.
- Other organics make a significant contribution to the overall recycling rate. In 2020 service disruptions to collections and HWRC closures impacted the tonnage collected. In 2021 the tonnage of ‘other organics’ increased by 0.1 million to 3.7 million tonnes, 3.9 per cent higher than in 2020.
- Metals recovered from incinerated waste and then recycled (IBA metal) contributed 228 thousand tonnes, up from 222 thousand tonnes in 2020. This was an increase of 2.6 per cent.
- When IBA metal is excluded, the ‘waste from households’ recycling rate was 43.1 per cent in 2021, an increase of 0.1 percentage points from the 2020 rate of 43.0 per cent.
3.2 Waste from Households: Waste Streams (Figures 4 to 7)
Figure 4: Waste composition: Waste stream proportions as a percentage of total ‘waste from households’, 2017-2021, England
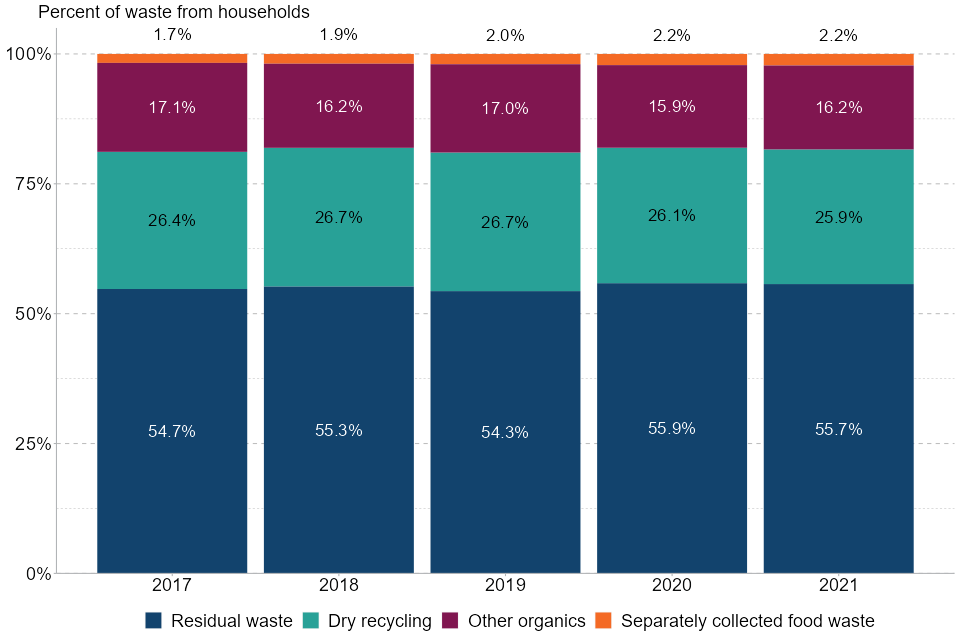
In 2021, 2.2% was separately collected food waste, 16.2% was other organics, 25.9% was dry recycling, and 55.7% was residual waste.
Notes - Figure 4
Residual waste includes residual ‘waste from households’ regular collections (black bags), bulky waste, residual waste from civic amenity centres, and rejects from recycling. It excludes waste diverted for recycling from residual waste.
Dry recycling includes paper and card, glass, plastic, waste electrical and electronic equipment (WEEE), scrap metals including those reclaimed from incinerator bottom ash as well as other materials.
Other organics includes green garden waste, mixed garden and food waste, wood for composting and other compostable waste.
Percentages may not add to exactly 100. This is due to rounding.
Download the data for this chart
- A total of 23.1 million tonnes of ‘waste from households’ was treated in England in 2021. Of this, 55.7 per cent was residual waste, 25.9 per cent was dry recycling, 16.2 per cent was ‘other organics’ (including green garden waste and mixed garden and food waste) and 2.2 per cent was separately collected food waste.
- The majority (58.5 per cent) of ‘waste from households’ recycling in 2021 was dry recyclate.
- The tonnage of dry recycling, which includes paper and card, glass, plastic, waste electrical and electronic equipment (WEEE), and scrap metals including those reclaimed from incinerator bottom ash, as well as other materials increased to 6.0 million tonnes in 2021. As a proportion of total ‘waste from households’ it was 25.9 per cent in 2021.
- Separately collected food waste rose by 5.7 per cent to 512 thousand tonnes in 2021 from 485 thousand tonnes in 2020. However, it remained only a small proportion of total ‘waste from households’ recycling at 5.0 per cent, up 0.1 percentage points from 2020. Whilst small this continues the longer trend for incremental increases each year, from 1.3 per cent in 2010.
- The tonnage of ‘other organic’ waste (including garden waste, mixed garden and food waste, wood for composting and other compostable waste) increased by 0.1 million tonnes or 3.9 per cent to 3.7 million tonnes in 2021. “Other organics accounted for 36.5 per cent of total ‘waste from households’ recycling, 0.5 percentage points higher than in 2020.
- Organic waste tonnages are variable, linked to the season, weather and plant growing conditions. However, in 2020 the main impact on organic tonnages is likely to have been as a result of the COVID-19 pandemic and lockdown.
Figure 5 shows quarterly changes in the tonnage of total recycling for ‘waste from households’ in England between 2020 and 2021.
Figure 5: Quarterly year on year change in weight of recycled ‘waste from households’, 2021 compared to 2020, England
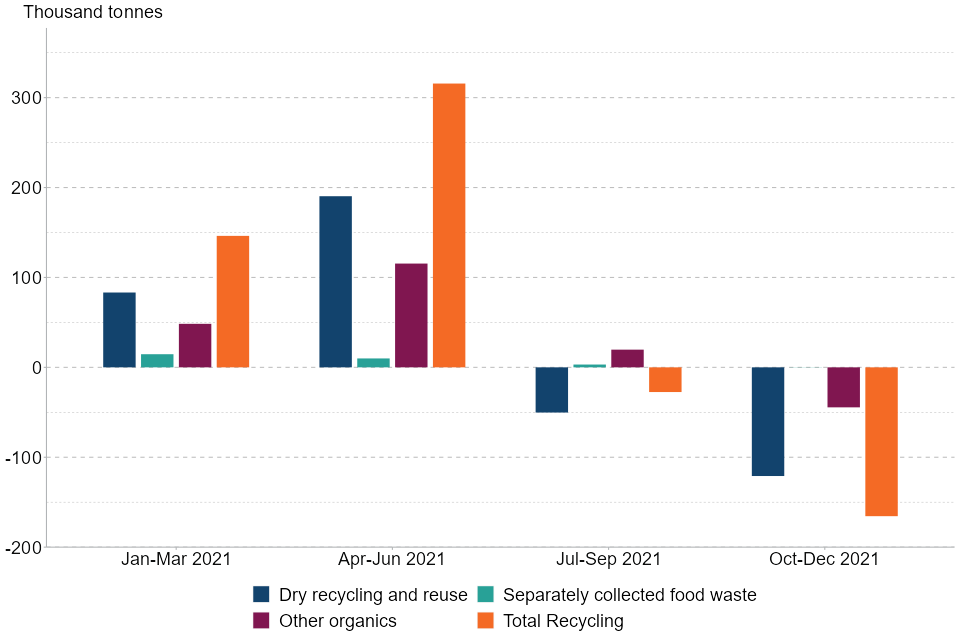
Tonnages of dry recycling decreased from the levels seen in 2020, by 3.3% July to September 2021 and 8.1 % in October to December 2021.
Download the data for this chart
- Comparative to the same period in 2020 there was a modest increase in each of the recycling streams in Jan-Mar 2021. Dry recycling and reuse were 5.6 per cent higher, separately collected food waste was 12 per cent higher and “other organic” was 9.8 per cent higher.
- In April to June 2021 tonnages of waste collected for recycling were much higher than in April to June 2020 when the COVID-19 pandemic caused disruption to dry recycling and organics collections and temporarily closed HWRCs. Dry recycling and reuse was 14 per cent higher in April to June 2021, separately collected food waste was 8.2 cent higher and “other organic” was 11 per cent higher.
- In the second half of 2021, the improving pandemic situation and less time spent at home saw tonnages of dry recycling decrease from the levels seen in 2020, by 3.3 per cent in July to September 2021 and 8.1 per cent in October to December 2021. “Other organics” were 1.6 per cent higher in July to September 2021 before falling by 5.8 per cent in October to December 2021. Separately collected food waste was 2.6 per cent higher in July to September 2021, before decreasing by 0.1 per cent in October to December 2021.
Quarterly trends over a longer time period from January to March 2017, are shown in Figures 6 and 7, which incorporate the data for the latest available quarter, January to March 2022, as well.
Figure 6: ‘Waste from households’ quarterly recycling volumes by waste type, England, with 12 month moving averages, January–March 2017 to January–March 2022
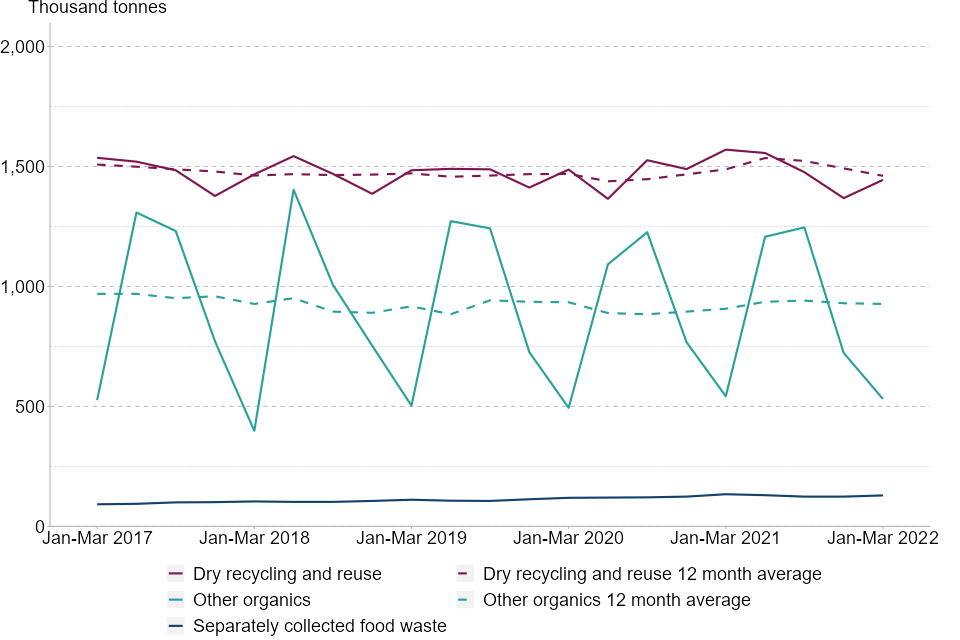
It shows seasonal variations in other organic waste--high in summer and low in winter--and a much steadier line for food collection.
Notes - Figure 6
Dry recycling includes paper and card, glass, plastic, waste electrical and electronic equipment (WEEE), scrap metals including those reclaimed from incinerator bottom ash as well as other materials.
Other organics includes green garden waste, mixed garden and food waste, wood for composting and other compostable waste.
Download the data for this chart
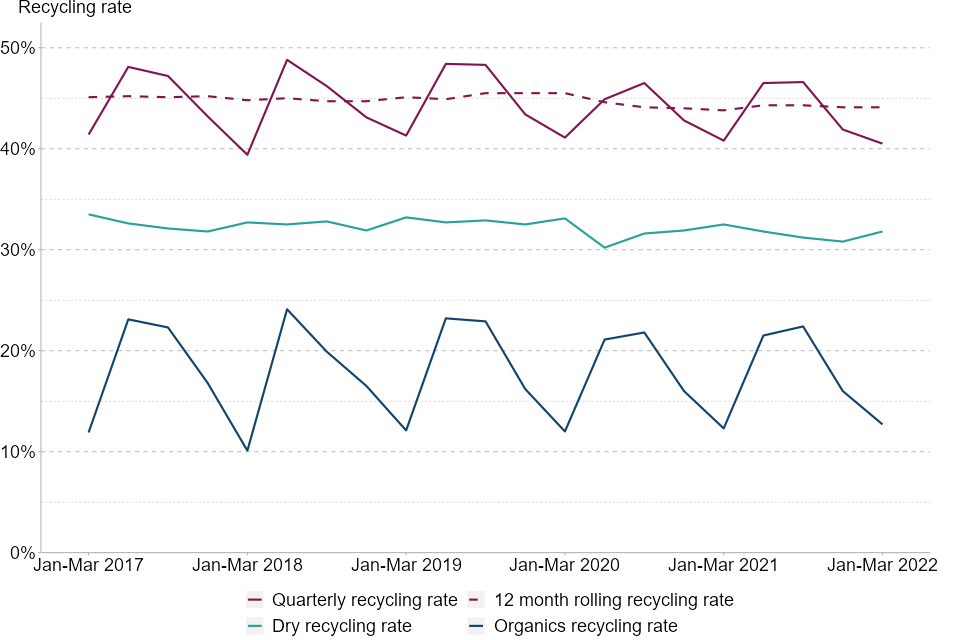
Figure 7 shows quarterly dry and organic recycling as a proportion of total ‘waste from households’ and a smoothed 12-month rolling average for the overall recycling rate.
The smoothed 12-month rolling average ‘waste from households’ recycling rate has ranged from 43.8 to 45.5 per cent over this time period.
Figure 7: ‘Waste from households’ quarterly recycling rate, England, January–March 2017 to January–March 2022
The smoothed 12-month rolling average ‘waste from households’ recycling rate has ranged from 43.8% to 45.5% over this time period.
Notes - Figure 7
Recycling is ‘recycling, composting and anaerobic digestion, and preparing for reuse.
Download the data for this chart
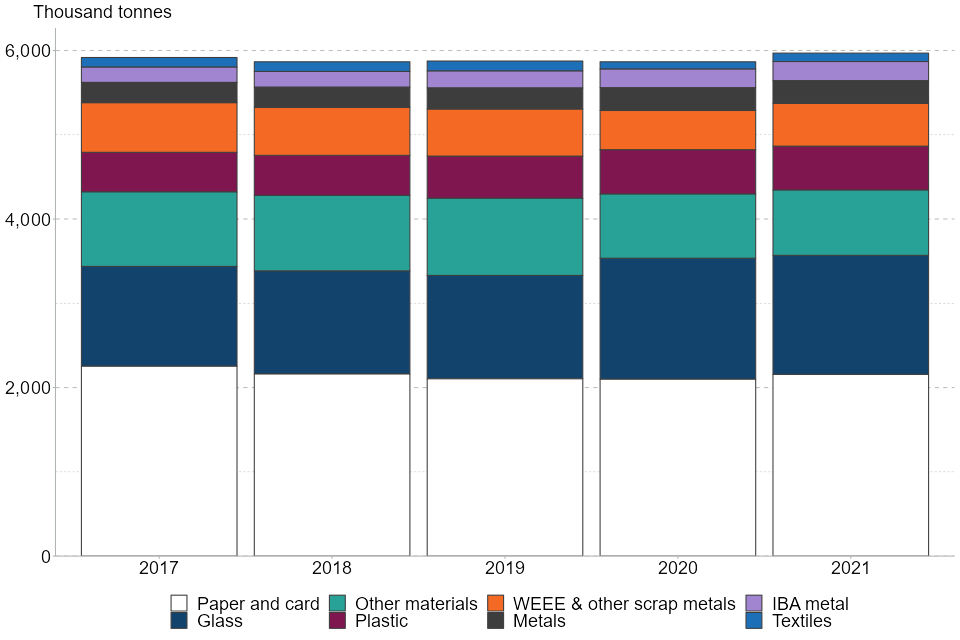
3.3 Waste from Households: Dry Recycling Composition (Figure 8 and Table 2)
- Dry recycling including IBA metals increased by 0.1 million to 6.0 million tonnes in 2021. It made up 25.9 per cent of total ‘waste from households’ and 58.5 per cent of all ‘waste from households’ recycling.
- Glass decreased by 24 thousand tonnes (-1.6 per cent) in 2021. Plastics decreased by 5 thousand tonnes (-1.0 per cent), metals decreased by 2 thousand tonnes (-0.7 per cent),
- Paper and card increased by 57 thousand tonnes (2.7 per cent). Textiles increased by 13 thousand tonnes (11 per cent), and metals from IBA increased by 6 thousand tonnes (2.9 per cent).
- WEEE increased by 43 thousand tonnes (7.1 per cent).
- Other materials increased by 14 thousand tonnes (1.5 per cent).
Figure 8: ‘Waste from households’ dry recycling composition, England, 2017 to 2021
The smoothed 12-month rolling average ‘waste from households’ recycling rate has ranged from 43.8% to 45.5% over this time period.
Notes - Figure 8
Other materials includes batteries (both automotive and post-consumer), bric-a-brac, chipboard and MDF, composite food and beverage cartons, composite wood materials, fire extinguishers, furniture, ink and toner cartridges, mattresses, mineral oil, paint, tyres (car, large vehicle, van and mixed tyres), vegetable oil, video tapes, DVDs and CDs, wood, and other.
Download the data for this chart
The relative proportions of the materials that made up dry recycling in 2019, 2020 and 2021, are shown in Table 2
Table 2: ‘Waste from households’ dry recycling composition by percentage proportion in England, 2019 to 2021
| Recyclate | 2019 | 2020 | 2021 | Percentage point change 2020 to 2021 |
|---|---|---|---|---|
| Paper and card | 35.8% | 35.8% | 36.1% | 0.3% |
| Glass | 20.9% | 24.5% | 23.7% | -0.8% |
| Other materials | 15.6% | 13.0% | 13.0% | 0.0% |
| WEEE & other scrap metals | 9.5% | 7.9% | 8.5% | 0.6% |
| Plastic | 8.5% | 9.0% | 8.7% | -0.2% |
| Metals | 4.2% | 4.6% | 4.5% | -0.1% |
| IBA metal | 3.4% | 3.8% | 3.8% | 0.0% |
| Textiles | 2.0% | 1.5% | 1.7% | 0.2% |
| Total | 100.0% | 100.0% | 100.0% | 0.0% |
Download the data for this table
- Despite some variations in tonnages, the relative proportions of materials had not substantially changed up to 2020.
- The COVID-19 pandemic had various impacts on waste services, waste collection and arisings. Whilst the overall effect of this on the total dry recycling total tonnage was small the relative proportions of each material type changed in 2020.
- Some effects of the pandemic continued in 2021, but without the widespread disruption to collection services and HWRC closures seen in 2020. This allowed tonnages of WEEE and textiles to partially recover, and with less time being spent at home the tonnage of glass was lower.
- The relative proportions of paper and card, WEEE & Other scrap metal and textiles all increased in 2021.
- The relative proportions of glass and plastic and metals decreased in 2021.
- The proportion of IBA metal was 3.8 per cent in 2021, an increase of 2.1 percentage points since 2015— the first year that data was available when it comprised 1.7 per cent of dry recycling.
4. Waste from Households – Financial Year Figures
- In 2021/22, the total weight of ‘waste from households’ in England decreased to 22.8 million tonnes down 0.8 per cent from 23.0 million tonnes in 2020/21.
- The amount of ‘waste from households’ sent to recycling in 2021/22 remained at 10.1 million tonnes down just 0.2 per cent from 2020/21.
- The ‘waste from households’ recycling rate was 44.1 per cent in 2021/22, an increase of 0.3 percentage points on the 2020/21 recycling rate, which was 43.8 per cent.
- Dry recycling was 5.8 million tonnes in 2021/22, decreasing by 1.8 per cent from 6.0 million in 2020/21. Organic recycling increased by 2.1 per cent to 4.2 million tonnes. This increase reflecting more normal kerbside and HWRC services compared to the lockdown disruptions of 2020/21.
- The tonnage of residual waste in 2021/22 was 1.4 per cent lower than in 2020/21, down 0.2 million to 12.6 million tonnes. As a proportion of ‘waste from households’, it decreased by 0.4 percentage points to 55.4 per cent of the total.
5. Management of All Local Authority Collected Waste, 2021/22 (Table 3 and Figure 9)
Local authority collected waste consists of all ‘waste from households’, street sweepings, municipal parks and gardens waste, beach cleansing waste, and waste resulting from the clearance of fly-tipped materials plus some commercial and/or industrial waste. For further detail, see Annex 1 of “Local authority waste statistics – Recycling measures” on gov.uk.
As a result of changes in reporting through Q100, it is not appropriate when referring to the management of waste for landfill, incineration or recovery to compare the data for April 2015 onwards too closely to any of the previous annual data. In particular, Q100 allows for more extensive reporting of refuse derived fuel (RDF), incineration, and outputs from incineration.
- Total local authority managed waste in 2021/22 was 26.1 million tonnes, up by 232 thousand tonnes (0.9 per cent) from 2020/21.
- 8.1 per cent of all local authority collected waste was sent to landfill in 2021/22. This was a total of 2.1 million tonnes, 0.1 million tonnes higher (an increase of 4.6 per cent) than in 2020/21. This increase in landfill reflects higher residual waste generation and some waste being diverted to landfill, due to temporarily lower capacity in the Energy from Waste sector.
- 80.1 per cent (1.7 million tonnes) of waste sent to landfill was sent direct in 2021/22. This is an increase from 2020/21, when 76.2 per cent of all local authority collected waste was sent direct to landfill.
- 47.4 per cent of all local authority waste was incinerated in 2021/22. This was a total of 12.4 million tonnes, and a decrease of 0.1 million tonnes (0.6 per cent) from 2020/21. This decrease reflecting a tightening of capacity in the sector due to temporary shutdown of EfW facilities in certain areas and the commissioning of a new site.
- 70.2 per cent (8.7 million tonnes) of waste sent to incineration was sent direct in 2021/22. This proportion is higher than in 2020/21 when 68.6 per cent (8.6 million tonnes) of local authority collected waste was sent direct to incineration.
- The amount of local authority collected waste sent for recycling in 2021/22 was 10.8 million tonnes, up 0.1 million tonnes from 2020/21. Waste sent for recycling comprised 41.5 per cent of all local authority waste, an increase of 0.1 percentage points from 2020/21.
Table 3 shows the tonnage of local authority collected waste sent to landfill, incineration, or recycling for the past five years. Figure 9 shows how local authority collected waste has been managed since 2000/01.
Table 3: Management of all local authority collected waste financial year figures, England, 2017/18 to 2021/22 (thousand tonnes)
| Waste disposal method | 2017/18 | 2018/19 | 2019/20 | 2020/21 | 2021/22 | 2021/22 % change over 2020/21 |
|---|---|---|---|---|---|---|
| Landfill | 3,213 | 2,756 | 2,169 | 2,016 | 2,109 | 4.6% |
| Recycled/composted of which:- | 10,860 | 10,926 | 10,949 | 10,708 | 10,840 | 1.2% |
| — Household waste | 9,981 | 10,007 | 10,085 | 10,080 | 10,056 | -0.2% |
| — Non household waste | 879 | 919 | 864 | 627 | 784 | 25.0% |
| Total incineration of which:- | 10,846 | 11,205 | 11,633 | 12,466 | 12,393 | -0.6% |
| — Incineration with EfW | 10,632 | 11,031 | 11,448 | 12,342 | 12,294 | -0.4% |
| — Incineration without EfW1 | 214 | 174 | 185 | 124 | 99 | -20.0% |
| Other | 706 | 699 | 816 | 700 | 780 | 11.4% |
| Total local authority waste managed | 25,626 | 25,586 | 25,568 | 25,890 | 26,122 | 0.9% |
| Recycled/composted waste as percentage of total | 42.4% | 42.7% | 42.8% | 41.4% | 41.5% | 0.1 percentage points |
Notes - Table 3
Incineration with energy recovery/without energy recovery includes incineration bottom ash (IBA) and metals from IBA.
Recycling figures in this table do not include metals recovered from IBA.
Numbers may not add to exact totals. This is due to rounding.
Download the data for this table
Figure 9: Management of all local authority collected waste and recycling rates, England, 2000/01–2021/22
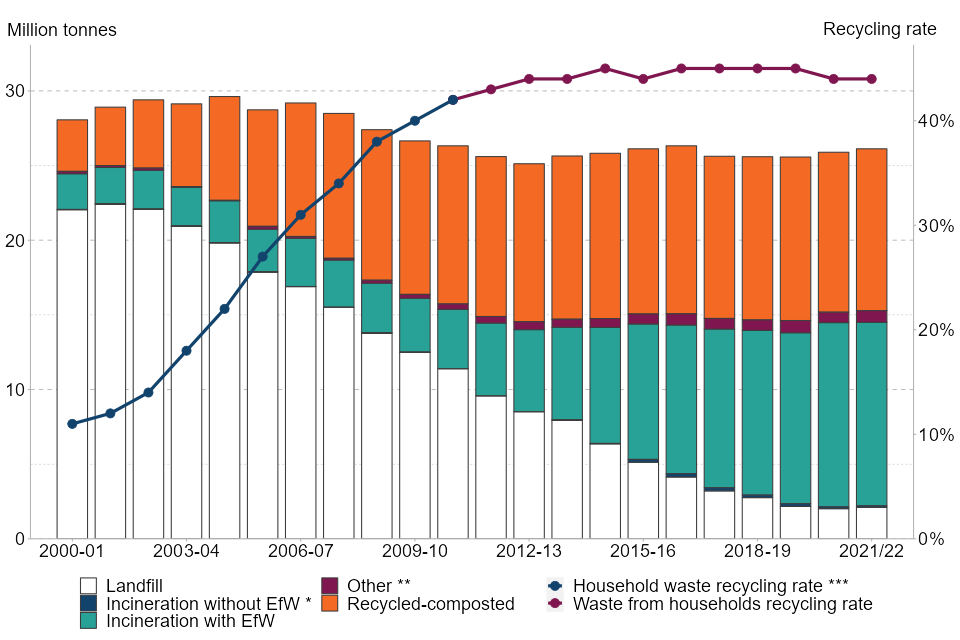
The proportion of local authority collected waste sent to landfill has decreased significantly since 2000/01.
Notes - Figure 9
* Incineration with energy recover/without energy recovery includes incinerator bottom ash (IBA) and metals from IBA. This is consistent with the existing definition for household waste recycling so is not impacted by the change in ‘waste from households’ recycling definition.
** Other includes waste treated/disposed of through other unspecified methods as well as process and moisture loss.
*** The Household waste recycling rate is based on a broader measure of waste and is not directly comparable to the ‘waste from households’ recycling rate. For further information on definitions, refer to the glossary.
IBA metals are included within the ‘waste from households’ recycling rate shown on this chart from April 2015/16 onwards but are not included in household waste recycling.
Download the data for this chart
6. England and the Regions Local Authority Collected Waste Destinations (Table 4 and Figure 10)
There are regional differences in the management of local authority collected waste, as shown in Table 4 and Figure 10.
Table 4: Management of all local authority collected waste, England by region, 2021/22 (thousand tonnes)
| Region | Landfill (thousand tonnes) | Landfill (% of total) | Incineration (thousand tonnes) | Incineration (% of total) | Recycled/Composted (thousand tonnes) | Recycled/Composted (% of total) | Other (thousand tonnes) | Other (% of total) | Total (thousand tonnes) |
|---|---|---|---|---|---|---|---|---|---|
| East Midlands | 320 | 13.5 | 959 | 40.5 | 991 | 41.9 | 97 | 4.1 | 2,367 |
| Eastern | 702 | 23.5 | 849 | 28.4 | 1,366 | 45.7 | 73 | 2.4 | 2,989 |
| London | 38 | 1.0 | 2,337 | 64.4 | 1,065 | 29.3 | 188 | 5.2 | 3,628 |
| North East | 100 | 7.6 | 751 | 56.6 | 448 | 33.8 | 27 | 2.1 | 1,327 |
| North West | 333 | 9.1 | 1,562 | 42.5 | 1,666 | 45.4 | 112 | 3.1 | 3,674 |
| South East | 203 | 4.9 | 1,917 | 46.5 | 1,888 | 45.8 | 113 | 2.8 | 4,121 |
| South West | 164 | 6.1 | 1,182 | 43.9 | 1,308 | 48.6 | 37 | 1.4 | 2,690 |
| West Midlands | 174 | 6.3 | 1,516 | 54.5 | 1,041 | 37.4 | 48 | 1.7 | 2,779 |
| Yorkshire and the Humber | 75 | 2.9 | 1,321 | 51.8 | 1,068 | 41.9 | 84 | 3.3 | 2,548 |
| England | 2,109 | 8.1 | 12,393 | 47.4 | 10,840 | 41.5 | 780 | 3.0 | 26,122 |
Notes - Table 4
Incineration includes incineration with energy recover/without energy recovery. This includes incinerator bottom ash (IBA) and metals from IBA.
Recycled/Composted refers to the proportion of all local authority collected waste sent for recycling/composting.
Other includes waste treated/disposed of through other unspecified methods as well as process and moisture loss.
Numbers may not add to exact totals. This is due to rounding.
Download the data for this table
- The South East managed the largest tonnage of local authority collected waste in 2021/22 at 4.1 million tonnes. This was 15.8 per cent of all local authority collected waste in England. The North East managed the smallest tonnage in 2021/22 at 1.3 million tonnes, or 5.1 per cent of the total for England.
- Eastern region sent the largest proportion of their total local authority collected waste to landfill at 23.5 per cent (0.7 million tonnes). London sent the smallest proportion at 1.1 per cent. At a national level, 8.1 per cent of all local authority collected waste in England was sent to landfill in 2021/22. This was 2.1 million tonnes.
- London sent the largest proportion of their total local authority collected waste to incineration in 2021/22 at 64.4 per cent (2.3 million tonnes). Eastern region sent the smallest proportion at 28.4 per cent (0.8 million tonnes). Overall, 47.4 per cent of all local authority collected waste in England was sent to incineration in 2021/22. This was 12.4 million tonnes.
- In England, 10.8 million tonnes (41.5 per cent) of local authority collected waste was sent for recycling in 2021/22. The region that sent the largest proportion of local authority collected waste to recycling was the South West, which sent 1.3 million tonnes (48.6 per cent). The region that sent the smallest proportion of waste to recycling was London, which sent 1.1 million tonnes (29.3 per cent).
Figure 10: Management of all local authority collected waste, England by region, 2021/22 (proportions of total local authority collected waste)
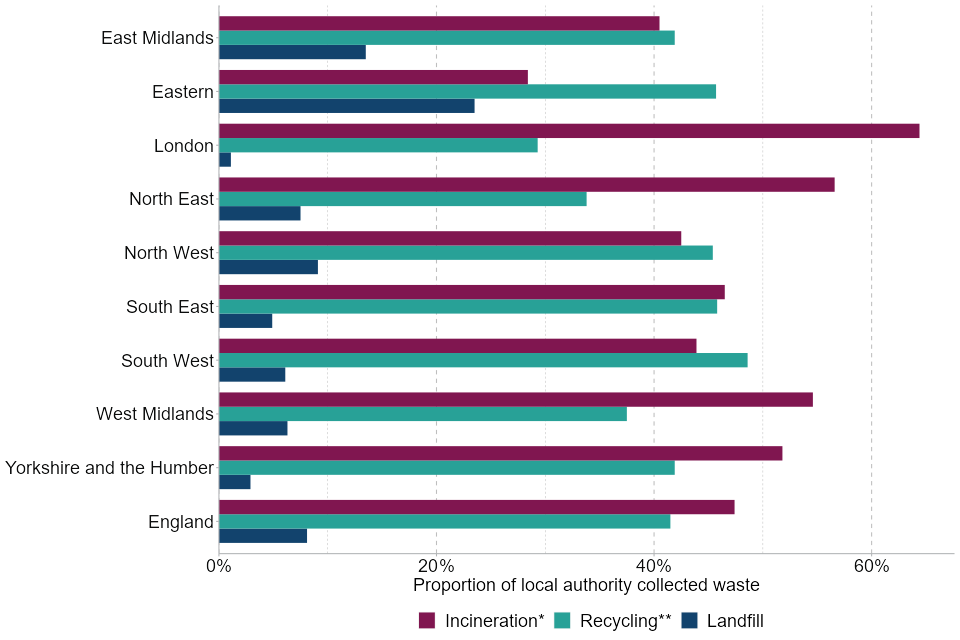
In 2021/22, the Eastern region sent the largest proportion of local authority waste to landfill. The South-West sent the largest proportion of waste to recycling.
Notes - Figure 10
* Incineration includes incineration with energy recover/without energy recovery. This includes incinerator bottom ash (IBA) and metals from IBA.
** Recycling refers to the proportion of all local authority collected waste sent for recycling, composting, anaerobic digestion or reuse.
Download the data for this chart
7. Household Waste Recycling
7.1 Household Waste Recycling Rates for England and the Regions (Figure 11)
The ‘household waste’ (ex-NI 192) measure is a broader definition of waste than the ‘waste from households’ measure. It includes street bins, street sweepings, gully-emptying, parks and grounds waste, soil, and compost-like output, as well as separately collected healthcare waste and asbestos. It does not include IBA metals.
At a regional level, there is considerable variation across authorities, influenced by how heavily populated an area is, the kind of housing present, and the level of other organic or garden waste collected. As an example, in built-up areas with a higher proportion of flats, residents may find it difficult or be unwilling to store waste for recycling; and will not be producing garden waste for collection. This will reduce recycling rates for these authorities. Similarly, authorities with higher recycling rates are likely to be advantaged by good householder response to recycling schemes and a higher tonnage of organic or garden waste being collected.
Regional differences are illustrated in Figure 11.
Figure 11: ‘Household waste’ recycling rates, England and regions, 2020/21 and 2021/22
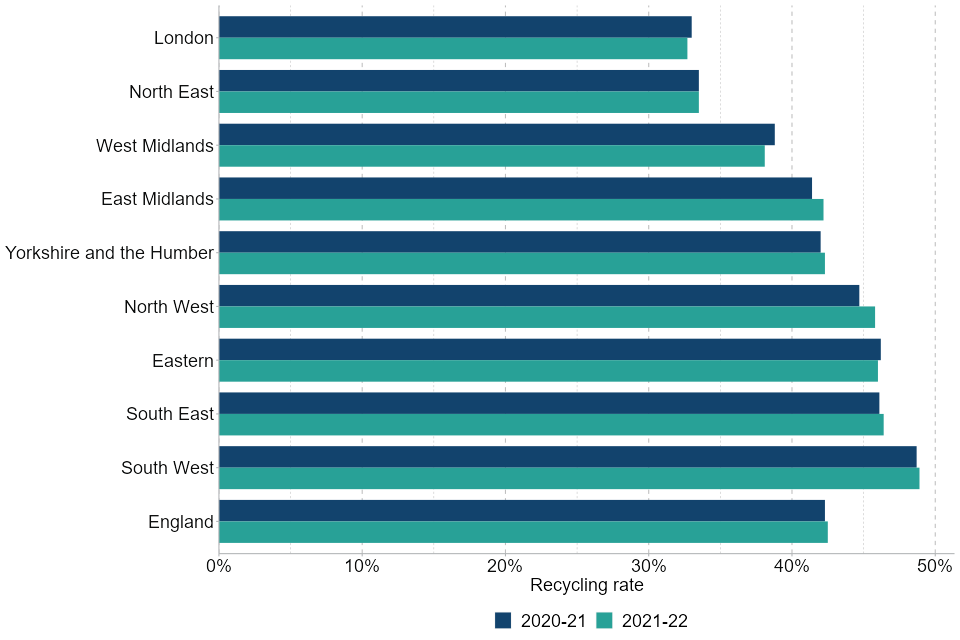
London had the lowest ‘household waste’ recycling rate in 2021/22 at 32.7%. The South-West had the highest ‘household waste’ recycling rate at 48.9% in 2021/22.
Download the data for this chart
- London had the lowest ‘household waste’ recycling rate in 2021/22 at 32.7 per cent. The region with the highest ‘household waste’ recycling rate in 2021/22 was the South West at 48.9 per cent.
- London, Eastern and West Midlands region all had decreases in their recycling rates. The largest a decrease of 0.7 percentage points in the West Midlands.
- East Midlands, North West, South East, South West, Yorkshire and Humberside all had increases in their recycling rate. The largest an increase of 1.1 percentage point in the North West.
- There was no change in the recycling rate for the North East.
7.2 Household Waste Recycling Rates for Individual Local Authorities (Table 5)
A dataset of recycling rates for all local authorities in England can be found in Table 3 of the local authority collected waste generation dataset.
- At an individual local authority level, ‘household waste’ recycling rates ranged from 17.7 per cent to 63.5 per cent in 2021/22. The overall average figure for England was 42.5 per cent, a 0.2 percentage point increase from 2020/21.
- ‘Household waste’ recycling is often similar in adjacent authorities, though there is a wide range between the highest and lowest recycling rates in all regions of England and even within a region. Figure 1 in the datasets accompanying this statistical notice shows the geographic distribution of ‘household waste’ recycling rates in 2021/22.
Table 5 shows the authorities with the highest and lowest recycling rates in each region as well as the proportion of their total recycling that consists of organic waste. Generally, an authority in which a smaller proportion of their total recycling is accounted for by organic waste will have a lower recycling rate, though this is not always the case.
Table 5: Local authorities with the highest and lowest household recycling rates in each region in 2021/22
| Region | Position | Authority | Recycling rate | Percent of total recycling that is organic |
|---|---|---|---|---|
| East Midlands | Lowest | Nottingham City Council | 25.3% | 39.0% |
| East Midlands | Highest | Derbyshire Dales District Council | 51.5% | 51.3% |
| Eastern | Lowest | Luton Borough Council | 28.6% | 23.5% |
| Eastern | Highest | Three Rivers District Council | 63.5% | 52.1% |
| London | Lowest | Tower Hamlets LB | 19.7% | 10.1% |
| London | Highest | Bromley LB | 48.7% | 50.2% |
| North East | Lowest | Stockton-on-Tees Borough Council | 25.7% | 31.5% |
| North East | Highest | Redcar and Cleveland Borough Council | 38.2% | 45.3% |
| North West | Lowest | Barrow-in-Furness Borough Council | 17.7% | 46.1% |
| North West | Highest | Stockport MBC | 60.3% | 59.7% |
| South East | Lowest | Dartford Borough Council | 24.3% | 24.9% |
| South East | Highest | South Oxfordshire District Council | 62.7% | 54.7% |
| South West | Lowest | Exeter City Council | 25.5% | 38.0% |
| South West | Highest | East Devon District Council | 61.0% | 50.6% |
| West Midlands | Lowest | Birmingham City Council | 22.8% | 30.9% |
| West Midlands | Highest | Stratford-on-Avon District Council | 55.5% | 58.0% |
| Yorkshire and Humber | Lowest | Kirklees MBC | 26.9% | 43.1% |
| Yorkshire and Humber | Highest | East Riding of Yorkshire Council | 60.1% | 53.2% |
Download the data for this table
- Across the different regions, the range (or difference) in recycling rate between the highest performing local authority and the lowest performing local authority varied between 12 and 43 percentage points.
- The region with the widest range in its recycling was the North West at 43 percentage points, followed by the South East at 38 percentage points. Eastern had a range of 35 percentage points followed by West Midlands and Yorkshire and the Humber each at 33 percentage points. London had a range of 29 percentage points. East Midlands had a range of 26 percentage points.
- The region with the smallest range in its recycling rates is the North East at 12 percentage points. This reflects the fact that the highest recycling rate in the region is relatively low at 38.2 per cent (Redcar and Cleveland Borough Council), compared to some other regions where the highest recycling rates range from between 49 and 64 percent.
- Overall, in England a total of seven authorities had ‘household waste’ recycling rates greater than 60 per cent. Seventy seven authorities had recycling rates greater than 50 per cent.
- Three Rivers District Council had the highest ‘household waste’ recycling rate in England in 2021/22 at 63.5 per cent. Organic waste made up 52.1 per cent of their total household recycling tonnage. South Oxfordshire District Council, had the second highest recycling rate at 62.7 per cent and 54.7 per cent of their recycling was organics. St Albans City and District Council had the third highest recycling rate in England at 62.4 per cent with 54.4 per cent of their recycling tonnage being organic.
- This is the second year Three Rivers District Council has had the highest ‘household waste’ recycling rate in England, having had the third highest recycling rate overall in 2020/21. South Oxfordshire District Council has been in the top three since 2010/11. St Albans City and District Council had the highest recycling rate in England in 2020/21.
- Over the last 5 years, South Oxfordshire District Council has had an average recycling rate of 63.3 per cent, Three Rivers District Council has had an average recycling rate of 63.2 per cent and St Albans City and District Council has had an average ‘household waste’ recycling rate of 62.2 per cent.
- Six authorities have similar or higher five-year average recycling rates to Three Rivers District Council. These are South Oxfordshire District Council (63.3 per cent), East riding of Yorkshire Council (62.7 per cent), Vale of White Horse District Council (62.6 per cent), St Albans City and District Council (62.2 per cent), Surrey Heath Borough Council (61.3 per cent), Rochford District Council (60.7 per cent).
- In 2021/22, Chelmsford Borough Council had the highest proportion of organic/green waste comprising 77.4 per cent of their total recycled ‘household waste’. Their overall ‘household waste’ recycling rate was 41.8 per cent.
- Barrow-in-Furness Borough Council had the lowest ‘household waste’ recycling rate in England in 2021/22 at 17.7 per cent, with 46.1 per cent of the authority’s recycled ‘household waste’ being organic/green waste. The second lowest ‘household waste’ recycling rate was Tower Hamlets LB (19.7 per cent; 10.1 per cent organic), and the third lowest was Westminster City Council (20.9 per cent; 3.0 per cent organic).
7.3 Household Waste Recycling Rates Local authority performance by region (Tables 6 and 7)
Figure 2 in the datasets accompanying this statistical notice shows the geographic distribution of changes in the recycling rates in 2021/22.
Table 6 shows the number and proportion of authorities in each region showing an overall increase in their recycling rate for 2021/22 compared to 2020/21.
- In total 169 (51 per cent) of the 333 local authorities in England showed an increase in their recycling rate in 2021/22. 164 authorities (49 per cent) showed a decrease.
- London and Eastern had a fairly even split between authorities with an increase or those with a decrease. London had 49 per cent of authorities with an increase and 51 per cent with a decrease, while Eastern had 52 per cent of authorities with an increase and 48 per cent with a decrease.
- East Midlands had 59 per cent of authorities showing an increase in their recycling rates followed by the North West and North East both with 58 per cent. South East region had 57 per cent of authorities with an increase.
- South West had 38 per cent of authorities showing an increase while Yorkshire and the Humber and West Midlands were the regions with the lowest proportion of authorities showing an increase at 36 per cent.
As observed earlier in this publication recycling rates are subject to significant variation each year as a result of changes in the tonnage of organics collected and this in turn is influenced by climatic conditions, and in 2020 (and a lesser extent in 2021) the effect of the COVID-19 pandemic on waste generation, collections and HWRC opening. This should be noted particularly when considering changes of between plus and minus 1 percentage point change, where a change to the weight of organics within recycling tonnages may obscure other effects such as a change of service, or contractor.
Table 6: Recycling rates- Number of local authorities in each region with an increase in 2021/22 shown by percentage point range
| Region | Total number of authorities in region | Number of authorities with a percentage point increase of 0-1 | Number of authorities with a percentage point increase of 1-5 | Number of authorities with a percentage point increase of over 5 | Total authorities with an increase | Percentage of authorities with an increase in their recycling rate |
|---|---|---|---|---|---|---|
| East Midlands | 39 | 11 | 11 | 1 | 23 | 59% |
| Eastern | 48 | 10 | 15 | 0 | 25 | 52% |
| London | 37 | 8 | 9 | 1 | 18 | 49% |
| North East | 12 | 2 | 5 | 0 | 7 | 58% |
| North West | 43 | 7 | 12 | 6 | 25 | 58% |
| South East | 70 | 20 | 17 | 3 | 40 | 57% |
| South West | 29 | 4 | 6 | 1 | 11 | 38% |
| West Midlands | 33 | 8 | 3 | 1 | 12 | 36% |
| Yorkshire and Humber | 22 | 2 | 6 | 0 | 8 | 36% |
| Total | 333 | 72 | 84 | 13 | 169 | 51% |
Download the data for this table
- Table 6 shows that in England in 2021/22, 13 authorities (4 per cent of the total) had increases of over 5 percentage points in their recycling rate, 84 (25 per cent) increased by between 1 and 5 percentage points and that 72 (22 per cent) authorities had an increase in their recycling rate of less than 1 percentage point.
- There were 13 authorities with an increase of over 5 percentage points in their recycling rate. The top 3 largest were Reading Borough Council (South East region) which had a 15.4 percentage point increase to give a recycling rate of 51.5 per cent. Blackpool Borough Council (North West) increased by 14.2 percentage points to 41.7 per cent. Bracknell Forest Borough council (South East) increased by 12.8 percentage points to 56.2 per cent.
- The South East had 17 authorities with an increase of between 1 and 5 percentage points (24 per cent of authorities in that region), followed by Eastern with 15 authorities (31 per cent), and the North West with 12 authorities (28 per cent).
Table 7 shows the number and proportion of authorities in each region showing an overall decrease in their recycling rate for 2021/22 compared to 2020/21.
Table 7: Recycling rates - Number of local authorities in each region with a decrease in 2021/22 shown by percentage point range
| Region | Total number of authorities in region | Number of authorities with a percentage point decrease of 0-1 | Number of authorities with a percentage point decrease of 1-5 | Number of authorities with a percentage point decrease of over 5 | Total authorities with a decrease | Percentage of authorities with a decrease in their recycling rate |
|---|---|---|---|---|---|---|
| East Midlands | 39 | 7 | 9 | 0 | 16 | 41% |
| Eastern | 48 | 13 | 10 | 0 | 23 | 48% |
| London | 37 | 5 | 13 | 1 | 19 | 51% |
| North East | 12 | 1 | 4 | 0 | 5 | 42% |
| North West | 43 | 7 | 11 | 0 | 18 | 42% |
| South East | 70 | 16 | 12 | 2 | 30 | 43% |
| South West | 29 | 10 | 7 | 1 | 18 | 62% |
| West Midlands | 33 | 9 | 10 | 2 | 21 | 64% |
| Yorkshire and Humber | 22 | 8 | 6 | 0 | 14 | 64% |
| Total | 333 | 76 | 82 | 6 | 164 | 49% |
Download the data for this table
- Table 7 shows that in England in 2021/22, 6 authorities (2 per cent of the total) had a decrease of over 5 percentage points in their recycling rate, 82 (25 per cent) decreased by between 1 and 5 percentage points and 76 (23 per cent) authorities had a decrease in their recycling rate of less than 1 percentage point.
- There were 6 local authorities with decreases in their recycling rate of over 5 percentage points. The 3 authorities with the largest decreases were North Warwickshire Borough Council (West Midlands) with a decrease of 8.6 percentage points to give a recycling rate of 36.3%, South Hams District Council (South West) a decrease of 8.0 percentage points to 46.7% and Bexley LB with a decrease of 7.3 percentage points to give a recycling rate of 42.7%.
- The West Midlands and South East each had 2 authorities with a decrease of over 5 percentage points, while London and the South West each had 1 authority in this group.
- There were 82 authorities with a decrease of between 1 and 5 percentage points. The regions with the most authorities in this group were London with 13 authorities, (35 per cent of authorities in that region), South East region had 12 authorities (17 per cent), Eastern region with 10 authorities (21 per cent of authorities in that region), West Midlands region had 10 authorities (30 per cent), and East Midlands had 9 authorities (23 per cent).
8. Data and Methodology
Including information on data uses, feedback, revisions policy, methodology, glossary of terms and measures, and references. There is an accompanying methodology document for this release.
8.1 COVID-19 – The impact of the pandemic on these statistics
The latest data shown in this publication covers April 2021 to March 2022, 12 months in which the impact of the COVID-19 pandemic subsided. The lockdown restrictions of the previous 12 months eased and there was a gradual return towards normal working practices.
The 12 months from April 2020 to March 2021, were greatly affected by the COVID-19 pandemic. There were 2 national lockdowns and various levels of COVID-19 restrictions on working practices and individuals.
During the first national lockdown which commenced 23rd March 2020, some local authorities were unable to maintain collections of dry recyclates, there was suspension of garden waste collections and widespread closure of HWRCs. This was due to staff shortages and the introduction of changes to working practices. The national lockdown and rules for the operation of some commercial enterprises had a significant impact on the generation of waste during this period.
Section 1 of this publication shows analysis of quarterly waste collection figures. The period from April to June 2020 saw the biggest impact to waste collections and commercial waste as local authorities and businesses acclimatised to and became used to working under national lockdown and COVID-19 pandemic conditions. Over the course of 2021/22 waste generation by household sources reduced from the high tonnages seen in 2020/21 but remained above the pre pandemic levels.
Whilst there were some difficulties reported by local authorities e.g. obtaining data from smaller businesses e.g. such as charity shops (who provide reuse outlets for clothes etc) local authorities reported that the quality of the data was unaffected by the situation.
8.2 Data Uses
Data on waste management is used to monitor policy effectiveness and to support policy development. The underlying data held in WasteDataFlow is also used extensively by local and central government, the waste industry, and the public. Data is reported by all local authorities, often from management information supplied by their waste management contractor.
Factors affecting household waste recycling range from individual household behaviours, the advice and collection services provided by local authorities, the cost of waste treatment and disposal, and to some extent, wider issues such as the state of the economy during the COVID-19 pandemic. Some quarterly waste data shows a clear seasonal fluctuation. For example, the generation of garden waste is highly seasonal, increasing sharply and pushing up recycling rates in the spring and summer months. For this reason, comparisons should be made with the same quarter in previous years or using full 12-month periods. However, it should be remembered that in 2020/21 changes between years are obscured by the effects COVID-19, particularly in the period from April to September.
Prior to 2020/21 about 87 per cent of all waste managed by local authorities is ‘waste from households’ with the remainder coming from street cleaning, parks and grounds, business and construction. During 2020/21 this proportion rose to 90 per cent, and was 88 per cent in 2021/22. Only a small proportion of the total waste from businesses and construction are covered in these statistics, with most being managed privately.
8.3 Feedback
We welcome feedback on the data from all users, including how and why the data is used. This helps us to understand the value of the statistics to external users. Please take a minute to complete this short survey (this opens in google forms). Alternatively you can email the Waste Statistics team at WasteStatistics@defra.gov.uk
8.4 Revisions Policy
Defra will provide information about any significant revisions made to information published in this statistics release and the associated datasets. Revisions could occur for a variety of reasons, including backdating to reflect methodological improvements or the finalisation of data from third parties that was unavailable or provisional at the time of publishing. Occasionally, local authorities request revisions after this point where it is generally not possible to take the changes into account without risking the delay of publication. These typically do not have a significant impact on the headline figures, particularly at an England level.
The figures in this statistical release were extracted in February 2023 from data reported by local authorities during 2021 and 2022.
8.5 Methodology
Data from this release comes from a snapshot of the WasteDataFlow database taken in February 2023. WasteDataFlow is a UK-wide system managed by Defra in collaboration with Devolved Administration partners that is used to record the collection, treatment and disposal of local authority waste. First results using this database were produced for 2004/05 with earlier estimates of waste available from the Municipal Waste Management Surveys.
The tonnage of waste ‘sent for reuse, recycling and composting’ is that which is accepted by the re-processor. As such, it excludes any recycling rejects that occur during collection, sorting or further treatment. Waste diverted for recycling from the residual (or ‘black bag waste’) stream by further processing is included in the recycling tonnages.
8.6 Inclusion of Incinerator Bottom Ash Metal (IBA Metal) in Waste from Households Recycling
In December 2017, a change in how metal recovered and recycled after incineration of waste (IBA metal) is treated and reported for the ‘waste from households’ dataset only was introduced. The tonnage of IBA metal is now included within recycling rather than being reported as ‘recovery’. The amount varies depending on the amount of residual waste being incinerated and the metal content of the residual waste.
Inclusion of IBA metal has been facilitated through the new Q100 reporting structure for waste treatment, which all local authorities have been using since April 2015 (see below). This has provided the opportunity for more complete recording of waste treatment, including outputs from incineration. Therefore estimates were produced for 2015, but it was not possible to backdate figures in a consistent manner prior to 2015 due to changes in the question structure and reporting that were introduced from April 2015 through Q100.
The majority of local authorities are reporting this information as fully as they are able to. This methodological change for IBA metal has been applied to the ‘waste from households’ measure only. It has been applied to data from April 2015—it is not possible to apply the change to data before then as the question structure used to report waste treatment was different and, therefore, the reporting of IBA metal was not as consistent or as complete. At an overall England level, this change in methodology raised the recycling rate for 2016 by 0.7 percentage points (equivalent to 143 thousand tonnes). For 2015, the ‘waste from households’ recycling rate was increased by 0.4 percentage points (equivalent to 97 thousand tonnes). This is a slight underestimate for the impact on 2015 as data for January to March 2015 was collected using the old question structure and, as such, did not fully-capture IBA metal for this quarter; estimated to be around 23 thousand tonnes. Overall, this change in methodology results in ‘waste from household’ recycling rates being slightly higher than where IBA metal would previously have been reported as ‘recovery’.
There are no such methodological changes to the dataset for all local authority waste or ‘household waste’ recycling. There are no changes to the household (NI 192) household recycling figures that are reported for England, nor at a regional and individual local authority level where existing methodology and definitions have been retained.
8.7 Question Structure for Treatment and Disposal Questions (Q100)
“Question 100” (Q100) was introduced on a voluntary basis from April 2014, and used by all local authorities in England from April 2015. This question replaced a number of treatment questions.
Q100 provides a more flexible structure that has enabled local authorities to report a more complete and transparent representation of the more complex waste treatment practices that occur, which could not be accurately captured under the old question structure. It also provides the opportunity for local authorities to report, in more detail, the further treatment and disposal of certain waste types such as refuse-derived fuel (RDF), which would have previously been a final output. This is highly specific to the local authority and the facilities and practices used for treatment and disposal.
8.8 Data Quality Assurance
All local authorities provide data into WasteDataFlow. Several stages of data validation are carried out by the local authority submitting the data, the WasteDataFlow contractor and Defra, with input from the Environment Agency.
The WasteDataFlow contractors check each return for completeness and data consistency against key standardised validation checks. Data is checked against appropriate threshold values specified, which take into account the expected level of variance. There is an online validation process that compares the data for the current quarter against the data for the equivalent quarter in the previous year. For 2020/21 validation check thresholds were adjusted to take account of the COVID-19 pandemic, this was to try and reduce the number of queries raised with local authorities, so that they were not overwhelmed by validation queries as tonnages of different waste streams changed dramatically due to suspended waste collections, increased waste arisings at the kerbside, and large reductions in C&I wate streams.
Once the data has been validated by the contractor, further validation checks are carried out by Defra, who may also refer some to the Environment Agency on any specific data queries raised, particularly related to the appropriate recording of treatment and facility sites. The Defra checks include trend and outlier analysis on key measures at an aggregate and individual local authority level. Details of the validation process carried out by the contractor are available on the WasteDataFlow website.
The introduction of Q100 provided scope for local authorities to report more fully on the treatment and final destination of waste. This is particularly the case for incineration of waste and subsequent outputs and their final treatment and disposal. Gathering such information can be challenging, especially where waste goes through multiple different sorting and treatment processes at different facilities. In most cases, local authorities are able to supply this information, but in some cases full final destination treatment is not given or is stated as ‘unknown’. This may have a small impact on the final figures. Defra will continue to monitor this and work with local authorities to enhance data quality assurance, consistency, and completeness of reporting.
8.9 England recycling target
The Waste (Circular Economy) (Amendment) Regulations 2020 require Waste Management Plans to include measures to be taken to ensure that the preparing for reuse and the recycling of municipal waste is a minimum of 65% by weight by 2035 and to ensure the amount of municipal waste landfilled is reduced to 10% or less of the total amount of municipal waste generated (by weight) by 2035.
8.10 National Statistics Accreditation
National Statistics status means that our statistics meet the highest standards of trustworthiness, quality and public value, and it is our responsibility to maintain compliance with these standards.
In 2020 these local authority waste & recycling statistics together with those published by the devolved administrations in Northern Ireland, Wales and Scotland underwent a compliance review by the “Office for Stats Regulation” (OSR), who monitor government statistical quality.
National statistics accreditation for these statistics was maintained at this review. The OSR made a number of recommendations around the statistics and publications.
Since the review Defra has made progress in meeting the recommendations highlighted in the report. These are:
- Publication of a recycling explainer document, giving background to recycling, the different local authority measures published and how they compare across the UK.
- Improvements have been made to the layout of the waste statistics landing pages.
- User feedback on academic use of these statistics has been sought from Defra Waste & recycling working group.
- Feedback on this Statistical notice and datasets is being gathered by a linked google forms questionnaire (opens a link to google forms).
- Publication of Experimental Statistics on the carbon impact of waste from households managed by local authorities in England.
Work on remaining points made by the OSR will continue in 2023
9. Glossary of Terms and Measures
‘Waste from Households’
The ‘waste from households’ measure was introduced to statistical publications by Defra in May 2014. It is used to construct a harmonised UK indicator for reporting recycling rates at a UK level on a calendar year basis, providing comparable calculations across each of the four UK countries. ‘Waste from households’ is a narrower version of the ‘household waste’ measure that was used previously. The difference is that ‘waste from households’ excludes local authority collected waste types not considered to have come directly from households, such as street bins, street sweepings, parks and grounds waste, and compost-like output (CLO) from Mechanical Biological Treatment (MBT) plants. As explained above under ‘Methodology’ and ‘Data Notes and Development’, we have introduced a change to the ‘waste from households’ recycling calculation to now include metal recovered after incineration (IBA metal). Further information on the calculations and differences between measures has been published on the gov.uk website and is summarised in the table below.
| Recycling (including composting and reuse) | Waste from Households recycling | Household waste recycling |
|---|---|---|
| from households and other premises similar to households, CA sites, Bring banks | Y | Y |
| from street bins | N | Y |
| from household-related parks and grounds | Community skips only | Y |
| from soil | N | Y |
| from rubble and plasterboard | N | N |
| from compost-like output from MBT plant | N | Y |
| from incineration bottom ash (IBA) | N | N |
| from metal recovered and recycled from incinerator bottom ash | Y* | N |
| other, from residual streams | Y | Y |
| recycling rejects | N | N |
| Residual waste | Waste from Households recycling | Household waste recycling |
|---|---|---|
| from regular household collection | Y | Y |
| from civic amenity sites | Y | Y |
| from bulky waste | Y | Y |
| from other household waste | Y | Y |
| from street cleaning/sweeping | N | Y |
| from gully emptying | N | Y |
| from separately collected healthcare waste | N | Y |
| from asbestos waste | N | Y |
Notes
* Revised to include IBA metal in 2017 and applied to data from April 2015.
We have continued to report the ‘household waste’ recycling measure in our annual publication on a financial year basis to maintain continuity with the existing data series and in order to meet the wider needs of users. However it is no longer reported in the quarterly releases on recycling, which will report the ‘waste from households’ measure only. Full data on ‘household waste’ is available and can be downloaded on the gov.uk website.
The local authority recycling rate is based on the NI 192 National Indicator recycling calculation. The National Indicator calculation has been widely used by local authorities for many years for local strategic planning purposes, discussions with contractors and for benchmarking against other authorities and captures a broader scope of household waste than ‘waste from households’, e.g. it includes street sweepings and compost like output. This calculation will be made available as the NI 192 report on the WasteDataFlow portal and also on gov.uk website. This is reported on a financial year basis to meet the needs of local authorities.
10. Recycling rates across the United Kingdom
As detailed above the ‘Waste from households’ recycling rate provides a consistent measure across England, Wales, Scotland and Northern Ireland and allows reporting at UK level. However it should be noted that other National measures for Household recycling or recycling of all local authority collected waste differ across the devolved administrations. A document detailing these differences can be found here.
11. Useful links
Scottish Government Statistics
Northern Ireland Department of Agriculture, Environment and Rural Affairs Statistics
12. A National Statistics publication
National Statistics are produced to high professional standards set out in the National Statistics Code of Practice. They undergo regular quality assurance reviews to ensure they meet customer needs.
13. Contact details
Responsible statistician: Alex Clothier
Email: WasteStatistics@defra.gov.uk
Media enquiries: 0330 041 6560 (Defra Press Office)