Livestock populations in England at 1 June 2026
Updated 27 August 2026
Applies to England

© Crown copyright 2026
This publication is licensed under the terms of the Open Government Licence v3.0 except where otherwise stated. To view this licence, visit nationalarchives.gov.uk/doc/open-government-licence/version/3 or write to the Information Policy Team, The National Archives, Kew, London TW9 4DU, or email: psi@nationalarchives.gov.uk.
Where we have identified any third party copyright information you will need to obtain permission from the copyright holders concerned.
This publication is available at https://www.gov.uk/government/statistics/livestock-populations-in-england/livestock-populations-in-england-at-1-june-2026
This release contains the estimates of cattle, sheep, pig and poultry populations on commercial agricultural holdings in England on 1 June 2026 from the June Survey of Agriculture.
All results tables are available in the accompanying dataset at Livestock populations in England at 1 June (dataset). This dataset contains detailed breakdowns for all livestock, including poultry and other livestock from 1983 to 2026.
Key points
- The total number of cattle and calves in England decreased by 1.5% to 4.8 million in June 2026. The breeding herd has continued its long-term downward trend, decreasing by 2.2% and stands at 1.6 million. Dairy herd numbers decreased by 2.4% to 1.1 million. The beef herd fell by 1.8% to 559 thousand.
- In June 2026, the total number of pigs in England increased by 3.4% to 3.8 million animals. This is due to an increase in both breeding pigs and fattening pigs. Breeding pig numbers rose by 2.8% to 322 thousand animals and Fattening pigs increased by 3.4% to 3.5 million animals.
- The total number of sheep and lambs decreased by 2.0%, to 13.0 million in June 2026. The female breeding flock has continued to decline and fell by 3.7% to 6.2 million. Lambs also saw a fall of 0.5% to 6.5 million.
- The total number of poultry saw little change and remains at 133.0 million in 2026. The number of broilers remained stable at 95.3 million, rising by 0.2%. The breeding and laying flock increased by 1.1%. Turkey numbers fell by 6.1% to 2.6 million.
Section 1 Detailed results
1.1 Cattle
The number of cattle and calves in England has decreased by 1.5% between 2025 and 2026 and now stands at 4.8 million animals.
The breeding herd has continued its long-term downward trend, decreasing by 2.2% to 1.6 million animals in 2026. Despite this decline, it continues to account for a third of the overall cattle population in England. Within the breeding herd, the dairy herd decreased by 2.4% to 1.1 million animals and makes up almost two thirds of the breeding herd (Figure 1). The beef breeding herd also saw a decline, falling by 1.8% to 559 thousand animals, continuing the marked decrease observed in recent years (Figure 2).
Figure 1 - Female cattle breeding herd in England at 1 June (Number of cattle)
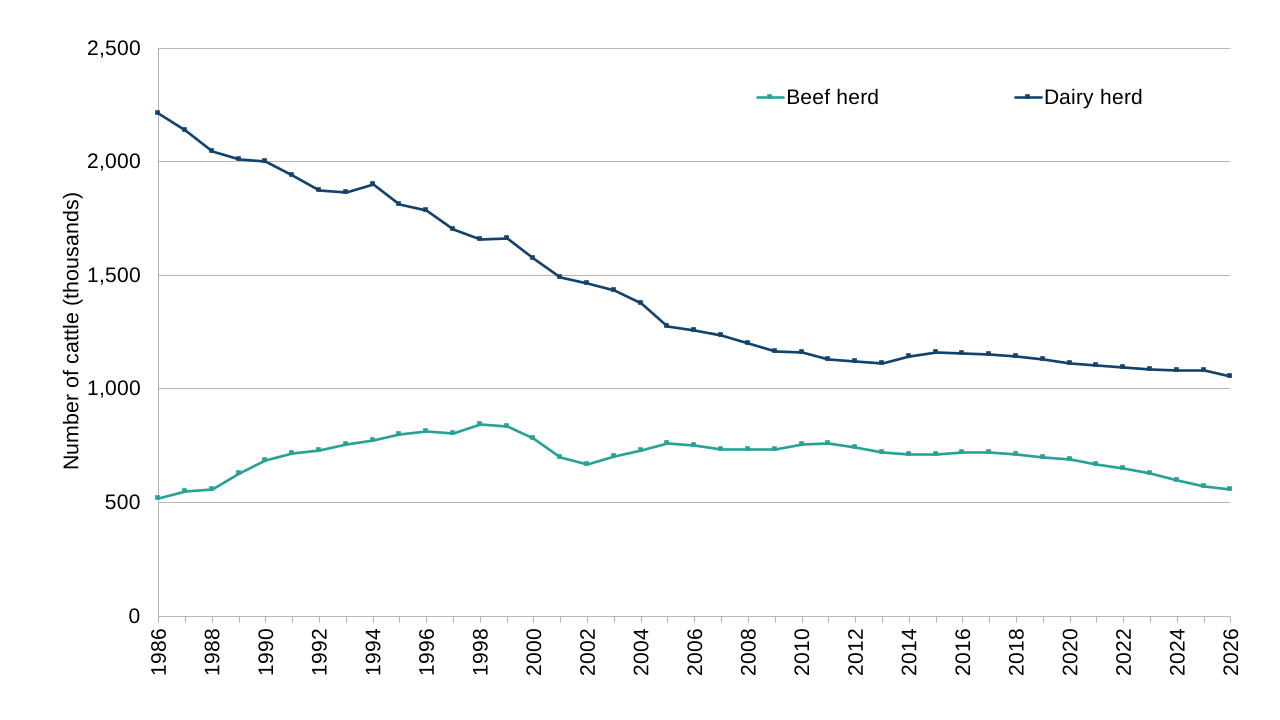
Figure 2 - Breakdown of the female cattle breeding herd in England at 1 June (Number of cattle)
| year | Beef herd | Dairy herd | Total |
|---|---|---|---|
| 2022 | 650,836 | 1,093,845 | 1,744,681 |
| 2023 | 627,101 | 1,086,534 | 1,713,635 |
| 2024 | 595,157 | 1,080,243 | 1,675,400 |
| 2025 | 569,361 | 1,082,477 | 1,651,838 |
| 2026 | 558,867 | 1,056,430 | 1,615,297 |
1.2 Pigs
The number of pigs in England saw an increase of 3.4% in 2026. The increase is due to a 2.8% rise in breeding pigs and a 3.4% rise in fattening pigs.
Figure 3 - Female pig breeding herd in England at 1 June (Number of pigs)
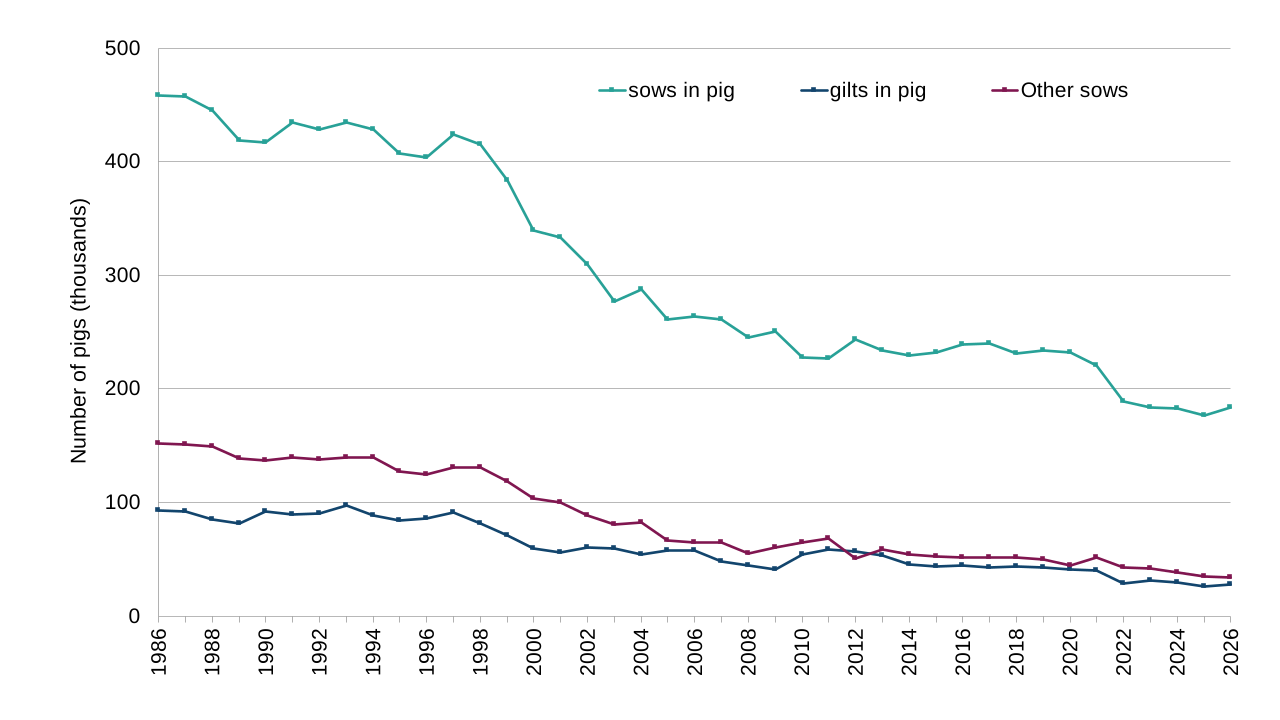
(1) Other sows are those either being suckled or dry sows kept for further breeding.
Figure 4 - Breakdown of the female pig breeding herd in England at 1 June (Number of pigs)
| year | Sows in pig | Gilts in pig | Other sows | Total |
|---|---|---|---|---|
| 2022 | 189,301 | 28,860 | 42,646 | 260,807 |
| 2023 | 183,570 | 31,439 | 41,989 | 256,998 |
| 2024 | 183,008 | 29,788 | 38,602 | 251,398 |
| 2025 | 177,054 | 26,056 | 35,060 | 238,170 |
| 2026 | 183,905 | 28,160 | 34,309 | 246,374 |
(1) Other sows are those either being suckled or dry sows kept for further breeding.
Breeding pig numbers increased by 2.8% to 322 thousand in 2026. The female breeding herd, which accounts for 77% of breeding pigs, rose by 3.4% to 246 thousand (Figure 3). Increases were seen across each category within the breeding herd apart from the other sows category (Figure 4).
Fattening pigs account for 91% of all pigs and stood at 3.5 million in 2026. This was an increase of 3.4% when compared with 2025.
1.3 Sheep
The number of sheep and lambs in England fell by 2.0% to 13.0 million in 2026 and continues the overall downward trend in flock size seen in recent years.
Figure 5 - Female breeding sheep and other sheep and lambs in England at 1 June (Number of sheep)

Figure 6 - Breakdown of the total sheep in England at 1 June (Number of sheep)
| year | Female breeding flock | Other sheep and lambs | Total |
|---|---|---|---|
| 2022 | 7,071,821 | 7,849,786 | 14,921,607 |
| 2023 | 6,955,500 | 7,495,046 | 14,450,546 |
| 2024 | 6,567,035 | 7,263,820 | 13,830,855 |
| 2025 | 6,427,662 | 6,884,409 | 13,312,071 |
| 2026 | 6,186,903 | 6,852,731 | 13,039,634 |
The number of lambs decreased by 0.5% to 6.5 million. The female breeding flock also saw a decrease in 2026, falling by 3.7% to 6.2 million sheep. Decreases in both the lamb and the female breeding flock continue the decline seen in recent years. (Figure 5). Lambs account for half of all sheep with the female breeding flock accounting for a further 47% (Figure 6).
1.4 Poultry
The number of poultry in England has seen little change and remains at 133.0 million in 2026.
The number of table chickens (broilers), which account for 72% of all poultry, saw an increase of 0.2% and remains stable at 95.3 million. The number of breeding and laying fowl has increased by 1.1% to 30.5 million (Figure 7).
Figure 7 - Table chickens and total breeding and laying flock in England at 1 June (Number of birds)
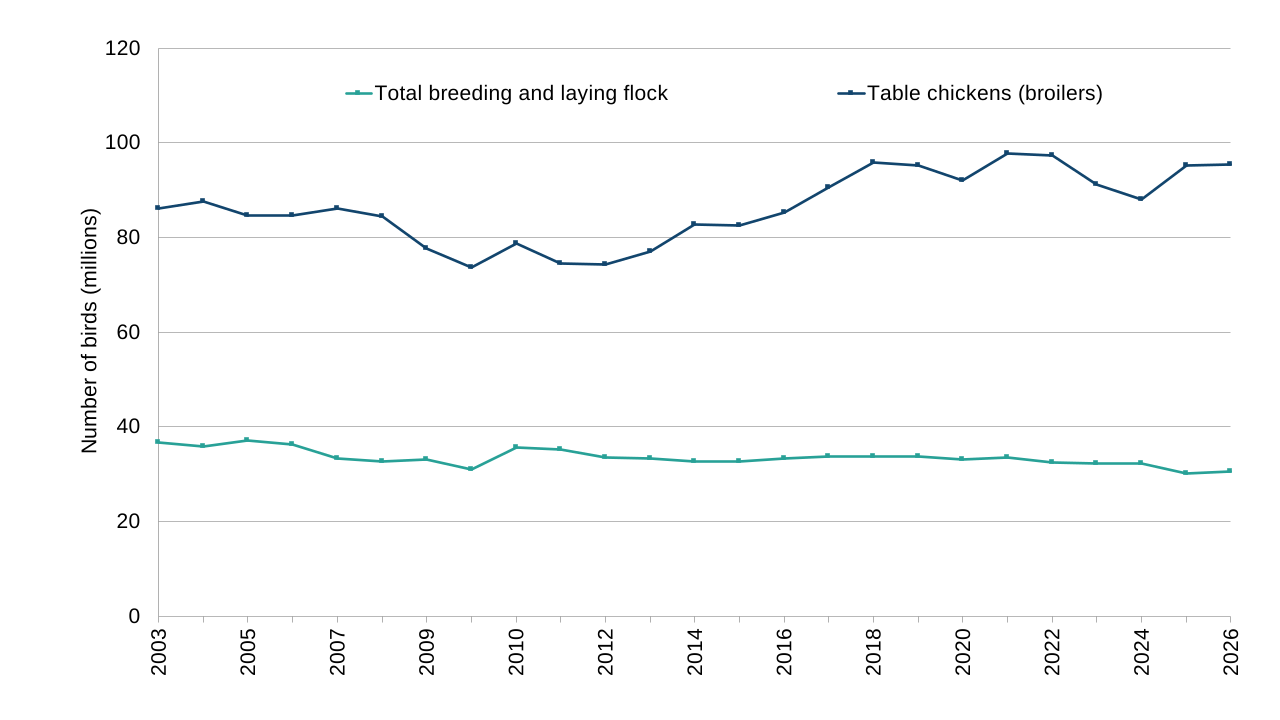
Figure 8 - Breakdown of the total breeding and laying flock in England at 1 June (Number of birds)
| Year | Hens and pullets laying eggs for eating | Breeding flock | Total |
|---|---|---|---|
| 2022 | 24,050,604 | 8,507,703 | 32,558,307 |
| 2023 | 23,006,783 | 9,196,620 | 32,203,403 |
| 2024 | 23,344,182 | 8,816,080 | 32,160,262 |
| 2025 | 22,192,780 | 7,942,552 | 30,135,332 |
| 2026 | 22,298,210 | 8,156,308 | 30,454,518 |
In 2026 the breeding flock increased by 2.7% to 8.2 million birds and is the first increase since 2023. The number of hens and pullets laying eggs for eating also showed a modest increase, rising by 0.5%, and they account for 73% of the total breeding and laying fowl (Figure 8).
The number of turkeys has decreased by 6.1% to 2.6 million birds in 2026. The number of ducks decreased by 18.4% between 2025 and 2026, whilst the number of geese increased by 32.8% over the same period.
It should be noted that due to production cycles, subgroups within the poultry population are often volatile as the point in time nature of the June Survey can lead to large variations in the numbers in each category.
Section 2 About these statistics
2.1 Survey methodology
Full details of the survey methodology are available on the Structure of the agricultural industry guidance web page.
The June Survey of Agriculture and Horticulture has run predominantly online since 2011, with an option for farmers to complete a paper form if they prefer. The survey is annual and samples around 30,000 holdings most years, with a full census run once a decade. The last census was run in 2021.
The June 2026 survey was sent to a sample of 38 thousand commercial holdings and responses were received from 19 thousand holdings, representing a response rate of 50%.
Commercial holdings are defined as those with more than five hectares of agricultural land, one hectare of orchards, 0.5 hectares of vegetables or 0.1 hectares of protected crops, or more than 10 cows, 50 pigs, 20 sheep, 20 goats or 1,000 poultry.
Table 1 provides details of the sample survey population broken down by farm size. The size of a farm is determined by its Standard Labour Requirement (SLR) which is the typical number of full-time workers required on the holding based on its activity.
Table 1: June 2026 population size and sampling rate
| Stratum | Description | Sampling rate (%) | Population size |
|---|---|---|---|
| 1 | SLR < 0.5 | 20% | 55,846 |
| 2 | SLR >= 0.5 and < 1 | 30% | 13,542 |
| 3 | SLR >= 1 and < 2 | 41% | 12,001 |
| 4 | SLR >= 2 and < 3 | 51% | 5,566 |
| 5 | SLR >= 3 and < 5 | 62% | 5,428 |
| 6 | SLR >= 5 | 71% | 5,685 |
| 10 | SLR unknown | 100% | 6,917 |
| All | 35% | 104,985 |
For pig and poultry sectors, an additional data collection exercise is carried out to assure the quality of the pig and poultry data. Some of the largest farm businesses are contacted and asked to provide returns for all of their constituent holdings, ensuring higher coverage of a small number of businesses which contribute a large proportion of the pig and poultry populations. Cattle results are sourced from the Cattle Tracing System (CTS). The data include returns from all holdings with cattle so are not subject to survey error.
2.2 Data analysis
The data are subject to rigorous validation checks which identify inconsistencies within the data or large year-on-year changes. Any records that have not been cleaned by the results production stage are excluded from the analysis.
Population totals are estimated for each question on the survey to account for the non-sampled and non-responding holdings. This survey uses the technique known as ratio raising, in which the trend between the sample data and base data (previous year’s data) is calculated for each stratum. The calculated ratio is then applied to the previous year’s population data to give England level estimates. For holdings where we do not have base data (new holdings or long-term non-responders) the sample estimates are raised according to the inverse sampling fraction.
2.3 Confidence indicators
Confidence intervals and tick based indicators are shown alongside all of our estimated figures and can be found in the data tables within the dataset. These both help to show where there is more variability around results and highlight whether year-on-year changes are statistically significant or not. Whilst these are a useful indicator, they do not take into account any other sources of survey errors, such as non-response bias or administrative data errors.
2.4 Survey changes
Since the June 2024 Survey of Agriculture, we’ve made some changes to how we collect the survey data, including simplifying the survey form and reducing the number of questions asked. As part of these changes, information on any other livestock (donkeys, mules, and hinnies) is no longer collected. Consequently, the number of total other livestock is not included in the accompanying dataset for this statistical report.
2.5 Data notes
- All figures relate to commercial holdings apart from the cattle figures which relate to all holdings as these data are sourced from the Cattle Tracing Scheme.
- All livestock figures quoted in this release relate to animals on farm on 1 June and not capacity – respondents are asked to specify not how many animals they could have, but how many they do have on the holding as of 1 June. This is particularly crucial for poultry figures, where the structure of the industry means that sheds must be empty between crops of poultry for cleaning and to prepare for the next crop. If the poultry shed is empty on 1 June, we ask the respondent to specify ‘0 animals’ and tick a box that confirms that this is because the shed is temporarily empty.
- All percentage changes are based on unrounded figures.
- Totals may not necessarily agree with the sum of their components due to rounding.
2.6 Data uses and users
Results from the June Survey of Agriculture and Horticulture have a wide range of uses and users with requests for data being made on a frequent basis. A document providing information of specific uses and users can be found on our guidance and notes.
2.7 Other survey results and publications
The next releases from the June Survey are expected to be at the end of September. The definitive publication date will be announced on the research and statistics webpage on gov.uk.
More detailed results from the June Survey can be found on our Structure of the agricultural industry in England and the UK at June web page. This includes various time series of crop areas and livestock numbers dating back as early as 1866 and detailed geographical breakdowns of the results.
2.8 Feedback
We welcome feedback and any thoughts to improve the publication further. Please send any feedback to: farming-statistics@defra.gov.uk.
Section 3 - What you need to know about this release
3.1 Contact details
Responsible statistician: Sarah Thompson
Team: Farming Statistics Department for Environment, Food and Rural Affairs
Email: farming-statistics@defra.gov.uk
Tel: 0300 060 0170
3.2 Accredited official statistics
Accredited official statistics are called National Statistics in the Statistics and Registration Service Act 2007. An explanation can be found on the Office for Statistics Regulation website.
Our statistical practice is regulated by the Office for Statistics Regulation (OSR). OSR sets the standards of trustworthiness, quality and value in the Code of Practice for Statistics that all producers of official statistics should adhere to.
These accredited official statistics were independently reviewed by the Office for Statistics Regulation in 2014. They comply with the standards of trustworthiness, quality and value in the Code of Practice for Statistics and should be labelled accredited official statistics .
You are welcome to contact us directly with any comments about how we meet these standards (see contact details). Alternatively, you can contact OSR by emailing regulation@statistics.gov.uk or via the OSR website.
Since the latest review by the Office for Statistics Regulation, we have continued to comply with the Code of Practice for Statistics, and have made the following improvements:
- Reviewed and amended the validation checks carried out on response data including validation against new administrative data sources to better assure ourselves of the quality of the statistics.
- Enhanced trustworthiness by removing pre-release access.