Large businesses' payment practices and performance statistics 2025: commentary
Published 14 July 2026

© Crown copyright 2026
This publication is licensed under the terms of the Open Government Licence v3.0 except where otherwise stated. To view this licence, visit nationalarchives.gov.uk/doc/open-government-licence/version/3 or write to the Information Policy Team, The National Archives, Kew, London TW9 4DU, or email: psi@nationalarchives.gov.uk.
Where we have identified any third party copyright information you will need to obtain permission from the copyright holders concerned.
This publication is available at https://www.gov.uk/government/statistics/large-businesses-payment-practices-and-performance-statistics-2025/large-businesses-payment-practices-and-performance-statistics-2025-commentary
Headline findings
Long-run trends
Since reporting started in 2018[footnote 1]:
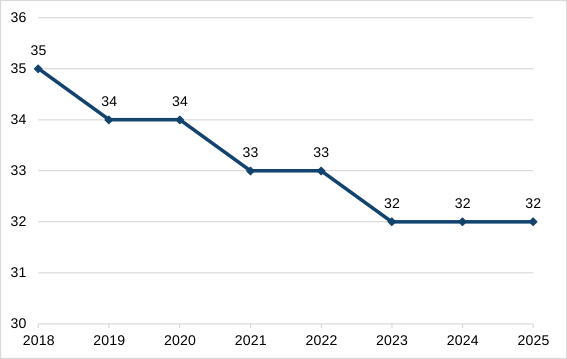
- the time large businesses take to pay their suppliers has decreased. In 2025, large businesses paid their suppliers in 32 days, down from 35 days in 2018
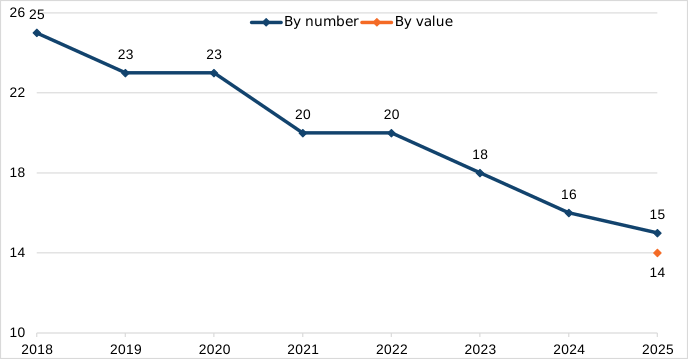
- the proportion of invoices paid late by large businesses has been steadily decreasing. In 2025, large businesses paid 15% of invoices late, down from 25% in 2018, a 10 percentage point decrease
- the number of valid reports submitted by large businesses has decreased, with notable drops in 2020 and 2025. There were 11,178 valid reports submitted in 2025, down from 13,175 in 2018, a 15.2% decrease
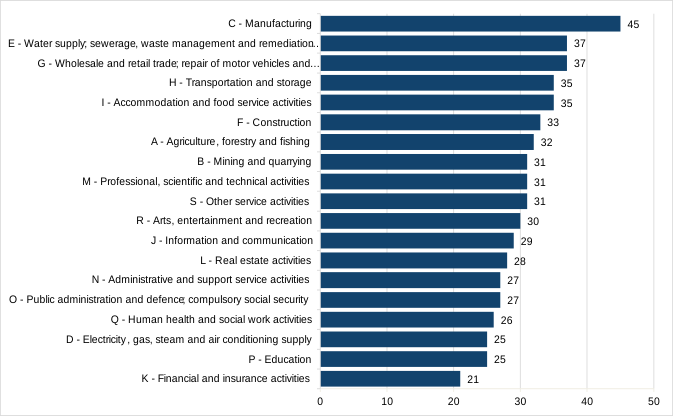
- large businesses in the ’Manufacturing’ sector have consistently had the longest payment times and among the highest proportions of invoices paid late, compared with other sectors[footnote 2]
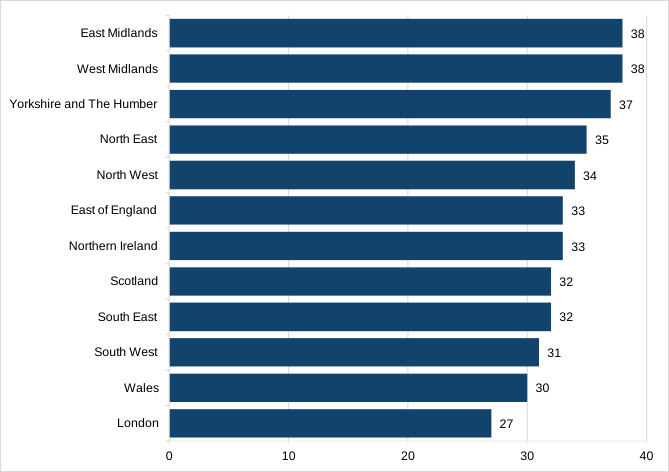
- large businesses in London have consistently had the shortest payment times and among the lowest proportions of invoices paid late, compared with other regions
Latest data and recent changes
In 2025:
- large businesses paid their suppliers in 32 days, unchanged from 2023 and 2024
- 15% of invoices were paid late by large businesses, a 1 percentage point decrease from 2024
- 14% of the total value of invoices was paid late by large businesses. This metric is new and only available for 2025
- large businesses submitted 11,178 valid reports, a 6.5% decrease from 2024. This decrease reflects a change in the scope of the reporting requirements, which reduced the number of businesses meeting the size thresholds for reporting in 2025[footnote 3]
Introduction
About these statistics
This commentary accompanies the most recent UK large business payment practices and performance statistics data tables, published on 14 July 2026. It highlights and summarises recent trends in large UK business payment performance, including how long businesses take to pay their suppliers and the extent to which invoices are paid late.
The statistics are based on data reported by businesses under The Reporting on Payment Practices and Performance Regulations 2017, which require large UK businesses to report on their payment practices, policies and performance twice-yearly. This information is publicly available on GOV.UK’s Payment practices reporting webpage.
Definition of large businesses
The reporting regulations define a large business as one that has exceeded 2 of the following thresholds on its last 2 balance sheet dates:
- £54 million annual turnover
- £27 million balance sheet total
- 250 employees
Metrics
The statistics include 3 main performance metrics, which describe overall large business performance:
- time to pay (days): how long large businesses take to pay their suppliers
- proportion of invoices paid late, by number (%): how often invoices are paid late
- proportion of invoices paid late, by value (%): how much of the total value of invoices is paid late
The statistics also include a contextual measure of reporting coverage as follows, which helps users understand the size of the reporting population and where breakdowns have been calculated using low numbers of reports:
- number of valid reports: how many reports large businesses submitted, after removing incomplete and invalid reports
The statistics present headline figures with additional breakdowns by sector and region.
Use of medians
The statistics present median values, which describe average large business performance. Medians are used instead of means to limit the impact of extreme values. The use of medians is explained further in the ‘Approach’ section of the accompanying methodology.
The number of valid reports statistic is a simple count.
Uses of the statistics
The statistics support policy development, monitoring and evaluation, and wider public discussion of large businesses’ payment practices and performance.
Summary of results
Time to pay
Time to pay shows how long on average large businesses take to pay their suppliers.
These times can be considered relative to established benchmarks. The Fair Payment Code, a voluntary scheme that recognises good payment practices, sets a benchmark of paying suppliers within 30 days. Payment terms exceeding 60 days are subject to legislative restrictions. For more information, read the Late Payment of Commercial Debts (Interest) Act 1998.
Figure 1: Time to pay (days), 2018 to 2025
View the web accessible version of Figure 1.
The line graph in Figure 1 shows that large businesses’ average time to pay was 32 days in 2025. It has remained unchanged since 2023, after a gradual decrease from 35 days in 2018.
Figure 2: Time to pay (days), UK region breakdown, 2025
View the web accessible version of Figure 2.
The bar chart in Figure 2 shows that, in 2025, large businesses in the East Midlands and West Midlands took the longest to pay their suppliers, averaging 38 days. Large businesses in London paid their suppliers in the shortest time, averaging 27 days.
This figure excludes reports that could not be assigned to a region, which are categorised as ‘Unknown’.
Figure 3: Time to pay (days), Standard Industrial Classification (SIC) section breakdown, 2025
View the web accessible version of Figure 3.
The bar chart in Figure 3 shows that, in 2025, large businesses in the ’Manufacturing’ sector took the longest to pay their suppliers, averaging 45 days. This may reflect the more predominant role of physical goods and the complexity of supply chains in this sector. Large businesses in the ’Finance and insurance activities’ sector paid their suppliers in the shortest time, averaging 21 days. This may reflect the more predominant role of services and payment practices that are less influenced by cash flow considerations in this sector.
This figure excludes reports that could not be assigned to a sector, which are categorised as ‘Unknown’. It also excludes ‘Activities of households as employers; undifferentiated goods- and services-producing activities of households for own use’ and ‘Activities of extraterritorial organisations and bodies’, due to low numbers of reports which limit reliability and interpretability.
Proportion of invoices paid late
Proportion of invoices paid late shows on average how many invoices large businesses pay after the agreed terms. This is presented both in terms of the number of invoices paid late, and the value of invoices paid late.
Figure 4: Proportion of invoices paid late, by number and value (%), 2018 to 2025
View the web accessible version of Figure 4.
The line graph in Figure 4 shows that the proportion of invoices paid late, by number, was 15% in 2025. This is a 1 percentage point decrease from 2024 and follows a gradual decrease from 25% in 2018. While the proportion of invoices paid late has decreased from 2018, nearly 1 in 6 invoices were paid late in 2025.
The proportion of invoices paid late, by value, was 14% in 2025. This metric is new and only available for 2025.
The proportions of invoices paid late, by number and value, were similar in 2025. This suggests that on average late payment did not vary substantially between lower and higher-value invoices, although differences may exist across the distribution.
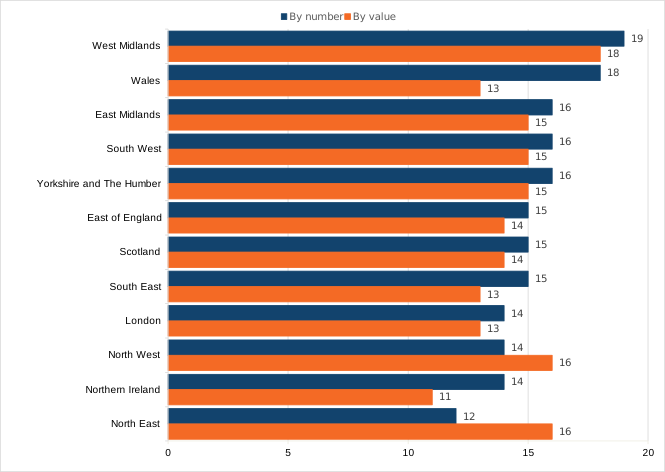
Figure 5: Proportion of invoices paid late, by number and value (%), 2025, UK regions breakdown
View the web accessible version of Figure 5.
The bar chart in Figure 5 shows that, in 2025, large businesses in the West Midlands had the highest proportion of invoices paid late by number, at 19%. Large businesses in the North East had the lowest proportion of invoices paid late by number, at 12%.
In 2025, large businesses in the West Midlands had the highest proportion of invoices paid late by value, at 18%. Large businesses in Northern Ireland had the lowest proportion of invoices paid late by value, at 11%.
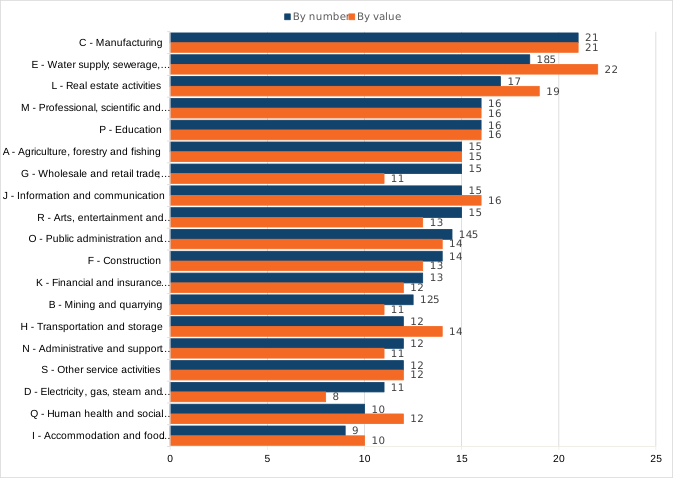
Figure 6: Proportion of invoices paid late, by number and value (%), 2025, UK SIC section breakdown
View the web accessible version of Figure 6.
The bar chart in Figure 6 shows that large businesses in the ‘Manufacturing’ sector had the highest proportion of invoices paid late by number in 2025, at 21%. Large businesses in the ‘Accommodation and food service activities’ sector had the lowest proportion of invoices paid late by number, at 9%.
Large businesses in the ‘Water supply; sewerage, waste management and remediation activities’ sector had the highest proportion of invoices paid late by value in 2025, at 22%. Large businesses in the ‘Electricity, gas, steam and air conditioning supply’ sector had the lowest proportion, at 8%.
Number of valid reports
Number of valid reports shows how many reports large businesses submitted, after removing incomplete and invalid reports. For further information on how valid reports are determined, read the ‘Annex: Data preparation’ section of the accompanying methodology.
Number of valid reports counts individual reports rather than reporting businesses. Businesses must report twice-yearly, but not every business submits 2 reports each year.
These numbers can be considered in the context of estimated full reporting compliance. Before the 2025 changes to the large business size thresholds, DBT analysis estimates that between 14,000 and 16,000 businesses were required to report in 2024. If each business submitted 2 reports annually, this would equate to between 28,000 and 32,000 expected reports. For further details, read the ‘Late payments: impact assessment on primary legislation’ on the Late payments: tackling poor payment practices consultation webpage.
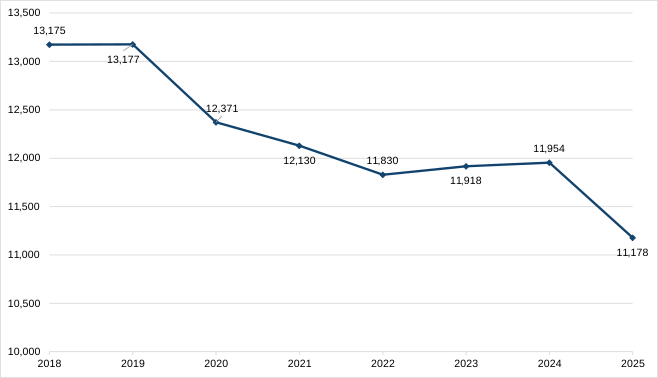
Figure 7: Number of valid reports, 2018 to 2025
View the web accessible version of Figure 7.
The line graph in figure 7 shows that the number of valid reports submitted by large businesses was 11,178 in 2025. This represents a decrease from 2024, and is 15.2% lower than the peak of 13,177 reports in 2019.
There are 2 notable decreases in the number of valid reports submitted by large businesses since 2018:
-
between 2019 and 2020, there was a 6.1% decrease. This coincided with the COVID-19 pandemic, which disrupted many businesses and may have affected reporting behaviour
-
between 2024 and 2025, there was a 6.5% decrease. This decrease reflects a change in the scope of the reporting requirements, which reduced the number of businesses meeting the size thresholds for reporting in 2025
Technical information
The following technical information applies to these statistics:
- the statistics use median values, rather than means, to reduce the influence of extreme values on the results
- the statistics include only valid reports. Reports that do not meet data validation or consistency checks are excluded, including reports with missing values and duplicate entries. For further information on the impact of this change, read the ‘Approach: Data preparation’ section of the accompanying methodology
- under the reporting regulations, businesses are required to submit reports every 6 months. This means that, in most cases, a business can submit up to 2 reports in a calendar year. The statistics are based on individual reports, rather than aggregating reports to the company level first
- the reporting data is self-reported by businesses. Businesses are legally required to report correct information, but there is no independent verification of the data
- businesses’ financial years and reporting periods vary. To produce consistent annual statistics, each report is assigned to a calendar year based on where most of the reporting period falls. For further information on the impact of this change, read the ‘Approach: Reporting Year Assignment’ section of the accompanying methodology
- the statistics include measures of late payment by both number and value of invoices. The measure by number shows the proportion of invoices paid late. From 2025 onwards, businesses are also required to report the total value of invoices paid and the value of invoices paid late, which is used to produce the measure by value
- the scope of The Reporting on Payment Practices and Performance Regulations 2017 changed in 2025, which coincided with a 6.5% decrease in the number of valid reports submitted by businesses, compared with 2024. Despite this, headline statistics have been minimally affected, remaining largely stable
- where the region or sector of a reporting business cannot be matched to the Companies House data, these are classified as ‘Unknown’. These breakdowns are excluded from the commentary around sector and region breakdowns
Publication
These statistics were published on 14 July 2026. The next release is planned for July 2027.
Revisions
The reporting data is a live data source, and businesses can submit backdated reports. This means that previously published statistics may change if new data becomes available. The revisions policy is further explained in the accompanying methodology.
Pre-release access
Pre-release access is provided for these statistics. For details, see Large businesses’ payment practices and performance statistics: pre-release access.
Web accessible tables
Figure 1: Time to pay (days), 2018 to 2025
| Reporting Year | Time to pay (days) |
|---|---|
| 2018 | 35 |
| 2019 | 34 |
| 2020 | 34 |
| 2021 | 33 |
| 2022 | 33 |
| 2023 | 32 |
| 2024 | 32 |
| 2025 | 32 |
Figure 2: Time to pay (days), UK region breakdown, 2025
| ITL1 region | Time to pay (days) |
|---|---|
| East Midlands | 38 |
| East of England | 33 |
| London | 27 |
| North East | 35 |
| North West | 34 |
| Northern Ireland | 33 |
| Scotland | 32 |
| South East | 32 |
| South West | 31 |
| Wales | 30 |
| West Midlands | 38 |
| Yorkshire and The Humber | 37 |
Figure 3: Time to pay (days), Standard Industrial Classification (SIC) section breakdown, 2025
| SIC section | Time to pay (days) |
|---|---|
| A – Agriculture, forestry and fishing | 32 |
| B – Mining and quarrying | 31 |
| C – Manufacturing | 45 |
| D – Electricity, gas, steam and air conditioning supply | 25 |
| E – Water supply; sewerage, waste management and remediation activities | 37 |
| F – Construction | 33 |
| G – Wholesale and retail trade; repair of motor vehicles and motorcycles | 37 |
| H – Transportation and storage | 35 |
| I – Accommodation and food service activities | 35 |
| J – Information and communication | 29 |
| K – Financial and insurance activities | 21 |
| L – Real estate activities | 28 |
| M – Professional, scientific and technical activities | 31 |
| N – Administrative and support service activities | 27 |
| O – Public administration and defence; compulsory social security | 27 |
| P – Education | 25 |
| Q – Human health and social work activities | 26 |
| R – Arts, entertainment and recreation | 30 |
| S – Other service activities | 31 |
Figure 4: Proportion of invoices paid late, by number and value (%), 2018 to 2025
| Reporting Year | Proportion of invoices paid late, by number (%) | Proportion of invoices paid late, by value (%) |
|---|---|---|
| 2018 | 25 | No data available |
| 2019 | 23 | No data available |
| 2020 | 23 | No data available |
| 2021 | 20 | No data available |
| 2022 | 20 | No data available |
| 2023 | 18 | No data available |
| 2024 | 16 | No data available |
| 2025 | 15 | 14 |
Figure 5: Proportion of invoices paid late, by number and value (%), 2025, UK regions breakdown
| ITL1 region | Proportion of invoices paid late, by number (%) | Proportion of invoices paid late, by value (%) |
|---|---|---|
| East Midlands | 16 | 15 |
| East of England | 15 | 14 |
| London | 14 | 13 |
| North East | 12 | 16 |
| North West | 14 | 16 |
| Northern Ireland | 14 | 11 |
| Scotland | 15 | 14 |
| South East | 15 | 13 |
| South West | 16 | 15 |
| Wales | 18 | 13 |
| West Midlands | 19 | 18 |
| Yorkshire and The Humber | 16 | 15 |
Figure 6: Proportion of invoices paid late, by number and value (%), 2025, UK SIC section breakdown
| SIC section | Proportion of invoices paid late, by number (%) | Proportion of invoices paid late, by value (%) |
|---|---|---|
| A – Agriculture, forestry and fishing | 15 | 15 |
| B – Mining and quarrying | 12.5 | 11 |
| C – Manufacturing | 21 | 21 |
| D – Electricity, gas, steam and air conditioning supply | 11 | 8 |
| E – Water supply; sewerage, waste management and remediation activities | 18.5 | 22 |
| F – Construction | 14 | 13 |
| G – Wholesale and retail trade; repair of motor vehicles and motorcycles | 15 | 11 |
| H – Transportation and storage | 12 | 14 |
| I – Accommodation and food service activities | 9 | 10 |
| J – Information and communication | 15 | 16 |
| K – Financial and insurance activities | 13 | 12 |
| L – Real estate activities | 17 | 19 |
| M – Professional, scientific and technical activities | 16 | 16 |
| N – Administrative and support service activities | 12 | 11 |
| O – Public administration and defence; compulsory social security | 14.5 | 14 |
| P – Education | 16 | 16 |
| Q – Human health and social work activities | 10 | 12 |
| R – Arts, entertainment and recreation | 15 | 13 |
| S – Other service activities | 12 | 12 |
Figure 7: Number of valid reports, 2018 to 2025
| Reporting Year | Number of valid reports submitted |
|---|---|
| 2018 | 13,175 |
| 2019 | 13,177 |
| 2020 | 12,371 |
| 2021 | 12,130 |
| 2022 | 11,830 |
| 2023 | 11,918 |
| 2024 | 11,954 |
| 2025 | 11,178 |
-
The reporting regulations were introduced in 2017, but the statistics consider data from 2018 only, due to data quality issues. ↩
-
This comparison excludes ’Activities of households as employers; undifferentiated goods- and services-producing activities of households for own use’ and ‘Activities of extraterritorial organisations and bodies’, due to low numbers of reports which limit reliability and interpretability. ↩
-
The impact of this change is further explained in the ‘Changes to the reporting regulations’ section of the accompanying methodology. ↩