Lancashire Women report (HTML version)
Published 27 July 2023

© Crown copyright 2023
This publication is licensed under the terms of the Open Government Licence v3.0 except where otherwise stated. To view this licence, visit nationalarchives.gov.uk/doc/open-government-licence/version/3 or write to the Information Policy Team, The National Archives, Kew, London TW9 4DU, or email: psi@nationalarchives.gov.uk.
Where we have identified any third party copyright information you will need to obtain permission from the copyright holders concerned.
This publication is available at https://www.gov.uk/government/statistics/justice-data-lab-statistics-july-2023/lancashire-women-report-html-version
This analysis looked at the reoffending behaviour of women participating on 2,165 occasions with the Lancashire Women (LW) programme. It covers those who began the programme between April 2015 and March 2021. The overall results show that women who took part in LW were less likely to reoffend, reoffended less frequently and took longer to reoffend than those who did not take part. These results were statistically significant. A previous analysis was published in October 2014, covering a separate cohort who began the programme between 2010 and 2012, and can be found in the Justice Data Lab statistics collection on GOV.UK.
Lancashire Women support women involved, or at risk of involvement, in the criminal justice system. The gender-specific organisation offers support around societal stigmas, housing, emotional wellbeing, education, employment, and family and relationships.
The headline analysis in this report measured proven reoffences in a one-year period for a ‘treatment group’ of 2,165 offenders who received support some time between 2015 and 2021, and for a much larger ‘comparison group’ of similar offenders who did not receive it.
1. Overall measurements of the treatment and comparison groups
| For 100 typical women in the treatment group, the equivalent of: | For 100 typical women in the comparison group, the equivalent of: |
|---|---|
| 29 of the 100 women committed a proven reoffence within a one-year period (a rate of 29%), 5 women fewer than in the comparison group. | 34 of the 100 women committed a proven reoffence within a one-year period (a rate of 34%). |
| 111 proven reoffences were committed by these 100 women during the year (a frequency of 1.1 offences offences per person), 54 offences fewer than in the comparison group. | 164 proven reoffences were committed by these 100 women during the year (a frequency of 1.6 offences per person). |
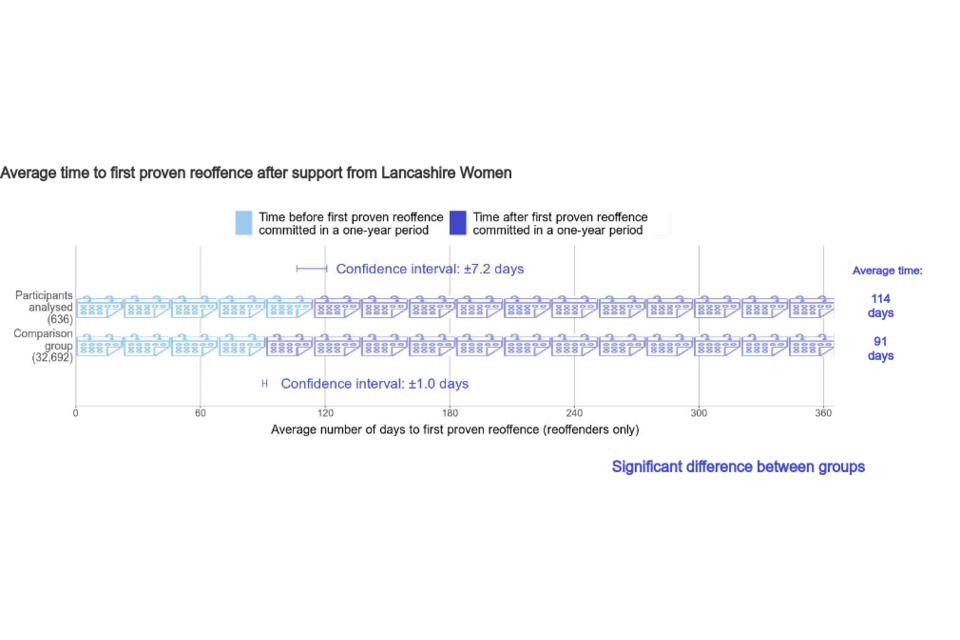
| 114 days was the average time before a reoffender committed their first proven reoffence, 23 days later than the comparison group. | 91 days was the average time before a reoffender committed their first proven reoffence. |
2. Overall estimates of the impact of the intervention
For 100 typical women who receive support, compared with 100 similar women who do not receive it:
The number of women who commit a proven reoffence within one year after release could be lower by between 3 and 7 women. This is a statistically significant result.
The number of proven reoffences committed during the year could be lower by between 42 and 65 offences. This is a statistically significant result.
On average, the time before an offender committed their first proven reoffence could be longer by between 15 and 30 days. This is a statistically significant result.
Please note totals may not appear to equal the sum of the component parts due to rounding.
3. What you can and cannot say
What you can say about the one-year reoffending rate:
“This analysis provides evidence that support from Lancashire Women may decrease the number of proven reoffenders during a one-year period.”
What you cannot say about the one-year reoffending rate:
“This analysis provides evidence that support from Lancashire Women increases/has no effect on the reoffending rate of its participants.”
What you can say about the one-year reoffending frequency:
“This analysis provides evidence that support from Lancashire Women may decrease the number of proven reoffences committed during a one-year period by its participants.”
What you cannot say about the one-year reoffending frequency:
“This analysis provides evidence that support from Lancashire Women increases/has no effect on the number of reoffences committed by its participants.”
What you can say about the one-year time to first reoffence:
“This analysis provides evidence that support from Lancashire Women may lengthen the average time to first proven reoffence for its participants.”
What you cannot say about the one-year time to first reoffence:
“This analysis provides evidence that support from Lancashire Women decreases/has no effect on the average time to first reoffence for its participants.”
4. Figure 1: One-year proven reoffending rate after support from Lancashire Women

5. Figure 2: One-year proven reoffending frequency after support from Lancashire Women

6. Figure 3: Average time to first proven reoffence after support from Lancashire Women
7. Lancashire Women in their own words
“Our project aim was to build upon the strong process that Lancashire and Cumbria have made in the development of a female offenders Whole System Approach (WSA). Our proposal was to establish a post which, although hosted by LW, works outside of organisational silos which drives a collective strategy to meet the holistic needs of female offenders. As part of this, we were keen to provide strategic support to further develop and embed a whole systems approach for females in Lancashire and Cumbria.
The WSA in Cumbria was developed further as it has a less well developed system than the one in Lancashire, and faces particular challenges in terms of geography. Through a ‘curious’ conversation with women, we were able to identify and articulate areas of unmet needs in provision for female offenders in Lancashire and Cumbria and to lead the development of multi-agency collaborative action to address these needs. We sought to encourage the wider engagement of key missing strategic partners, in particular those from health and substance misuse, into Lancashire and Cumbria WSA activity in order to improve the process of referral to key support services not offered through current WSA provision. We also supported the wider involvement of grass roots women’s groups into current WSA provision in Lancashire and Cumbria, ensuring that these groups have increased capacity to support the WSA. This includes understanding of the theoretical underpinning of the WSA approach, improved data capture, meeting expected standards in service provision (e.g. safeguarding) and by providing voice.
This was achieved through the development of a programme of capacity building activity. A large scale of strategic work was carried out to target key groups of female offenders who are currently underrepresented (or who are experiencing poorer outcomes) in current WSA activity. In particular we have identified younger women, women from ethnic minorities, LGBTQ women, and those with children. We enabled the improved articulation of the Lancashire and Cumbria WSA and a wider dissemination of best practice and learning from this activity, both locally and nationally. We believe this is to be key to embedding and sustaining this approach in times of continued austerity. ”
8. Response from Lancashire Women to the Justice Data Lab analysis
“This is a positive analysis which confirms what we know from collecting our service user evaluation data but is confirmed as statistically significant results in respect of the work through the Justice Data Lab.
Given the period over which the data is submitted however, it is important to note and reflect that it covers a more fragmented service with varied funded interventions (eg. Avert and Recourse projects) which contribute to this bigger picture view but don’t tell us about some of the complexities of women’s needs. It is also important to note these initiatives are no longer part of the model at present.
It is this complexity of issues faced by the women we support that continues to be ‘hidden’ as many end up in a revolving door of inputs across multiple providers due to failures in the wider criminal justice system.
LW work with women with specific issues and barriers which can contribute to and/or exacerbate their offending behaviour. We use a Whole Systems Approach to help to mitigate this, often carrying out work beyond the interventions which are funded for, and so this additional work is not always captured by the data.”
9. Results in detail
One analysis was conducted, controlling for offender demographics and criminal history and the following risks and needs: mental health, thinking skills, attitudes, accommodation, employment, financial management, relationships, drug use and alcohol use.
- Regional analysis: treatment group matched to offenders in North West using demographics, criminal history and individual risks and needs.
The sizes of the treatment and comparison groups for reoffending rate and frequency analyses are provided below. To create a comparison group that is as similar as possible to the treatment group, each person within the comparison group is given a weighting proportionate to how closely they match the characteristics of individuals in the treatment group. The calculated reoffending rate uses the weighted values for each person and therefore does not necessarily correspond to the unweighted figures.
| Treatment Group Size | Comparison Group Size | Reoffenders in treatment group | Reoffenders in comparison group (weighted number) |
|---|---|---|---|
| 2,165 | 88,838 | 636 | 32,692 (30,422) |
Three headline measures of one-year reoffending were analysed, as well as four additional measures (see results in Tables 1-7):
- Rate of reoffending
- Frequency of reoffending
- Time to first reoffence
- Rate of first reoffence by court outcome
- Frequency of reoffences by court outcome
- Rate of custodial sentencing for first reoffence
- Frequency of custodial sentencing
10. Significant results
Seven measures show a statistically significant result. These provide significant evidence that:
Regional
-
Participants are less likely to commit a reoffence within a one-year period than non-participants.
-
Participants commit fewer reoffences within a one-year period than non-participants.
-
Participants who reoffend within a one-year period commit their first proven reoffence later than non-participants.
-
Participants who reoffend within a one-year period commit fewer triable-either-way offences than non-participants.
-
Participants who reoffend within a one-year period commit fewer summary offences than non-participants.
-
Participants who reoffend within a one-year period are less likely to receive a custodial sentence for their first reoffence than non-participants.
-
Participants who reoffend within a one-year period receive fewer custodial sentences than non-participants.
Tables 1-7 show the overall measures of reoffending. Rates are expressed as percentages and frequencies expressed per person. Tables 3 to 7 include reoffenders only.
10.1 Table 1: Proportion of women who committed a proven reoffence in a one-year period after support from Lancashire Women compared with matched comparison groups
| Number in treatment group | Number in comparison group | Treatment group rate (%) | Comparison group rate (%) | Estimated difference (% points) | Significant difference? | p-value |
|---|---|---|---|---|---|---|
| 2,165 | 88,838 | 29 | 34 | -7 to -3 | Yes | <0.01 |
10.2 Table 2: Number of proven reoffences committed in a one-year period by women who received support from Lancashire Women compared with matched comparison groups
| Number in treatment group | Number in comparison group | Treatment group frequency | Comparison group frequency | Estimated difference | Significant difference? | p-value |
|---|---|---|---|---|---|---|
| 2,165 | 88,838 | 1.11 | 1.64 | -0.65 to -0.42 | Yes | <0.01 |
10.3 Table 3: Average time to first proven reoffence in a one-year period for people who received support from Lancashire Women, compared with matched comparison groups (reoffenders only)
| Number in treatment group | Number in comparison group | Treatment group time | Comparison group time | Estimated difference | Significant difference? | p-value |
|---|---|---|---|---|---|---|
| 636 | 32,692 | 114 | 91 | 15 to 30 | Yes | <0.01 |
10.4 Table 4: Proportion of women supported by Lancashire Women with first proven reoffence in a one-year period by court outcome, compared with similar non-participants (reoffenders only)
| Number in treatment group | Number in comparison group | Court outcome | Treatment group rate (%) | Comparison group rate (%) | Estimated difference (% points) | Significant difference? | p-value |
|---|---|---|---|---|---|---|---|
| 636 | 32,687 | Either way | 68 | 68 | -4 to 3 | No | 0.88 |
| Summary | 28 | 29 | -4 to 3 | No | 0.83 |
10.5 Table 5: Number of proven reoffences in a one-year period by court outcome for women supported by Lancashire Women, compared with similar non-participants (reoffenders only)
| Number in treatment group | Number in comparison group | Court outcome | Treatment group frequency | Comparison group frequency | Estimated difference | Significant difference? | p-value |
|---|---|---|---|---|---|---|---|
| 636 | 32,687 | Indictable | 0.03 | 0.02 | -0.01 to 0.03 | No | 0.45 |
| Either way | 2.72 | 3.56 | -1.14 to -0.55 | Yes | <0.01 | ||
| Summary | 0.92 | 1.11 | -0.31 to -0.07 | Yes | <0.01 |
10.6 Table 6: Proportion of women who received a custodial sentence for their first proven reoffence after support from Lancashire Women, compared with similar non-participants (reoffenders only)
| Number in treatment group | Number in comparison group | Treatment group rate (%) | Comparison group rate (%) | Estimated difference (% points) | Significant difference? | p-value |
|---|---|---|---|---|---|---|
| 636 | 32,687 | 25 | 41 | -20 to -13 | Yes | <0.01 |
10.7 Table 7: Number of custodial sentences received in a one-year period by women who received support from Lancashire Women, compared to similar non-participants (reoffenders only)
| Number in treatment group | Number in comparison group | Treatment group frequency | Comparison group frequency | Estimated difference | Significant difference? | p-value |
|---|---|---|---|---|---|---|
| 636 | 32,687 | 1.43 | 2.56 | -1.37 to -0.89 | Yes | <0.01 |
11. Profile of the treatment group
Lancashire Women offered a range of interventions in group and one-to-one sessions. These interventions supported women with needs such as accommodation, education, training and employment, substance misuse, family and relationships, sex work, domestic violence, finance benefits, debt and thinking, behaviour and victim awareness. Interventions varied in length and, on average, women would attend for 10 sessions with some women engaging with the service for up to 4 years.
| Participants included in analysis (2,165 offenders) | Participants not included in analysis (2,511 offenders with available data) | |
|---|---|---|
| Sex | ||
| Female | 100% | 100% |
| Ethnicity | ||
| White | 92% | 91% |
| Black | 1% | 1% |
| Asian | 2% | 2% |
| Other | 0% | |
| Unknown | 5% | 5% |
| UK national | ||
| UK nationality | 90% | 88% |
| Foreign nationality | 2% | 2% |
| Unknown nationality | 8% | 10% |
| Index disposal | ||
| Community order | 43% | |
| Suspended sentence order | 21% | |
| Out-of-court disposal | 9% | |
| Absolute discharge | 0% | |
| Conditional discharge | 3% | |
| Fine | 5% | |
| Other | 1% | |
| Prison | 19% |
Information on index offences for the 2,511 participants not included in the analysis is not available, as they could not be linked to a suitable sentence.
For 1,079 people, no personal information is available.
Please note totals may not appear to equal the sum of the component parts due to rounding.
Information on risk was available for 1,681 women in the reoffending analysis treatment group (78%), recorded near to the time of their original conviction.
- 18% were currently of no fixed abode or in transit of accommodation
- 23% had some or significant problems with problem solving
- 23% had some or significant problems with awareness of consequences
12. Matching the treatment and comparison groups
The analysis matched a comparison group to the treatment group. A summary of the matching quality is as follows, with further details provided in the accompanying Excel annex:
- The treatment and control groups were well matched.
Further details of group characteristics, including risks and needs recorded by the Offender Assessment System (OASys), can also be found in the Excel annex
This report is also supplemented by a general annex, which answers frequently asked questions about Justice Data Lab analyses and explains the caveats associated with them.
13. Additional information on the dataset
13.1 Index dates
The index date is the date at which the follow up period for measuring reoffending begins.
- For women with custodial sentences, the index date is the date they are released from custody.
- For women with a court order (such as a community sentence or a suspended sentence order), the index date is the date when an offender begins the court order.
- For women with non-custodial sentences such as a fine, the index date is the date when the offender received the sentence.
13.2 Multiple participations of the Lancashire Women’s programme
Due to the nature of how Lancashire Women works, there were many cases where women participated in the programme multiple times, hence one individual may have contributed towards multiple records in the original dataset received by LW.
For this evaluation, women who have accessed the service multiple times will only be recorded as one entry per individual per corresponding sentence. This will mean:
- Women who have accessed the system multiple times during the same sentence (custodial, community, or fine) will count as one unit in the treatment group.
- Women who accessed the system multiple times over multiple unique sentences will count towards one unit per sentence, regardless of how many times they used the service within that sentence or how many convictions they received over the time period of analysis.
As an example, if the following data was provided, only the bold rows would be kept in the dataset for analysis:
| Name | DoB | Intervention start date | Corresponding index date |
|---|---|---|---|
| S.Smith | 1/1/1989 | 03/03/2016 | 19/02/2016 |
| S.Smith | 1/1/1989 | 08/05/2016 | 19/02/2016 |
| S.Smith | 1/1/1989 | 18/05/2016 | 19/02/2016 |
| S.Smith | 1/1/1989 | 05/05/2019 | 20/06/2019 |
14. Number of people in the treatment and comparison group
* Adjudication results must be guilty to be considered for analysis, as an individual must have committed an initial offence and have been convicted for it in order for the reoffending rate to be measured.
** Inclusion criteria such as setting a maximum of 6 months between index date and intervention start date, or one record per individual per unique index date as per ‘multiple participation’ selection described on page 15.
15. Contact Points
Press enquiries should be directed to the Ministry of Justice press office. Other enquiries about the analysis should be directed to:
Annie Sorbie
Justice Data Lab team
Analytical Priority Projects
Ministry of Justice
10th Floor
102 Petty France
London
SW1H 9AJ
Tel: 07967 592178
E-mail: justice.datalab@justice.gov.uk
General enquiries about the statistical work of the Ministry of Justice can be e-mailed to: ESD@justice.gov.uk
General information about the official statistics system of the United Kingdom is available from https://gss.civilservice.gov.uk/policy-store/code-of-practice-for-statistics/
© Crown copyright 2023
This document is released under the Open Government Licence
Produced by the Ministry of Justice
Alternative formats are available on request from justice.datalab@justice.gov.uk