The Clink report (HTML version)
Published 28 July 2022
This analysis looked at the reoffending behaviour of 258 adults who participated in The Clink programme and includes individuals released from prison between 2017 and Q2 2020. Also included are sub-analyses for individuals in the 2018 cohort, the 2019 cohort, and a regional cohort of individuals who participated in The Clink programme at HMP Brixton. The overall results show that those who took part in The Clink intervention had a lower offending frequency compared to a matched comparison group. More people would be needed to determine the effect on the rate of reoffending and the time to first proven reoffence.
A previous analysis was published in July 2019, which covered participants from 2010 to 2016 inclusive, and can be found in the Justice Data Lab statistics collection on GOV.UK.
The Clink programme provides vocational training in catering and restaurant work. This gives prisoners skills and qualifications that help them secure employment on release.
The headline analysis in this report measured proven reoffences in a one-year period for a ‘treatment group’ of 258 offenders who received support some time between 2015 and 2020, and for a much larger ‘comparison group’ of similar offenders who did not receive it. The analysis estimates the impact of the support from The Clink on the reoffending behaviour of people who are similar to those in the treatment group. The support may have had a different impact on 93 other participants whose details were submitted but who did not meet the minimum criteria for analysis.
1. Overall measurements of the treatment and comparison groups
| For 100 typical people in the treatment group, the equivalent of: | For 100 typical people in the comparison group, the equivalent of: |
|---|---|
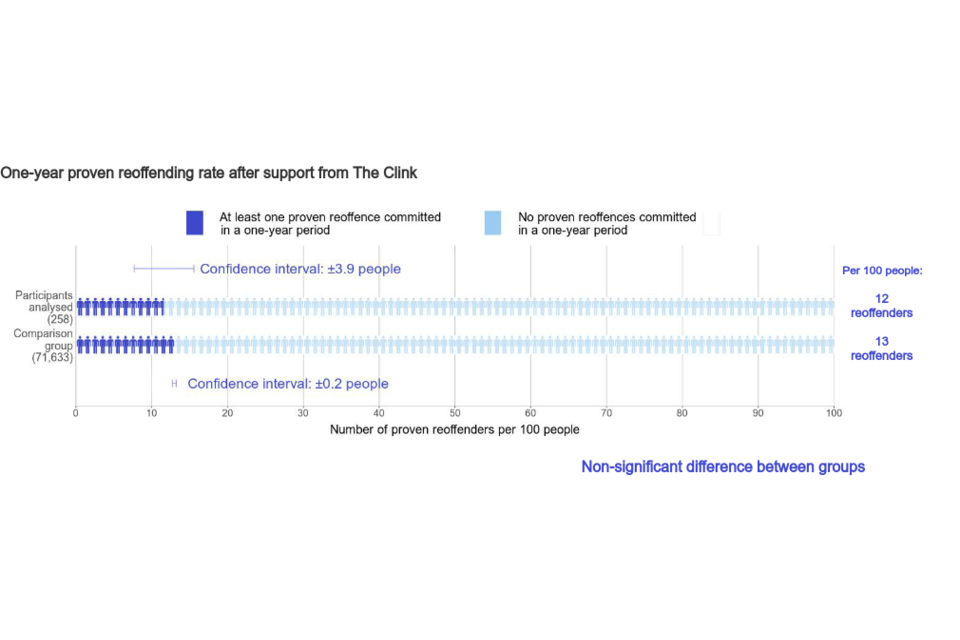
| 12 of the 100 people committed a proven reoffence within a one-year period (a rate of 12%), 1 person fewer than in the comparison group. | 13 of the 100 people committed a proven reoffence within a one-year period (a rate of 13%). |
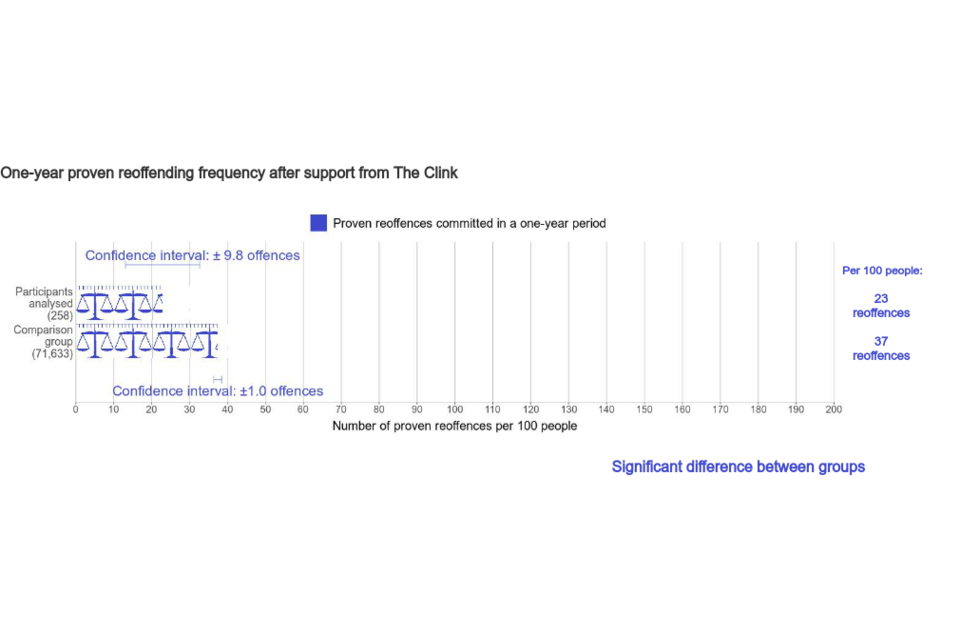
| 23 proven reoffences were committed by these 100 people during the year (a frequency of 0.2 offences offences per person), 15 offences fewer than in the comparison group. | 37 proven reoffences were committed by these 100 people during the year (a frequency of 0.4 offences per person). |
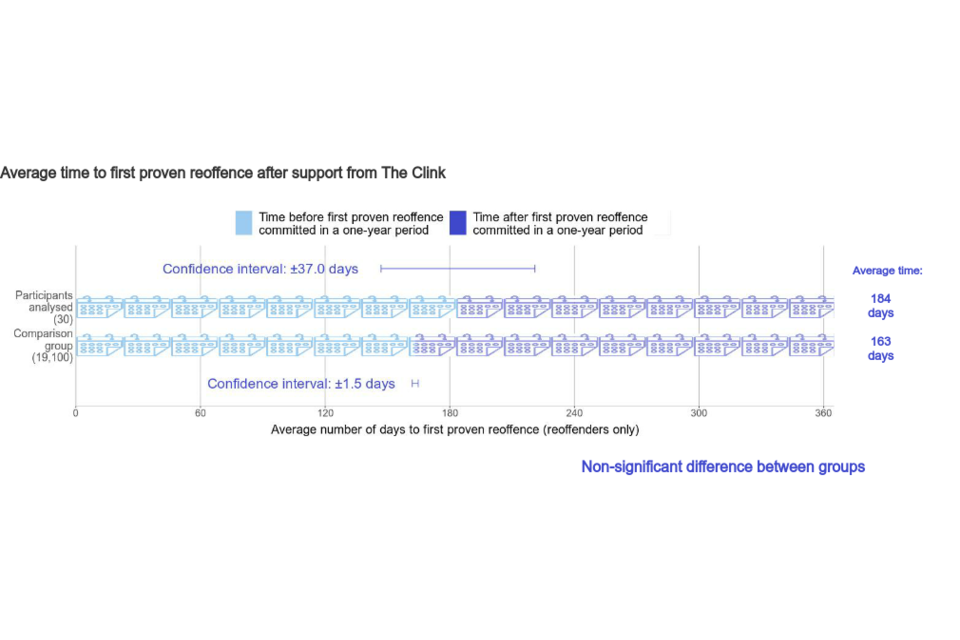
| 184 days was the average time before a reoffender committed their first proven reoffence, 21 days later than the comparison group. | 163 days was the average time before a reoffender committed their first proven reoffence. |
2. Overall estimates of the impact of the intervention
| For 100 typical people who receive support, compared with 100 similar people who do not receive it: |
|---|
| The number of people who commit a proven reoffence within one year after release could be lower by as many as 5 people, or higher by as many as 3 people. More people would need to be available for analysis in order to determine the direction of this difference. |
| The number of proven reoffences committed during the year could be lower by between 5 and 24 offences. This is a statistically significant result. |
| On average, the time before an offender committed their first proven reoffence could be shorter by as many as 16 days, or longer by as many as 58 days. More people would need to be analysed in order to determine the direction of this difference. |
Please note totals may not appear to equal the sum of the component parts due to rounding.
3. What you can and cannot say
What you can say about the one-year reoffending rate:
“This analysis does not provide clear evidence on whether support from The Clink increases or decreases the number of participants who commit a proven reoffence in a one-year period. There may be a number of reasons for this and it is possible that an analysis of more participants would provide such evidence.”
What you cannot say about the one-year reoffending rate:
“This analysis provides evidence that support from The Clink increases/decreases/has no effect on the reoffending rate of its participants.”
What you can say about the one-year reoffending frequency:
“This analysis provides evidence that support from The Clink may decrease the number of proven reoffences committed during a one-year period by its participants”
What you cannot say about the one-year reoffending frequency:
“This analysis provides evidence that support from The Clink increases/has no effect on the number of reoffences committed by its participants.”
What you can say about the time to first reoffence:
“This analysis does not provide clear evidence on whether support from The Clink shortens or lengthens the average time to first proven reoffence. There may be a number of reasons for this and it is possible that an analysis of more participants would provide such evidence.”
What you cannot say about the time to first reoffence:
“This analysis provides evidence that support from The Clink shortens/lengthens/has no effect on the average time to first proven reoffence for its participants.”
4. Figure 1: One-year proven reoffending rate after support from The Clink
5. Figure 2: One-year proven reoffending frequency after support from The Clink
6. Figure 3: Average time to first proven reoffence after support from The Clink
7. The Clink in their own words
“ The Clink Charity has been reducing reoffending for the past 10 years by providing vocational training in partnership with Her Majesty’s Prison and Probation Service, delivering accredited NVQ City and Guilds qualifications in:
• Food and Beverage Service
• Food Preparation and Cookery
• Basic Food Hygiene
• Barista Skills
• Horticulture
The Clink trains serving prisoners to gain skills and qualifications that will enable them to secure full-time employment upon release. It is one of the only organisations working on both sides of the wall ensuring smooth reintegration back into society. We do this using our 5-step integrated programme where we train the prisoners during the last 6 to 18 months of their sentence and then continue to support them for at least the first 12 months on the outside. This dramatically reduces the chance of a Clink Graduate reoffending.
There are 3 training restaurants in men’s prisons: HMP High Down, HMP Cardiff and HMP Brixton as well as 3 training projects in women’s prisons: a restaurant at HMP Styal, a production kitchen at HMP Downview and Clink Gardens at HMP Send. Our latest project, Clink Kitchens, is now live in 24 prisons.
Our objective is to reduce reoffending by providing structured learning in a real-life working environment, serving the public and working in prison kitchens. The Clink helps its students in prison develop life and employment skills in preparation for release into employment in the hospitality and horticulture industries. Trainees learn to take responsibility as individuals and to work as part of a team. They learn time keeping, teamwork, and customer service whilst developing their self-esteem and confidence.
Our focus is on supporting our graduates into employment. To enable this, our support workers provide an intensive support package before and after release helping with preparation for interviews, matching them with prospective employers and ensuring they are ready for work by helping them find accommodation, address debts, help with budgeting, support for substance misuse issues and generally developing their life skills.
We are proud that alongside our partner, Her Majesty’s Prison and Probation Service and in particular New Futures Network and the staff in the prisons in which we work, we continue to achieve good outcomes and to discharge our charitable mission resulting in fewer victims of crime and lowered costs to society. We do this in an economical way, while delivering our core values of compassion, professionalism and integrity, in an environment with so many daily challenges. The Clink changes attitudes, transforms lives and creates second chances and we have demonstrated what can be achieved when society collectively engages to help those who want and deserve a second chance.
”
8. Response from The Clink to the Justice Data Lab analysis
“ The Clink Charity is pleased to see that the overall measurement shows that reoffending is reducing with an absolute rate of 12% compared with the 15% in our last report.
The difficulty in showing impact in terms of percentage of reoffending is likely to be affected by the reduction in the reoffending rate in the comparison group and is likely to be a function of the Covid pandemic.
But even on this basis of a difficult data set we are extremely pleased to see we have achieved a statistically significant reduction in the number of offences which has halved since our last report, and which is 50% better than the rate for the comparison group.
The findings that we have a significant effect on the number of reoffences committed per person, and that our graduates receive fewer custodial sentences than others who reoffend, supports both the economic and the social argument for The Clink Charity approach saving the taxpayer money whilst ensuring fewer victims of crime.
We have expressed some concerns about the comparison group , although we recognise that the treatment and comparison groups are well matched. There is a significant shift in gender split between the last analysis and this analysis, and the group was assessed by HMPPS staff using OASys as having a much lower risk of being unemployed. Our main concern is the dramatic reduction in the comparison group reoffending rate which appears to have halved compared with the comparison group from our last analysis.
Unfortunately the JDL is unable to provide an answer as to why the comparison group reoffending rate has reduced to such an extent, a result that is not, of course, reflected in the national figure. However, we note that the treatment and comparison groups are well matched. We would note that our recruitment and treatment criteria have not changed and we would like to work with the JDL to get to the core of the changes and their statistical effects.
Of our presented data, 26% of our graduates were excluded from the assessment due largely, we understand, to them not being matched on the PNC database or the reoffending database. This is disappointing with 93 graduates being excluded from the 351 submitted.
Even given the exclusion of over a quarter of our graduates, and our misgivings regarding the comparison group data, and the reality that the pandemic has affected the justice system in many different ways, we believe that the report highlights the ongoing social and economic benefits of The Clink Charity’s work. We will continue to work with the MOJ to better understand the underlying data to inform future outcomes. ”
9. Results in detail
Four analyses were conducted in total, controlling for offender demographics and criminal history and the following risks and needs: thinking skills, attitudes, education, employment, financial management, relationships and behaviour.
- National analysis: treatment group matched to offenders across England and Wales using demographics, criminal history and individual risks and needs.
- 2018 analysis: treatment group matched to offenders across England and Wales using demographics, criminal history and individual risks and needs.
- 2019 analysis: treatment group matched to offenders across England and Wales using demographics, criminal history and individual risks and needs.
- HMP Brixton analysis: treatment group matched to offenders in London using demographics, criminal history and individual risks and needs.
The headline results in this report refer to the National analysis.
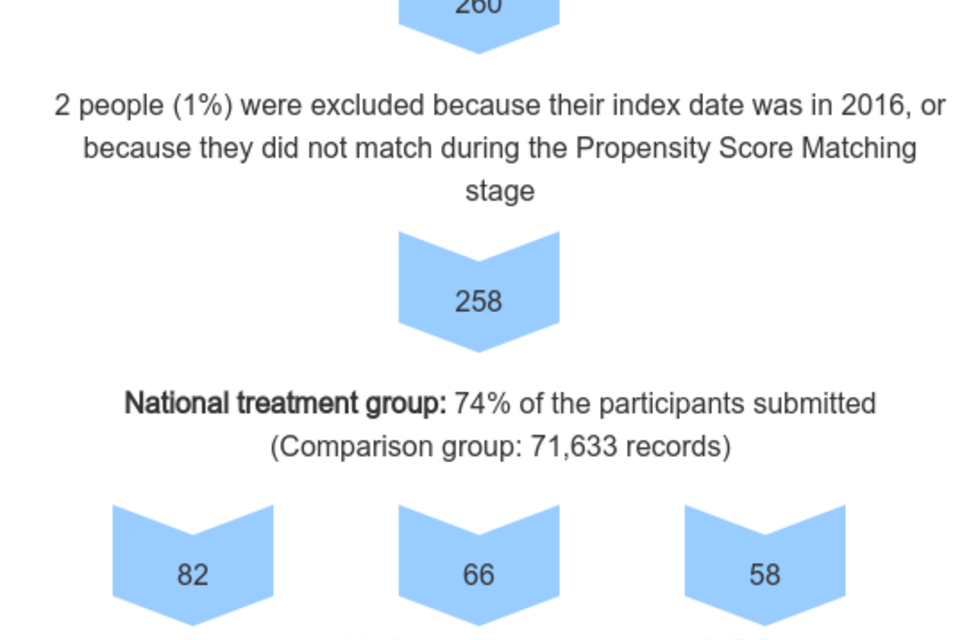
The sizes of the treatment and comparison groups for reoffending rate and frequency analyses are provided below. To create a comparison group that is as similar as possible to the treatment group, each person within the comparison group is given a weighting proportionate to how closely they match the characteristics of individuals in the treatment group. The calculated reoffending rate uses the weighted values for each person and therefore does not necessarily correspond to the unweighted figures.
| Analysis | Controlled for Region | Treatment Group Size | Comparison Group Size | Reoffenders in treatment group | Reoffenders in comparison group (weighted number) |
|---|---|---|---|---|---|
| National | 258 | 71,633 | 30 | 19,100 (9,305) | |
| 2018 | 82 | 14,350 | 7 | 2,942 (1,632) | |
| 2019 | 66 | 10,123 | 8 | 1,779 (1,305) | |
| HMP Brixton | Yes | 58 | 6,523 | 11 | 1,334 (1,248) |
In each analysis, three headline measures of one-year reoffending were analysed, as well as four additional measures (see results in Tables 1-7):
- Rate of reoffending
- Frequency of reoffending
- Time to first reoffence
- Rate of first reoffence by court outcome
- Frequency of reoffences by court outcome
- Rate of custodial sentencing for first reoffence
- Frequency of custodial sentencing
Significant results
There are three statistically significant results among the analyses for the headline analysis. These provide significant evidence that:
National
-
Participants commit fewer reoffences than non-participants
-
Participants who reoffend within a one-year period commit fewer triable-either-way offences than non-participants
-
Participants who reoffend within a one-year period receive fewer custodial sentences than non-participants
Tables 1-7 show the overall measures of reoffending. Rates are expressed as percentages and frequencies expressed per person. Tables 3 to 7 include reoffenders only.
9.1 Table 1: Proportion of people who committed a proven reoffence in a one-year period after support from The Clink compared with matched comparison groups
| Analysis | Number in treatment group | Number in comparison group | Treatment group rate (%) | Comparison group rate (%) | Estimated difference (% points) | Significant difference? | p-value |
|---|---|---|---|---|---|---|---|
| National | 258 | 71,633 | 12 | 13 | -5 to 3 | No | 0.50 |
| 2018 | 82 | 14,350 | 9 | 11 | -9 to 3 | No | 0.37 |
| 2019 | 66 | 10,123 | 12 | 13 | -9 to 7 | No | 0.85 |
| HMP Brixton | 58 | 6,523 | 19 | 19 | -11 to 10 | No | 0.97 |
9.2 Table 2: Number of proven reoffences committed in a one-year period by people who received support from The Clink compared with matched comparison groups
| Analysis | Number in treatment group | Number in comparison group | Treatment group frequency | Comparison group frequency | Estimated difference | Significant difference? | p-value |
|---|---|---|---|---|---|---|---|
| National | 258 | 71,633 | 0.23 | 0.37 | -0.24 to -0.05 | Yes | <0.01 |
| 2018 | 82 | 14,350 | 0.21 | 0.33 | -0.34 to 0.09 | No | 0.26 |
| 2019 | 66 | 10,123 | 0.21 | 0.36 | -0.32 to 0.02 | No | 0.09 |
| HMP Brixton | 58 | 6,523 | 0.40 | 0.50 | -0.36 to 0.14 | No | 0.39 |
9.3 Table 3: Average time to first proven reoffence in a one-year period for people who received support from The Clink, compared with matched comparison groups
| Analysis | Number in treatment group | Number in comparison group | Treatment group time | Comparison group time | Estimated difference | Significant difference? | p-value |
|---|---|---|---|---|---|---|---|
| National | 30 | 19,100 | 184 | 163 | -16 to 58 | No | 0.27 |
9.4 Table 4: Proportion of people supported by The Clink with first proven reoffence in a one-year period by court outcome, compared with similar non-participants (reoffenders only)
| Analysis | Number in treatment group | Number in comparison group | Court outcome | Treatment group rate (%) | Comparison group rate (%) | Estimated difference (% points) | Significant difference? | p-value |
|---|---|---|---|---|---|---|---|---|
| National | 30 | 19,100 | Either way | 67 | 67 | -18 to 18 | No | 0.98 |
9.5 Table 5: Number of proven reoffences in a one-year period by court outcome for people supported by The Clink, compared with similar non-participants (reoffenders only)
| Analysis | Number in treatment group | Number in comparison group | Court outcome | Treatment group frequency | Comparison group frequency | Estimated difference | Significant difference? | p-value |
|---|---|---|---|---|---|---|---|---|
| National | 30 | 19,100 | Either way | 1.03 | 1.87 | -1.21 to -0.46 | Yes | <0.01 |
| Summary | 0.67 | 0.87 | -0.56 to 0.15 | No | 0.25 |
9.6 Table 6: Proportion of people who received a custodial sentence for their first proven reoffence after support from The Clink, compared with similar non-participants (reoffenders only)
| Analysis | Number in treatment group | Number in comparison group | Treatment group rate (%) | Comparison group rate (%) | Estimated difference (% points) | Significant difference? | p-value |
|---|---|---|---|---|---|---|---|
| National | 30 | 19,100 | 33 | 47 | -32 to 4 | No | 0.12 |
9.7 Table 7: Number of custodial sentences received in a one-year period by people who received support from The Clink, compared to similar non-participants (reoffenders only)
| Analysis | Number in treatment group | Number in comparison group | Treatment group frequency | Comparison group frequency | Estimated difference | Significant difference? | p-value |
|---|---|---|---|---|---|---|---|
| National | 30 | 19,100 | 0.63 | 1.49 | -1.20 to -0.51 | Yes | <0.01 |
10. Profile of the treatment group
The Clink programme being analysed for this report took place in five prisons: HMP Cardiff (Wales), HMP High Down (South East England), HMP Brixton (London), HMP Styal (North West England), and HMP Prescoed (Wales). The programme has operated in HMP High Down since 2010, in HMP Cardiff from 2012 to 2017, in HMP Brixton since 2014, in HMP Styal since 2015, and in HMP Prescoed since 2018. The participants all engaged with The Clink during a custodial sentence, and were selected based on a set of criteria following their application to the programme. Among other requirements, participants had to be motivated to train and work in the catering trade. Information on those who were included in the treatment group for the headline analysis is below, compared with the characteristics of those who could not be included in the analysis.
| Participants included in analysis (258 offenders in National analysis) | Participants not included in analysis (45 offenders with available data) | |
|---|---|---|
| Sex | ||
| Male | 65% | 64% |
| Female | 35% | 36% |
| Ethnicity | ||
| White | 67% | 76% |
| Black | 22% | 16% |
| Asian | 7% | 4% |
| Other | 0% | 2% |
| Unknown | 4% | 2% |
| UK national | ||
| UK nationality | 95% | 87% |
| Foreign nationality | 3% | 9% |
| Unknown nationality | 3% | 4% |
| Prison sentence length | ||
| Less than 1 year | 1% | |
| 1 year to less than 4 years | 55% | |
| 4 to 10 years | 39% | |
| More than 10 years | 1% | |
| Imprisonment for Public Protection | 1% | |
| Mandatory Life Prisoner | 3% |
Information on index offences for the 45 participants not included in the analysis is not available, as they could not be linked to a suitable sentence.
For 48 people without any records in the reoffending database, no personal information is available.
Please note totals may not appear to equal the sum of the component parts due to rounding.
Information on individual risks and needs was available for 201 people in the overall treatment group (78%), recorded near to the time of their original conviction.
- 46% had some or significant problems with problem solving skills
- 37% had some or significant problems with their activities encouraging offending behaviour
- 33% had some or significant problems with their financial situation
Year cohorts are defined by the year of the index date, such that two individuals in the same cohort may have participated in The Clink programme in different years, but exited prison in the same year.
There are some considerable differences between the treatment individuals included in this analysis, and the treatment individuals included in the previous analysis (July 2019), and these differences are important to consider when interpreting and comparing the results of these analyses.
First, the treatment group in the previous analysis consisted of approximately 90% male individuals, whereas for the present analysis the treatment group consists of approximately 65% male individuals. This is driven by a larger sample of treatment individuals from HMP Styal (a female prison) and a smaller sample of treatment individuals from HMP High Down (a male prison) in this anaylsis, compared to the previous analysis. This indicates that the results are not directly comparable because the composition of the treatment groups is different in terms of location and gender, in addition to individuals being released from prisons across different years.
Second, the proportion of treatment individuals who were unemployed or at risk of unemployment on release (based on their OASys assessments prior to participation in the programme) is approximately 28% for the individuals in this analysis, compared to approximately 43% for the previous analysis. The Clink theory of change is based on the idea that strong employment prospects can reduce an individual’s propensity to reoffend. Therefore, the reduced risk of unemployment for individuals in this analysis may explain why the one-year proven reoffending rate for the comparison group is much smaller in this analysis compared to the previous analysis, and why a statistically significant result was not produced for this measure in this analysis.
11. Sensitivity analysis
To assess the impact of the COVID pandemic on reoffending outcomes due to delays in the Criminal Courts, a sensitivity analysis was conducted on the headline analysis. The standard 6 month waiting period to allow for reoffences to be convicted was extended to a 12 month window. The intention of this extension was to investigate the impact of allowing any extra time it may take for case outcome to be decided by the courts, due to the increased courts backlog arising due to the COVID pandemic.
This sensitivity analysis did not result in a significantly greater number of reoffenders for the headline analysis, and therefore the definition of the one-year proven reoffending rate was not changed to encompass a longer waiting period.
To understand why, some sense checks were performed by identifying the most common offence types associated with those receiving support from The Clink and determining the impact of the COVID pandemic on volumes and timeliness of court outcomes for these offences.
Across both this analysis and the previous Clink analysis from July 2019, the most common index offence categories are drug offences, violence against the person, and theft offences. The most common reoffence categories in both studies also included drug offences and theft offences, with violence against the person offences contributing a much smaller proportion among reoffences.
The following trends in recorded offence volumes and timeliness of court outcomes (derived from “Crime Outcomes in England and Wales”, published by the Home Office) over the two-year period from 1 April 2019 to 31 March 2021 (with the first national lockdown starting approximately halfway through this period) were observed:
-
For drug offences, there was a large increase in volume across both years (+13.1% from the year ending March 2020 to the year ending March 2021), but with the proportion of offences taking more than 100 days from offence to court outcome falling by 3 percentage points between 2020 and 2021, from 28% to 25%
-
For violence against the person, there was a small increase in volume, mostly from 2019 to 2020 (+6.7% from the year ending March 2019 to the year ending March 2020), with the proportion of outcomes taking over 100 days rising by 1 percentage point between 2020 to 2021, from 16% to 17%
-
For theft offences, there was a significant reduction in volume across both years (-32.5% from the year ending March 2020 to the year ending March 2021), but with the proportion of outcomes taking over 100 days rising by 3 percentage points between 2020 to 2021 to 12%
It can be seen that the trends across these offence types are mixed, indicating that the effects of the COVID pandemic on offending behaviour and the criminal justice system are complex. The overall effect is unclear from this analysis, but there is no strong evidence to suggest that a much higher proportion of reoffences would have been captured by extending the waiting period, although it is possible that some potential reoffences are still to be dealt with by the courts and hence have not been captured.
12. Matching the treatment and comparison groups
The analyses matched a comparison group to the treatment group. A summary of the matching quality is as follows:
- All variables in the national model were well matched.
- Most variables in the 2018 cohort model were well matched. There was poor matching for: some or significant problems with attitude towards education.
- Most variables in the 2019 cohort model were well matched. There was poor matching for: significant problems with attitude to employment; significant problems with reading, writing, and/or numeracy; and significant problems with attitude towards staff.
- Most variables in the HMP Brixton model were well matched. There was poor matching for: significant problems with attitude to employment; significant problems with reading, writing, and/or numeracy; some or significant problems with family relationships; some or significant problems with procriminal attitudes; and significant problems with attitude towards education.
Further details of group characteristics and matching quality, including risks and needs recorded by the Offender Assessment System (OASys), can be found in the Excel annex accompanying this report.
This report is also supplemented by a general annex, which answers frequently asked questions about Justice Data Lab analyses and explains the caveats associated with them.
13. Numbers of people in the treatment and comparison groups
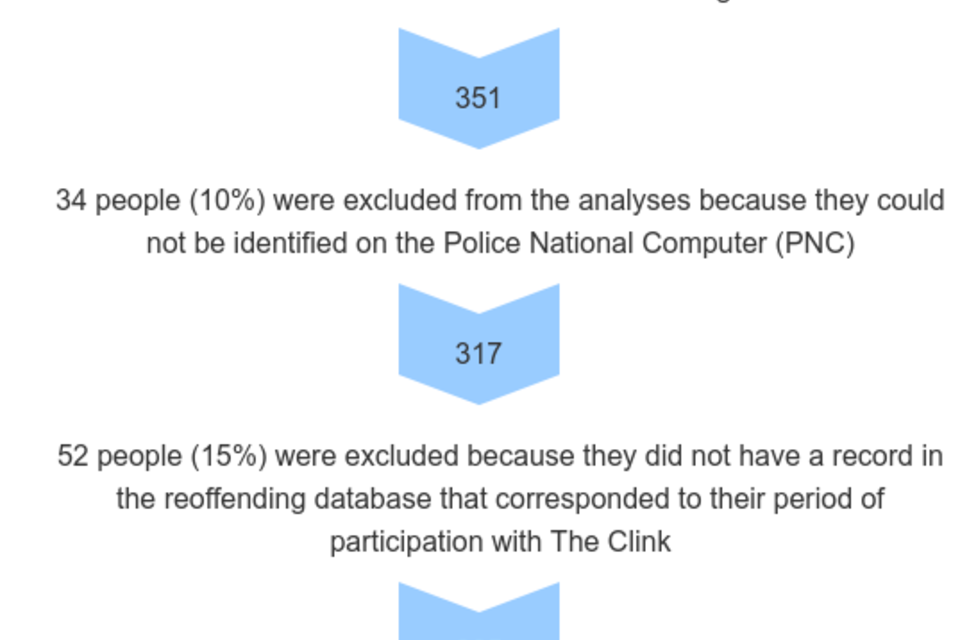
14. Contact Points
Press enquiries should be directed to the Ministry of Justice press office. Other enquiries about the analysis should be directed to:
Annie Sorbie
Justice Data Lab team
Analytical Priority Projects
Ministry of Justice
7th Floor
102 Petty France
London
SW1H 9AJ
Tel: 07967 592178
E-mail: justice.datalab@justice.gov.uk
General enquiries about the statistical work of the Ministry of Justice can be e-mailed to: ESD@justice.gov.uk
General information about the official statistics system of the United Kingdom is available from https://gss.civilservice.gov.uk/policy-store/code-of-practice-for-statistics/
© Crown copyright 2022
This document is released under the Open Government Licence
Produced by the Ministry of Justice
Alternative formats are available on request from justice.datalab@justice.gov.uk
