HMPPS CFO report (HTML version)
Published 25 April 2024

© Crown copyright 2024
This publication is licensed under the terms of the Open Government Licence v3.0 except where otherwise stated. To view this licence, visit nationalarchives.gov.uk/doc/open-government-licence/version/3 or write to the Information Policy Team, The National Archives, Kew, London TW9 4DU, or email: psi@nationalarchives.gov.uk.
Where we have identified any third party copyright information you will need to obtain permission from the copyright holders concerned.
This publication is available at https://www.gov.uk/government/statistics/justice-data-lab-statistics-april-2024/hmpps-cfo-report-html-version
This analysis looked at the reoffending behaviour of men and women who participated in His Majesty’s Prison and Probation Service’s (HMPPS) Creating Future Opportunities (CFO) programme sometime between 2015 and 2021 (concluding in or after August 2018). The overall results show that men who took part in the programme in the community were less likely to reoffend, reoffended less frequently and took longer to reoffend than those who did not take part. These results were statistically significant. A previous analysis was published in July 2019, covering a separate cohort and a variation of the programme. This can be found in the Justice Data Lab statistics collection on GOV.UK.
HMPPS CFO intervention is based on one-to-one case management, with the aim of increasing the employability of participants. The programme operates in three settings: in the community, in custody and through the gate (TTG).
The headline analysis in this report measured proven reoffences in a one-year period for a ‘treatment group’ of 3,520 male offenders who began receiving support in the community sometime between 2015 and 2021 (concluding in or after August 2018), and for a much larger ‘comparison group’ of similar offenders who did not receive it. The analysis estimates the impact of the support from HMPPS CFO on the reoffending behaviour. Additional analyses were also conducted on male and female participants who received support from HMPPS CFO in each of the settings outlined above.
1. Overall measurements of the treatment and comparison groups
| For 100 typical men in the treatment group, the equivalent of: | For 100 typical men in the comparison group, the equivalent of: |
|---|---|
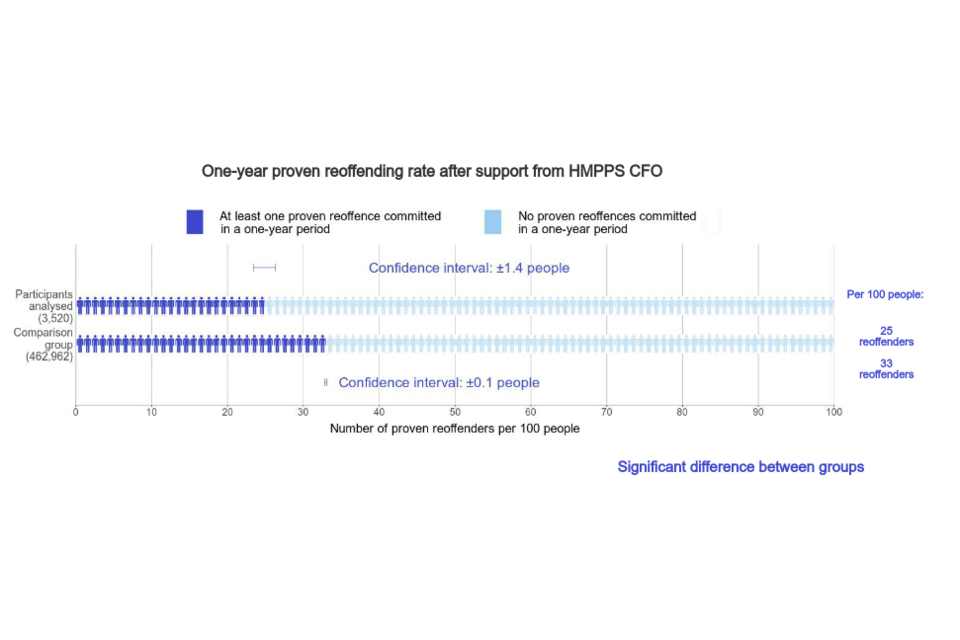
| 25 of the 100 men committed a proven reoffence within a one-year period (a rate of 25%), 8 men fewer than in the comparison group. | 33 of the 100 men committed a proven reoffence within a one-year period (a rate of 33%). |
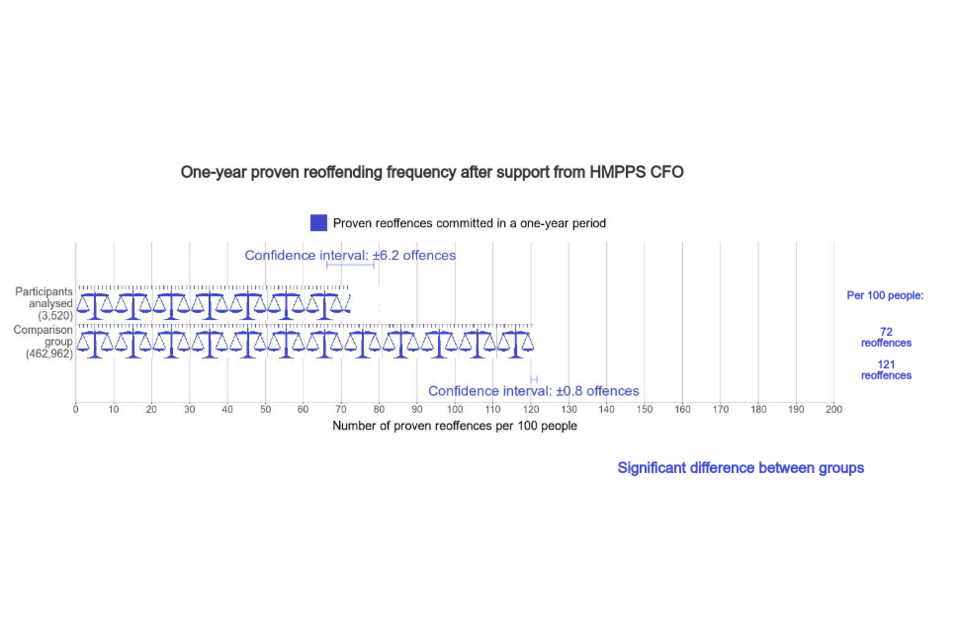
| 72 proven reoffences were committed by these 100 men during the year (a frequency of 0.7 offences offences per person), 48 offences fewer than in the comparison group. | 121 proven reoffences were committed by these 100 men during the year (a frequency of 1.2 offences per person). |
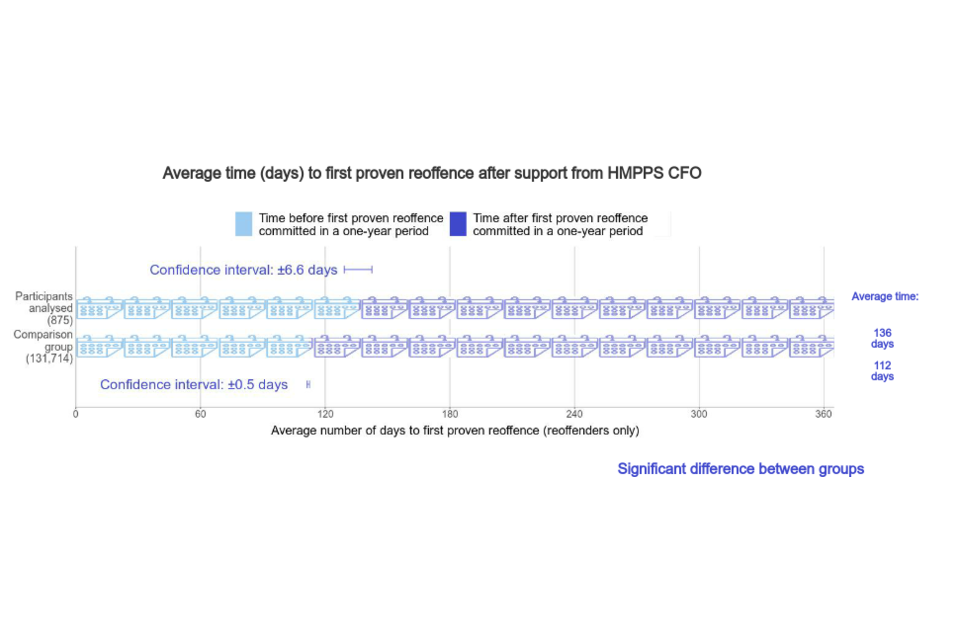
| 136 days was the average time before a reoffender committed their first proven reoffence, 24 days later than the comparison group. | 112 days was the average time before a reoffender committed their first proven reoffence. |
2. Overall estimates of the impact of the intervention
For 100 typical men who receive support, compared with 100 similar men who do not:
The number of men who commit a proven reoffence within one year after release could be lower by between 7 and 10 men. This is a statistically significant result.
The number of proven reoffences committed during the year could be lower by between 42 and 55 offences. This is a statistically significant result.
On average, the time before an offender committed their first proven reoffence could be longer by between 17 and 31 days. This is a statistically significant result.
Please note totals may not appear to equal the sum of the component parts due to rounding.
What you can say about the one-year reoffending rate:
“This analysis provides evidence that support from HMPPS CFO may decrease the number of proven reoffenders during a one-year period.”
What you cannot say about the one-year reoffending rate:
“This analysis provides evidence that support from HMPPS CFO increases/has no effect on the reoffending rate of its participants.”
What you can say about the one-year reoffending frequency:
“This analysis provides evidence that support from HMPPS CFO may decrease the number of proven reoffences committed during a one-year period by its participants.”
What you cannot say about the one-year reoffending frequency:
“This analysis provides evidence that support from HMPPS CFO increases/has no effect on the number of reoffences committed by its participants.”
What you can say about the time to first reoffence:
“This analysis provides evidence that support from HMPPS CFO may lengthen the average time to first proven reoffence for its participants.”
What you cannot say about the time to first reoffence:
“This analysis provides evidence that support from HMPPS CFO decreases/has no effect on the average time to first reoffence for its participants.”
3. Figure 1: One-year proven reoffending rate after support from HMPPS CFO
4. Figure 2: One-year proven reoffending frequency after support from HMPPS CFO
5. Figure 3: Average time to first proven reoffence after support from HMPPS CFO
6. HMPPS CFO in their own words
“His Majesty’s Prison and Probation Service’s (HMPPS) Creating Future Opportunities (CFO) service providers work with offenders in prison and the community, to help offenders access mainstream services, with the aim of gaining skills and employment and the intention to reduce reoffending. The provision takes place in both prison and the community in England, with a number receiving support ‘through the gate’. The CFO programme targets offenders with multiple needs. Entry to the programme is voluntary and participants self-refer or are targeted by the providers, with the only conditions being that participants must not be in employment, eligible to work in the UK and within the last three years of their sentence (for those individuals in custody). Referrals are usually made by the prison offender management unit or probation practitioners. The aim of the programme is to make offenders without employment more employable. This is delivered through soft outcomes to prepare the participant, then brokering employment, education or training for the participant. On entering employment, education or training, the participant’s case is generally closed and no further intervention is given.
The CFO intervention model used was based on one-to-one case management. The case manager assessed and enrolled the participant, then set up objectives and action plans based on the individual needs identified in the assessment. The activity with the participant was set along a specific pathway, where core activity was prominent throughout the participant’s time on the programme. This core activity took place as and when it was required by the participant and included: motivation, financial advice, disclosure advice, CVs and Industry Specific Cards and certificates such as Health and Safety, Construction Site Certification Scheme (CSCS). At the start of the pathway, the case manager provides specialist support referrals (and ensures attendance), mentoring and/or work placements. This is followed by up-skilling the participants with training, educational and/or vocational courses and/or voluntary employment. Finally, the case manager brokers a job interview and employment for the participant. Once the participant is in employment, the case worker ceases to work with the participant.
The participants are worked with for as long as they are in the CJS and in a location where there is CFO delivery – there is no set amount of time the participant is worked with neither on a daily/weekly basis nor the length of time on the programme.
CFO delivery and pathway described above is consistent across all CFO providers with one case record for each participant which is transferred around providers as the participant moves around the CJS estate in England. This promotes a seamless transition with regards to delivery as the participants transfers from prison to prison and then through the gate into the community. A record of the participants’ initial assessment, outstanding and completed objectives and the provision given is accessible and updated by each case worker working with each participant.”
7. Response from HMPPS CFO to the Justice Data Lab analysis
“His Majesty’s Prison and Probation Service’s (HMPPS) Creating Future Opportunities (CFO) would like to thank the Justice Data Lab for continuing to support us in developing an evidence base for the CFO programme. We welcome the findings and thank all the analysts for their hard work.
We are pleased to note that the CFO programme has continued to have an effect on the reoffending rates, specifically for this period for both male and female participants in the community and males going through the gate (TTG) including a reduction in the number of proven offences committed for all male participants in prison, TTG and the community along with female participants in the community, as well as having an increase in the average days to the first proven offence for all male participants on the programme.
We welcome the findings pertaining to the female cohort – the first time JDL have been able to analyse the effect the CFO programme has had on its female participants. It is assumed low numbers of participants have made it difficult to find statistical significance between the female subgroups and the matched cohort. Nevertheless, it is encouraging to be able to identify the differences and allows us to develop the CFO programme for future participants.
The existing CFO programme has been funded by European Social Funding, the funding coming to an end in December 2023. Previous JDL analysis that demonstrated that the CFO programme reduces reoffending has been instrumental in the CFO being able to secure additional funding from outside mainstream MOJ budgets for new programmes, with the next programme CFO Evolution due to commence delivery in August 2024. Without JDL providing the evidence base, the CFO would have struggled to prove that we reduce reoffending and are able to deliver a programme that is value for money, demonstrating that the savings made by reducing reoffending are greater than the cost of the programme.”
8. Results in detail
Six analyses were conducted in total, controlling for offender demographics and criminal history and the following risks and needs: employment history, financial history, education, relationships, drug and alcohol use, mental health, thinking skills, and attitudes towards offending.
Male Community analysis: treatment group matched to offenders across England using demographics, criminal history and individual risks and needs.
Male Prison analysis: treatment group matched to offenders across England using demographics, criminal history and individual risks and needs.
Male TTG analysis: treatment group matched to offenders across England using demographics, criminal history and individual risks and needs.
Female Community analysis: treatment group matched to offenders across England using demographics, criminal history and individual risks and needs.
Female Prison analysis: treatment group matched to offenders across England using demographics, criminal history and individual risks and needs.
Female TTG analysis: treatment group matched to offenders across England using demographics, criminal history and individual risks and needs.
The headline results in this report refer to the Male Community analysis.
The sizes of the treatment and comparison groups for reoffending rate and frequency analyses are provided below. To create a comparison group that is as similar as possible to the treatment group, each person within the comparison group is given a weighting proportionate to how closely they match the characteristics of individuals in the treatment group. The calculated reoffending rate uses the weighted values for each person and therefore does not necessarily correspond to the unweighted figures.
| Analysis | Treatment Group Size | Comparison Group Size | Reoffenders in treatment group | Reoffenders in comparison group (weighted number) |
|---|---|---|---|---|
| Male Community | 3,520 | 462,962 | 875 | 131,714 (152,609) |
| Male Prison | 2,906 | 267,885 | 982 | 120,323 (86,985) |
| Male TTG | 2,401 | 270,001 | 792 | 120,417 (95,775) |
| Female Community | 742 | 297,440 | 149 | 70,123 (77,769) |
| Female Prison | 572 | 25,167 | 201 | 12,964 (8,300) |
| Female TTG | 142 | 18,278 | 50 | 8,721 (7,121) |
In each analysis, three headline measures of one-year reoffending were analysed, as well as four additional measures (see results in Tables 1-7):
- Rate of reoffending
- Frequency of reoffending
- Time to first reoffence
- Rate of first reoffence by court outcome
- Frequency of reoffences by court outcome
- Rate of custodial sentencing for first reoffence
- Frequency of custodial sentencing
9. Significant results
26 measures show a statistically significant result. These provide significant evidence that:
Male community
-
Participants are less likely to commit a reoffence within a one-year period than non-participants.
-
Participants commit fewer reoffences within a one-year period than nonparticipants.
-
Participants who reoffend within a one-year period commit their first proven reoffence later than non-participants.
-
Participants who reoffend within a one-year period are more likely to commit an indictable-only offence for their first reoffence than non-participants.
-
Participants who reoffend within a one-year period commit more indictableonly offences than non-participants.
-
Participants who reoffend within a one-year period commit fewer triable-eitherway offences than non-participants.
-
Participants who reoffend within a one-year period commit fewer summary offences than non-participants.
-
Participants who reoffend within a one-year period receive fewer custodial sentences than non-participants.
Male prison
-
Participants commit fewer reoffences within a one-year period than nonparticipants.
-
Participants who reoffend within a one-year period commit their first proven reoffence later than non-participants.
-
Participants who reoffend within a one-year period commit fewer triable-eitherway offences than non-participants.
-
Participants who reoffend within a one-year period commit fewer summary offences than non-participants.
-
Participants who reoffend within a one-year period receive fewer custodial sentences than non-participants.
Male TTG
-
Participants are less likely to commit a reoffence within a one-year period than non-participants.
-
Participants commit fewer reoffences within a one-year period than nonparticipants.
-
Participants who reoffend within a one-year period commit their first proven reoffence later than non-participants.
-
Participants who reoffend within a one-year period are less likely to commit a triable-either-way offence for their first reoffence than non-participants.
-
Participants who reoffend within a one-year period are more likely to commit a summary offence for their first reoffence than non-participants.
-
Participants who reoffend within a one-year period commit fewer triableeither-way offences than non-participants.
-
Participants who reoffend within a one-year period receive fewer custodial sentences than non-participants.
Female community
-
Participants are less likely to commit a reoffence within a one-year period than non-participants.
-
Participants commit fewer reoffences within a one-year period than nonparticipants.
-
Participants who reoffend within a one-year period commit fewer triable-eitherway offences than non-participants.
-
Participants who reoffend within a one-year period commit fewer summary offences than non-participants.
-
Participants who reoffend within a one-year period are more likely to receive a custodial sentence for their first reoffence than non-participants.
Female TTG
- Participants who reoffend within a one-year period commit fewer summary offences than non-participants.
Tables 1-7 show the overall measures of reoffending. Rates are expressed as percentages and frequencies expressed per person. Tables 3 to 7 include reoffenders only.
9.1 Table 1: Proportion of people who committed a proven reoffence in a one-year period (reoffending rate) after support from HMPPS CFO compared with a matched comparison group
| Analysis | Number in treatment group | Number in comparison group | Treatment group rate (%) | Comparison group rate (%) | Estimated difference (% points) | Significant difference? | p-value |
|---|---|---|---|---|---|---|---|
| Male Community | 3,520 | 462,962 | 25 | 33 | -10 to -7 | Yes | <0.01 |
| Male Prison | 2,906 | 267,885 | 34 | 32 | 0 to 3 | No | 0.13 |
| Male TTG | 2,401 | 270,001 | 33 | 35 | -4 to -1 | Yes | 0.01 |
| Female Community | 742 | 297,440 | 20 | 26 | -9 to -3 | Yes | <0.01 |
| Female Prison | 572 | 25,167 | 35 | 33 | -2 to 6 | No | 0.29 |
| Female TTG | 142 | 18,278 | 35 | 39 | -12 to 4 | No | 0.35 |
9.2 Table 2: Number of proven reoffences committed in a one-year period (reoffending frequency - offences per person) by people who received support from HMPPS CFO compared with a matched comparison group
| Analysis | Number in treatment group | Number in comparison group | Treatment group frequency | Comparison group frequency | Estimated difference | Significant difference? | p-value |
|---|---|---|---|---|---|---|---|
| Male Community | 3,520 | 462,962 | 0.72 | 1.21 | -0.55 to -0.42 | Yes | <0.01 |
| Male Prison | 2,906 | 267,885 | 1.16 | 1.29 | -0.22 to -0.04 | Yes | 0.01 |
| Male TTG | 2,401 | 270,001 | 1.08 | 1.41 | -0.43 to -0.24 | Yes | <0.01 |
| Female Community | 742 | 297,440 | 0.63 | 1.12 | -0.64 to -0.34 | Yes | <0.01 |
| Female Prison | 572 | 25,167 | 1.78 | 1.76 | -0.29 to 0.34 | No | 0.88 |
| Female TTG | 142 | 18,278 | 1.60 | 2.11 | -1.13 to 0.10 | No | 0.10 |
9.3 Table 3: Average time (days) to first proven reoffence in a one-year period for people who received support from HMPPS CFO, compared with a matched comparison group
| Analysis | Number in treatment group | Number in comparison group | Treatment group time (days) | Comparison group time (days) | Estimated difference | Significant difference? | p-value |
|---|---|---|---|---|---|---|---|
| Male Community | 875 | 131,714 | 136 | 112 | 17 to 31 | Yes | <0.01 |
| Male Prison | 982 | 120,323 | 141 | 130 | 5 to 18 | Yes | <0.01 |
| Male TTG | 792 | 120,417 | 155 | 127 | 21 to 35 | Yes | <0.01 |
| Female Community | 149 | 70,123 | 112 | 102 | -7 to 27 | No | 0.25 |
| Female Prison | 201 | 12,964 | 113 | 104 | -4 to 23 | No | 0.17 |
| Female TTG | 50 | 8,721 | 107 | 99 | -23 to 38 | No | 0.64 |
9.4 Table 4: Proportion of people supported by HMPPS CFO with first proven reoffence in a one-year period (reoffending rate) by court outcome, compared with similar non-participants (reoffenders only)
| Analysis | Number in treatment group | Number in comparison group | Court outcome | Treatment group rate (%) | Comparison group rate (%) | Estimated difference (% points) | Significant difference? | p-value |
|---|---|---|---|---|---|---|---|---|
| Male Community | 875 | 131,711 | Indictable | 4 | 2 | 1 to 3 | Yes | <0.01 |
| Either way | 58 | 60 | -4 to 2 | No | 0.49 | |||
| Summary | 34 | 34 | -3 to 3 | No | 0.89 | |||
| Male Prison | 982 | 120,323 | Indictable | 4 | 3 | 0 to 3 | No | 0.06 |
| Either way | 65 | 67 | -5 to 1 | No | 0.20 | |||
| Summary | 29 | 27 | 0 to 6 | No | 0.06 | |||
| Male TTG | 792 | 120,417 | Indictable | 3 | 3 | -1 to 2 | No | 0.50 |
| Either way | 62 | 65 | -7 to 0 | Yes | 0.04 | |||
| Summary | 32 | 28 | 1 to 7 | Yes | 0.02 | |||
| Female Community | 149 | 70,118 | Either way | 70 | 63 | -1 to 14 | No | 0.08 |
| Summary | 23 | 29 | -13 to 1 | No | 0.09 | |||
| Female Prison | 201 | 12,964 | Either way | 80 | 79 | -4 to 7 | No | 0.63 |
| Summary | 16 | 16 | -5 to 6 | No | 0.82 | |||
| Female TTG | 50 | 8,721 | Either way | 80 | 75 | -7 to 16 | No | 0.41 |
9.5 Table 5: Number of proven reoffences in a one-year period (reoffending frequency) by court outcome for people supported by HMPPS CFO, compared with similar non-participants (reoffenders only)
| Analysis | Number in treatment group | Number in comparison group | Court outcome | Treatment group frequency | Comparison group frequency | Estimated difference | Significant difference? | p-value |
|---|---|---|---|---|---|---|---|---|
| Male Community | 875 | 131,711 | Indictable | 0.08 | 0.04 | 0.01 to 0.06 | Yes | 0.01 |
| Either way | 1.70 | 2.18 | -0.65 to -0.31 | Yes | <0.01 | |||
| Summary | 1.05 | 1.28 | -0.32 to -0.13 | Yes | <0.01 | |||
| Male Prison | 982 | 120,323 | Indictable | 0.09 | 0.08 | -0.02 to 0.04 | No | 0.41 |
| Either way | 2.25 | 2.61 | -0.55 to -0.19 | Yes | <0.01 | |||
| Summary | 1.04 | 1.14 | -0.19 to 0.00 | Yes | 0.04 | |||
| Male TTG | 792 | 120,417 | Indictable | 0.08 | 0.07 | -0.02 to 0.04 | No | 0.40 |
| Either way | 1.95 | 2.55 | -0.79 to -0.42 | Yes | <0.01 | |||
| Summary | 1.14 | 1.22 | -0.20 to 0.02 | No | 0.10 | |||
| Female Community | 149 | 70,118 | Either way | 2.30 | 2.92 | -1.18 to -0.06 | Yes | 0.03 |
| Summary | 0.65 | 1.08 | -0.65 to -0.22 | Yes | <0.01 | |||
| Female Prison | 201 | 12,964 | Either way | 4.20 | 4.27 | -0.73 to 0.59 | No | 0.83 |
| Summary | 0.71 | 0.84 | -0.30 to 0.04 | No | 0.14 | |||
| Female TTG | 50 | 8,721 | Either way | 3.88 | 4.23 | -1.80 to 1.09 | No | 0.62 |
| Summary | 0.48 | 0.97 | -0.71 to -0.27 | Yes | <0.01 |
9.6 Table 6: Proportion of people who received a custodial sentence for their first proven reoffence after support from HMPPS CFO, compared with similar non-participants (reoffenders only)
| Analysis | Number in treatment group | Number in comparison group | Treatment group rate (%) | Comparison group rate (%) | Estimated difference (% points) | Significant difference? | p-value |
|---|---|---|---|---|---|---|---|
| Male Community | 875 | 131,711 | 38 | 36 | -2 to 5 | No | 0.31 |
| Male Prison | 982 | 120,323 | 53 | 54 | -4 to 2 | No | 0.44 |
| Male TTG | 792 | 120,417 | 52 | 52 | -4 to 3 | No | 0.79 |
| Female Community | 149 | 70,118 | 36 | 27 | 0 to 16 | Yes | 0.04 |
| Female Prison | 201 | 12,964 | 43 | 45 | -9 to 5 | No | 0.58 |
| Female TTG | 50 | 8,721 | 46 | 43 | -11 to 17 | No | 0.69 |
9.7 Table 7: Number of custodial sentences received in a one-year period by people who received support from HMPPS CFO, compared to similar non-participants (reoffenders only)
| Analysis | Number in treatment group | Number in comparison group | Treatment group frequency | Comparison group frequency | Estimated difference | Significant difference? | p-value |
|---|---|---|---|---|---|---|---|
| Male Community | 875 | 131,711 | 1.28 | 1.61 | -0.48 to -0.18 | Yes | <0.01 |
| Male Prison | 982 | 120,323 | 1.91 | 2.31 | -0.56 to -0.22 | Yes | <0.01 |
| Male TTG | 792 | 120,417 | 1.83 | 2.26 | -0.61 to -0.25 | Yes | <0.01 |
| Female Community | 149 | 70,118 | 1.50 | 1.66 | -0.68 to 0.35 | No | 0.53 |
| Female Prison | 201 | 12,964 | 2.76 | 2.96 | -0.71 to 0.32 | No | 0.45 |
| Female TTG | 50 | 8,721 | 2.42 | 2.92 | -1.35 to 0.36 | No | 0.25 |
10. Profile of the treatment group
The programme is delivered throughout England, with delivery occurring in the community, in custody and through the gate (TTG). The majority of the treatment group began receiving support whilst in the community. Participants are selected based on a needs assessment conducted by HMPPS CFO. All participants must have employment needs, and additionally a combination of other serious needs, for example substance misuse, accommodation, education, or extensive criminal histories.
| Participants included in analysis (10,283 offenders) | Participants not included in analysis (6,153 offenders with available data) | |
|---|---|---|
| Sex | ||
| Male | 86% | 87% |
| Female | 14% | 13% |
| Ethnicity | ||
| White | 81% | 79% |
| Black | 12% | 12% |
| Asian | 4% | 5% |
| Other | 1% | 0% |
| Unknown | 2% | 3% |
| UK national | ||
| UK nationality | 94% | 91% |
| Foreign nationality | 4% | 5% |
| Unknown nationality | 3% | 4% |
| Index disposal | ||
| Community order | 21% | |
| Suspended sentence order | 14% | |
| Conditional discharge | 1% | |
| Fine | 3% | |
| Prison | 59% | |
| Other | 2% |
The individuals in the treatment group were aged 16 to 75 years at the beginning of their one-year period (average age 32).
Information on index offences for the 6,153 participants not included in the analysis is not available, as they could not be linked to a suitable sentence.
For 150 people, no personal information is available.
Please note totals may not appear to equal the sum of the component parts due to rounding.
Information on individual risks and needs was available for 3,296 people in the male community treatment group (94%), recorded near to the time of their original conviction.
- 95% had evidence that their thinking and behaviour was linked to reoffending
- 75% had some or significant problems with problem solving
- 66% had evidence that their attitudes were linked to reoffending
11. Matching the treatment and comparison groups
The analyses matched the treatment group to a comparison group. A large number of variables were identified and tested for inclusion in the regression models. The matching quality of each variable can be assessed with reference to the standardised differences in means between the matched treatment and comparison groups (see standardised differences annex). Over 95% of variables are categorised as green on JDL’s traffic light scale, indicating that the matching quality achieved on the observed variables was very good.
Further details of group characteristics and matching quality, including risks and needs recorded by the Offender Assessment System (OASys), can be found in the Excel annex accompanying this report.
This report is also supplemented by a general annex, which answers frequently asked questions about Justice Data Lab analyses and explains the caveats associated with them.
12. Additional information on the dataset
12.1 Index dates
The index date is the date at which the follow up period for measuring reoffending begins.
- For those with custodial sentences, the index date is the date they are released from custody.
- For those with a court order (such as a community sentence or a suspended sentence order), the index date is the date when an offender begins the court order.
- For those with non-custodial sentences such as a fine, the index date is the date when the offender received the sentence.
13. Sensitivity analysis
To assess the impact of the COVID pandemic on reoffending outcomes due to delays in the Criminal Courts, a sensitivity analysis was conducted on the headline analysis. The standard 6 month waiting period to allow for reoffences to be convicted was extended to a 12 month window. The intention of this extension was to investigate the impact of allowing any extra time it may take for case outcome to be decided by the courts, due to the increased courts backlog arising due to the COVID pandemic.
This sensitivity analysis did not result in a significantly greater number of reoffenders for the headline analysis, and therefore the definition of the one-year proven reoffending rate was not changed to encompass a longer waiting period.
14. Numbers of people in the treatment and comparison groups
*Adjudication results must be guilty to be considered for analysis, as an individual must have committed an initial offence and have been convicted for it in order for the reoffending rate to be measured.
**Inclusion criteria such as setting a maximum of 6 months between index date and intervention start date.
15. Further information
15.1 Official Statistics
Our statistical practice is regulated by the Office for Statistics Regulation (OSR).
OSR sets the standards of trustworthiness, quality and value in the Code of Practice for Statistics that all producers of official statistics should adhere to.
You are welcome to contact us directly with any comments about how we meet these standards.
Alternatively, you can contact OSR by emailing regulation@statistics.gov.uk or via the OSR website.
15.2 Contact
Press enquiries should be directed to the Ministry of Justice press office.
https://www.gov.uk/government/organisations/ministry-of-justice/about/media-enquiries
Other enquiries about the analysis should be directed to:
15.3 Justice Data Lab team
E-mail: justice.datalab@justice.gov.uk
© Crown copyright 2024
Produced by the Ministry of Justice
Alternative formats are available on request from justice.datalab@justice.gov.uk
This document is released under the Open Government Licence