Incorporated companies in the UK: April to June 2018
Published 26 July 2018

© Crown copyright 2018
This publication is licensed under the terms of the Open Government Licence v3.0 except where otherwise stated. To view this licence, visit nationalarchives.gov.uk/doc/open-government-licence/version/3 or write to the Information Policy Team, The National Archives, Kew, London TW9 4DU, or email: psi@nationalarchives.gov.uk.
Where we have identified any third party copyright information you will need to obtain permission from the copyright holders concerned.
This publication is available at https://www.gov.uk/government/statistics/incorporated-companies-in-the-uk-april-to-june-2018/incorporated-companies-in-the-uk-april-to-june-2018
1. Introduction
This release provides information about the population of companies in the United Kingdom. A company is defined as a specific legal form of business formed under the Companies Act 2006. Companies are registered at Companies House regardless of whether they go on to trade actively. Further information on companies and the Companies Act 2006 is provided in the document Definitions to accompany statistical releases.
The statistics in this release include the total number of incorporated companies, the number of newly incorporated companies and the number of companies that were dissolved. The release focusses on the headline messages for the United Kingdom. Figures for the constituent countries are contained in the supplementary tables that accompany this release. The supplementary tables also contain separate figures for public companies and limited liability partnerships.
1.1 Key points
- Between April and June 2018, there were 166,886 incorporations and 126,554 dissolutions in the UK.
- At the end of June 2018, there were 4,075,891 companies on the total register and 3,798,095 on the effective register. Both the total and effective registers continue to increase in size at a steady rate, although this has slowed in recent years.
- Consistent with trends in previous years, there were more incorporations in the second quarter of 2018 than in the same period in 2017.
- Despite seasonal fluctuations, the number of incorporations and dissolutions have continued to increase overall since 2012.
2. Incorporated companies
Between April and June 2018, there were 166,886 incorporations and 126,554 dissolutions in the UK. At the end of June 2018, there were 4,075,891 companies on the UK total register, which includes those in the process of dissolution or liquidation (277,796). Compared with the previous quarter, the total register increased by 42,536 companies (1.1%). Increases were seen in all constituent countries: England and Wales increased by 1%, Scotland by 1.2% and Northern Ireland by 1.7%.
At the end of the period, the number of companies on the effective register – which excludes those in the process of dissolution or liquidation – was 3,798,095. This was an increase of 28,073 (0.7%) compared with the end of the previous quarter.
The total register increased by 139,488 (3.5%) compared with the second quarter of 2017, whilst the effective register increased by 123,511 (3.4%). Both the total and effective registers have increased in a linear fashion since 2012, albeit at a slower growth rate in recent years. The growth rate from any particular quarter to that of the same quarter a year ago ranged between 5.2% and 7.2%, although this has dropped to between 3.5% and 4.4% in the last four quarters.
2.1 Chart 1: Total and effective register sizes, 2012Q1-2018Q2, United Kingdom
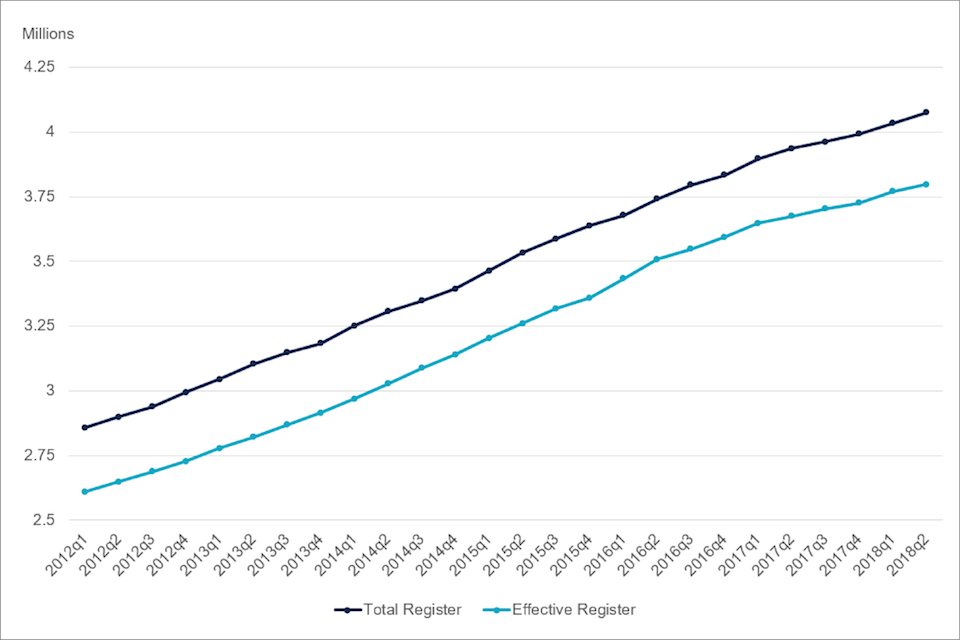
Chart 1: Total and effective register sizes, 2012Q1-2018Q2, United Kingdom
Source: Incorporated Companies in the UK, April to June 2018, Companies House
The number of incorporations increased by 14,455 (9.5%) when comparing with April to June 2017. This follows the general trend of the number of incorporations in any particular quarter being higher than those for the same quarter in the previous year. The number of incorporations peaked in the second quarter of 2016 and subsequently declined in the same quarter in 2017. Although the upward trend has returned during the second quarter of 2018, the number of incorporations remained lower than those seen in the same quarter in 2016, indicating that they are returning to more normal levels.
2.2 Chart 2: Quarter 2 incorporations, 2012-2018, United Kingdom
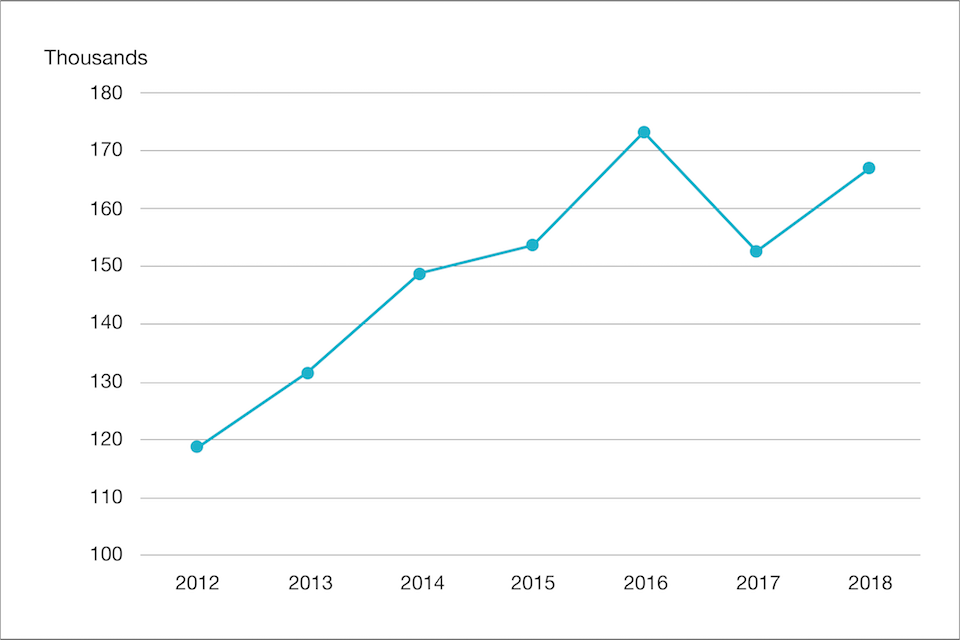
Chart 2: Quarter 2 incorporations, 2012-2018, United Kingdom
Source: Incorporated Companies in the UK, April to June 2018, Companies House
Despite seasonal fluctuations in the data, the number of incorporations has continued to increase gradually over time, with a peak in 2016. There were 38,684 (30.2%) more incorporations in the second quarter of 2018 than in the first quarter of 2012.
The number of dissolutions increased by 11,798 (10.3%) compared with April to June 2017. As with incorporations, the number of dissolutions has continued to increase over time: there were 55,286 (77.6%) more dissolutions in the second quarter of 2018 than in the first quarter of 2012.
2.3 Chart 3: Incorporations and Dissolutions, 2012Q1-2018Q2, United Kingdom
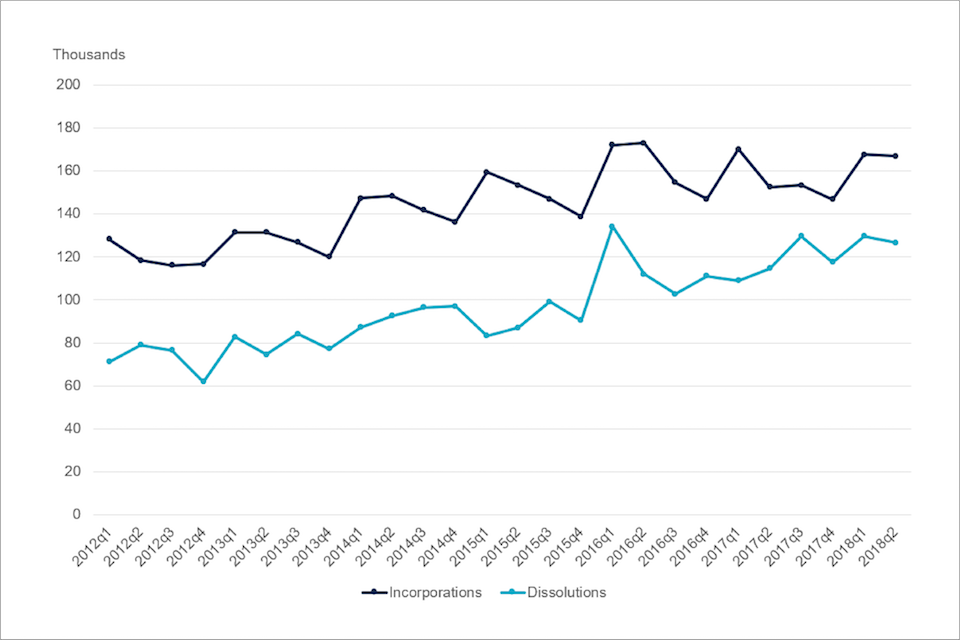
Chart 3: Incorporations and Dissolutions, 2012Q1-2018Q2, United Kingdom
Source: Incorporated Companies in the UK, April to June 2018, Companies House
A full breakdown of figures for England and Wales, Scotland, Northern Ireland and the UK as a whole is provided in the Excel workbook that accompanies this release. Figures are provided both on a quarterly and annual basis since 2011.
3. Other statistics in this release
In addition to the tables covering register activity for all companies, a range of other statistics are included in the tables that accompany this release. These tables provide information at the individual country level and for the UK as a whole. The tables cover the following:
- Register activity for public companies
- Register activity for limited liability partnerships (LLPs)
- Company insolvencies and liquidations
- Removals from the register
4. Background notes
This section provides a range of information designed to provide the user with more information about the statistics.
5. Definitions
A separate document “Definitions to accompany statistical releases” is available, providing definitions for the main terms used in Companies House official statistics publications.
6. Quality
Information relating to the quality of the statistics is provided in a separate quality document. This document provides information on the quality of Companies House’s official statistics, to enable users to judge whether or not the data are of sufficient quality for their intended use. The information is structured in terms of the quality dimensions of the European Statistical System. The document also provides information on how these statistics relate to selected other business statistics.
6.1 Coverage
This release provides information on the size of the company population and the changes that have occurred within the quarter. The release includes statistics for the United Kingdom, England and Wales, Northern Ireland, and Scotland. The statistics cover companies, which are specific legal forms of businesses that are registered at Companies House. They do not include information on sole proprietorship businesses, partnerships, and charities.
6.2 Use and users
Companies House statistics are used extensively by government, the public, public bodies and businesses. For example, they are used by:
- Government in understanding the likely impact of policy changes and monitoring the impact of economic changes on companies;
- Businesses in understanding their market share and planning marketing strategies;
- Banks in developing an understanding of their customer base;
- Foreign firms in making UK location decisions;
- Academics to inform research into businesses at local and national level;
- A range of public bodies in decision making and evaluating business-related policies.
6.3 Consultation
We are consulting on our annual publication and are seeking users’ views on both the publication itself and the accompanying tables. Please take a few minutes to read more about the consultation and provide us with your views.
6.4 Revisions to these statistics
Revisions to these statistics will be mainly due to changes in methodologies and source data. The statistics are derived from administrative data, and changes to the underlying methods will cause revisions. These include changes in statistical methods, definitions, classifications, and geographic coverage.
Although Companies House has robust procedures in place to minimise errors in the methods used to create these statistics, errors may occasionally occur. If errors are found after the publication, their impact will be assessed. If the changes are significant, a correction will be issued as soon as possible. Minor corrections will be included in the next planned release.
Any misleading or incorrect figures will be amended and a footnote added to indicate that the figures have been corrected. The nature and reason for the correction will be explained.
6.5 Date of next release
Statistics for the period 1 July to 30 September 2018 will be published on 25 October 2018. The publication date has been announced on the gov.uk release calendar.