Quick guide to published tables and results 2018 to 2019
Published 29 October 2020
Applies to England, Scotland and Wales

© Crown copyright 2020
This publication is licensed under the terms of the Open Government Licence v3.0 except where otherwise stated. To view this licence, visit nationalarchives.gov.uk/doc/open-government-licence/version/3 or write to the Information Policy Team, The National Archives, Kew, London TW9 4DU, or email: psi@nationalarchives.gov.uk.
Where we have identified any third party copyright information you will need to obtain permission from the copyright holders concerned.
This publication is available at https://www.gov.uk/government/statistics/income-related-benefits-estimates-of-take-up-financial-year-2018-to-2019/quick-guide-to-published-tables-and-results-2018-to-2019
There are two basic types of table presented in this publication – one that contains statistics related to the caseload measure of take-up and a second that contains statistics related to the expenditure measure. The following illustrations are intended as a guide to interpreting the online tables for each benefit.
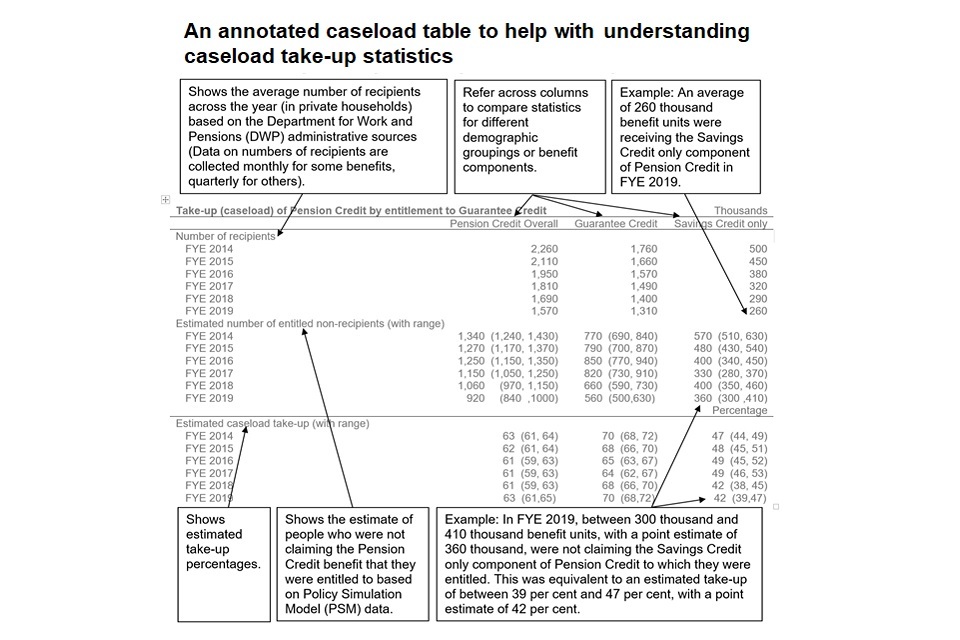
1. Understanding tables presenting caseload take-up statistics
The key parts of a Take-Up caseload table are:
Pension Credit Overall, Guarantee Credit and Savings Credit only columns – These different columns are to be used to compare statistics for different demographic groupings or benefit components.
Number of recipients – This shows the average number of recipients across the year (in private households) based on the Department for Work and Pensions (DWP) administrative sources (Data on numbers of recipients are collected monthly for some benefits, quarterly for others).
Estimated number of entitled non-recipients (with range) – This shows the estimate of people who were not claiming the Pension Credit benefit that they were entitled to based on Policy Simulation Model (PSM) data.
Estimated caseload take-up (with range) – This shows estimated take-up percentages.
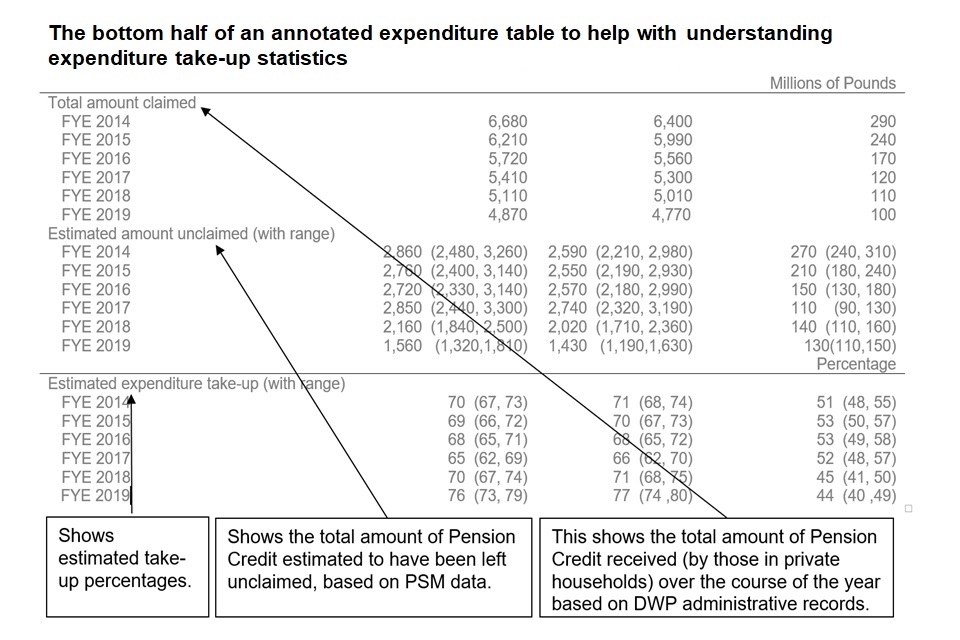
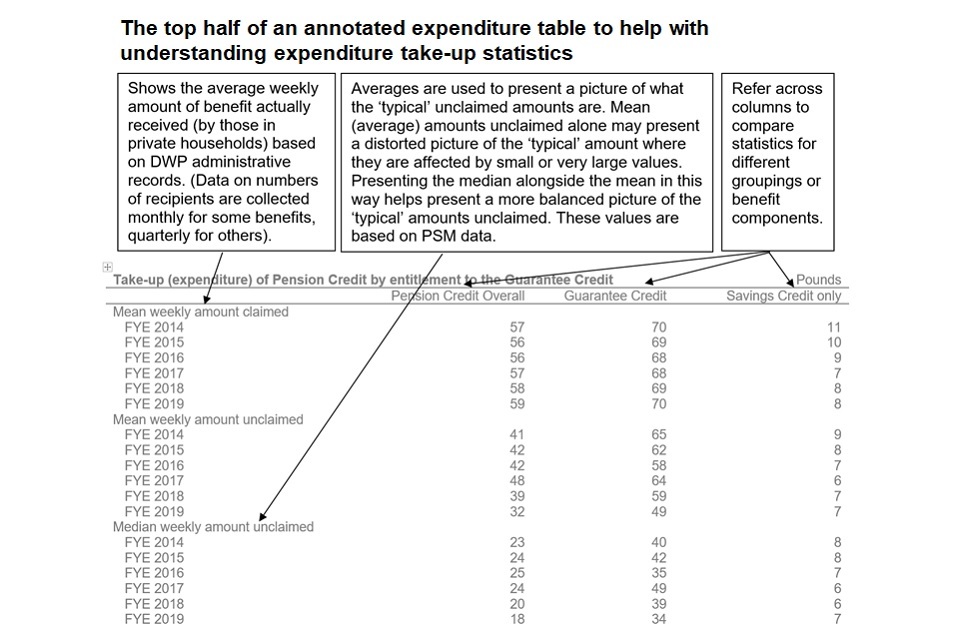
2. Understanding tables presenting expenditure take-up statistics
The key parts of a Take-Up expenditure table are:
Pension Credit Overall, Guarantee Credit and Savings Credit only columns - These different columns are to be used to compare statistics for different demographic groupings or benefit components.
Mean weekly amount claimed - This shows the average weekly amount of benefit actually received (by those in private households) based on DWP administrative records. (Data on numbers of recipients are collected monthly for some benefits, quarterly for others).
Mean weekly amount claimed, Mean weekly amount unclaimed and Median weekly amount unclaimed – These averages are used to present a picture of what the ‘typical’ unclaimed amounts are. Mean (average) amounts unclaimed alone may present a distorted picture of the ‘typical’ amount where they are affected by small or very large values. Presenting the median alongside the mean in this way helps present a more balanced picture of the ‘typical’ amounts unclaimed. These values are based on PSM data.
Total amount claimed – This shows the total amount of Pension Credit received (by those in private households) over the course of the year based on DWP administrative records.
Estimated amount unclaimed (with range) – This shows the total amount of Pension Credit estimated to have been left unclaimed, based on PSM data.
Estimated expenditure take-up (with range) – This shows estimated take-up percentages.