Horticulture Business Survey 2022
Updated 4 April 2022
Applies to England

© Crown copyright 2022
This publication is licensed under the terms of the Open Government Licence v3.0 except where otherwise stated. To view this licence, visit nationalarchives.gov.uk/doc/open-government-licence/version/3 or write to the Information Policy Team, The National Archives, Kew, London TW9 4DU, or email: psi@nationalarchives.gov.uk.
Where we have identified any third party copyright information you will need to obtain permission from the copyright holders concerned.
This publication is available at https://www.gov.uk/government/statistics/horticulture-business-survey/horticulture-business-survey-2022
About this release
The survey on horticulture business development, productivity and sustainability was run to collect data on the current and future direction of the horticulture sector in England. A representative sample of growers of edible and ornamental produce were invited to participate.
There were questions to collect information about the grower and their current produce, turnover and markets. Further questions explored their plans for production, productivity, exports, sustainability and research and development over the next five years. Growers were able to select which questions to respond to.
1. Key messages
- Growers with a turnover above £100,000 (42%) are more likely to report high or very high confidence in their business’ future prospects than growers with a turnover below £100,000 (24%).
- Edibles growers (58%) are more likely to be planning business growth than ornamentals growers (55%).
- Input costs were rated the most important factor in determining whether to increase both production and productivity.
- Growers with a turnover above £100,000 (75%) are more likely to be planning to increase productivity than growers with a turnover below £100,000 (31%).
- Electricity is required for the growing systems of 28% of growers, and a source of non-solar heat is required for 16%.
2. Respondent Profile
There were a total of 104 responses to the survey; 68% exclusively growing edibles, 21% exclusively growing ornamentals and 11% either both or unknown.
Figure 2.1: Percentage of survey respondents growing each type of crop
| Grower type | Percentage |
|---|---|
| Edibles | 68.2 |
| Ornamentals | 21.2 |
| Both or Unknown | 10.7 |
More than 80% of the growers indicated their annual turnover. Ornamentals growers (26%) were more likely to report a turnover above £1 million than edibles growers (13%).
Figure 2.2: Percentage of ornamentals and edibles growers by turnover
| Grower type | £0k - £99k | £100k - £1 million | £1 million + | Total |
|---|---|---|---|---|
| Edibles | 44.4 | 42.9 | 12.7 | 100 |
| Ornamentals | 33.2 | 40.6 | 26.1 | 100 |
The most common routes to market for growers are direct to customers, to independent retailers and to wholesale; each used by around a third of growers.
Growers were asked to provide an indication of their current confidence in their business’ future prospect. 42% of growers with a turnover above £100,000 reported high or very high confidence compared to 24% of growers with a turnover below £100,000.
Figure 2.3: Percentage of growers with current confidence in their business’ future prospects
| Grower type | Low or very low | Medium | High or very high | Total |
|---|---|---|---|---|
| All | 29.6 | 35.9 | 30.9 | 100 |
| Edibles | 31.1 | 36.3 | 32.6 | 100 |
| Ornamentals | 10.0 | 43.0 | 47.0 | 100 |
| £0k - £99k | 35.9 | 39.9 | 24.2 | 100 |
| £100k - £1 million | 17.9 | 37.4 | 44.8 | 100 |
| £1 million + | 44.3 | 21.3 | 34.4 | 100 |
3. Production
Growers were asked about their plans for growing their business over the next 5 years and 86% responded. 55% of growers are looking at ways to grow their business over the next five years. Edibles growers (58%) are more likely to be planning growth than ornamentals growers (55%).
Growers not planning to grow their business over the next five years were asked for their reasoning. More than half of the responses indicate that this is due to personal circumstances, usually associated with age or plans towards retirement. They also often mention contentment about the current size or focus of the business; ’After 30yrs we feel we have the business at an optimum where we feel in control and long last we have a better work/leisure balance’. The other responses highlight more negative sentiment with factors such as the availability, restrictions and cost of inputs, confidence in the market and availability of labour.
Figure 3.1: Percentage of growers planning to grow their business over the next five years
| Grower type | Yes | No | Total |
|---|---|---|---|
| All | 54.5 | 45.5 | 100 |
| Edibles | 57.9 | 42.1 | 100 |
| Ornamentals | 54.7 | 45.3 | 100 |
| £0k - £99k | 43.5 | 56.5 | 100 |
| £100k - £1 million | 62.5 | 37.5 | 100 |
| £1 million + | 51.1 | 48.9 | 100 |
The most common method growers are planning to use for growing their business is through increasing production (45%). Of these, 82% have already identified demand in the domestic market.
Figure 3.2: Methods by which growers plan to increase production in the next five years
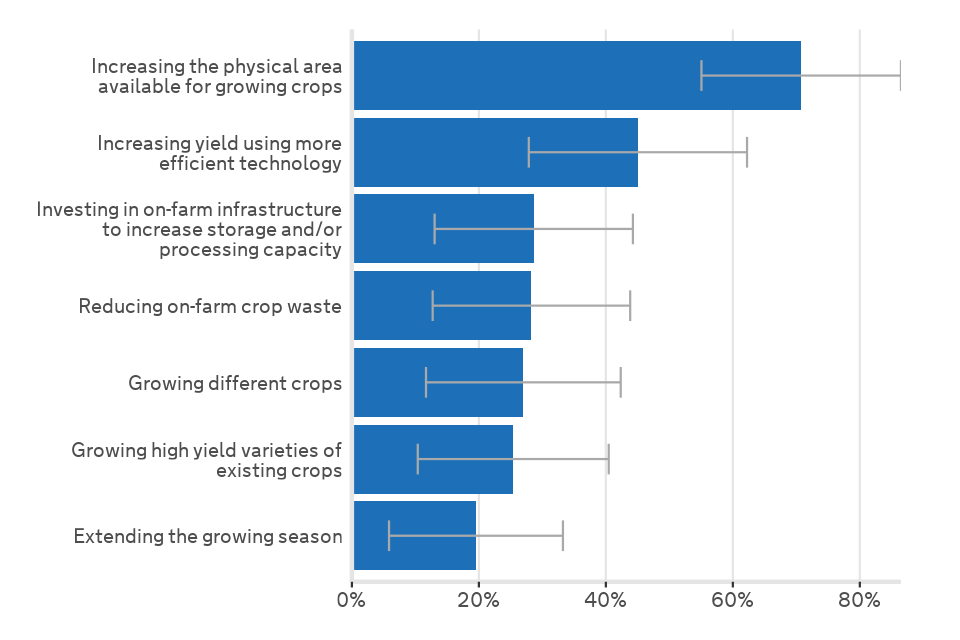
Most popular method is increasing the physical area available for crops (71%), the increasing yield using more efficient technology (45%)
The most common reason for growers not planning to increase production is a lack of confidence in investing (39%). Input costs were the most important factor when deciding whether to increase production (followed by the availability of labour and increased consumer demand for domestic produce).
Figure 3.3: Reasons for not planning to increase production in the next five years
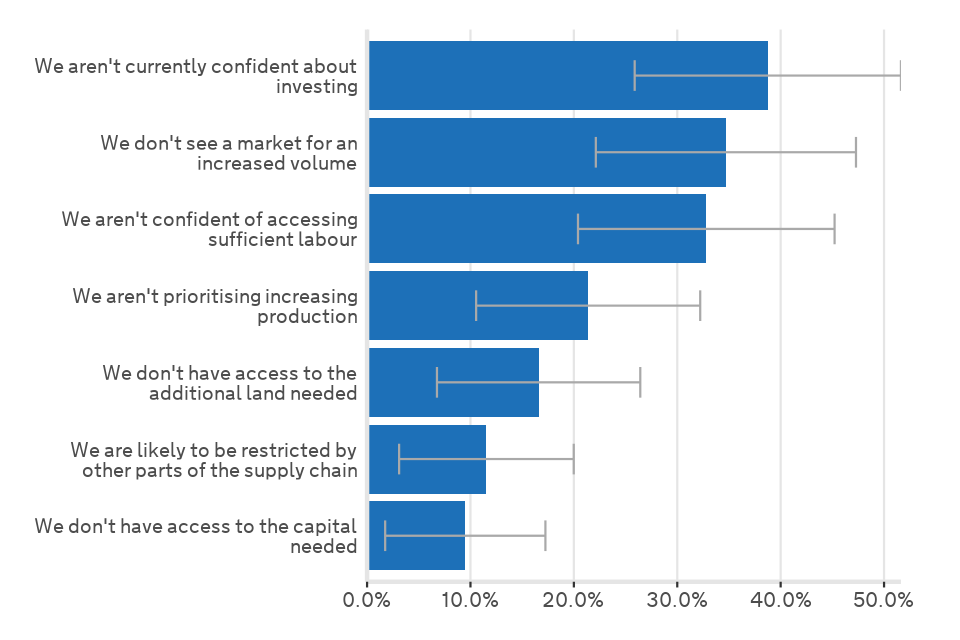
Most popular reason is a lack of confidence about investing (39%), then not seeing a market for an increased volume (35%)
53% of growers are planning to grow new crops or varieties in the next five years, including 70% of ornamentals growers. The reasons for growers not planning to grow new crops were largely the same as the reasons for growers not planning to expand their business. More than a third are focussing on meeting current demand (‘Happy with the varieties we grow. Market driven’). Just under a third highlighted personal circumstances such as retirement and the remaining third cited negative sentiment including input costs or availability, low confidence (‘Growing new crops can only be done if there is a market for them and that market isn’t already overdone’) and barriers to establishing new crops.
4. Productivity
For the survey, productivity was defined as the rate of output per unit of input eg. The volume of production (output) compared to the labour, materials and fertiliser (inputs) required to achieve this production. 57% of growers are planning to increase productivity over the next five years. Only 31% of growers with turnover below £100,000 are planning to increase productivity, compared to 75% of growers with turnover over £100,000.
Figure 4.1: Percentage of growers planning to increase productivity over the next five years
| Grower type | Yes | No | Total |
|---|---|---|---|
| All | 57.3 | 42.7 | 100 |
| Edibles | 59.7 | 40.3 | 100 |
| Ornamentals | 49.4 | 50.6 | 100 |
| £0k - £99k | 30.6 | 69.4 | 100 |
| £100k - £1 million | 72.3 | 27.7 | 100 |
| £1 million + | 83.1 | 16.9 | 100 |
From growers planning to increase productivity, 66% plan to do this through developing skills and competencies in the workforce. The most common reason for growers not planning to increase productivity is that it is not a priority.
Figure 4.2: Methods by which growers plan to increase productivity in the next five years
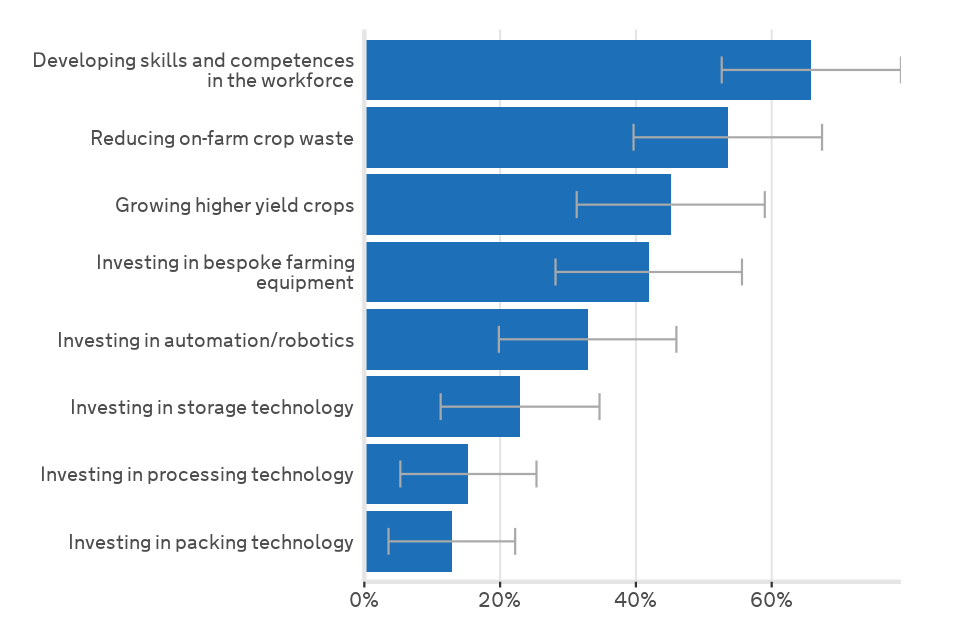
Most popular method is developing skills and competences of the workforce (66%), then reducing on-farm crop waste (54%)
Growers were asked to rate a range of factors for their importance to productivity over the next five years. The most important overall are input costs, availability of labour and access to plant protection products. Growers with turnover above £1 million selected availability of labour as the most significant factor.
5. Exports
18% of growers currently export some of their crops (either directly or through companies they market through). More growers with a turnover above £1 million (49%) export crops compared to growers with turnover below £1 million (9%). Over half the exporting growers (59%) export less than 10% of their production.
The most common reasons for not exporting are not being set up to export (65%) and having easier domestic market opportunities (65%).
Figure 5.1: Reasons why growers don’t export
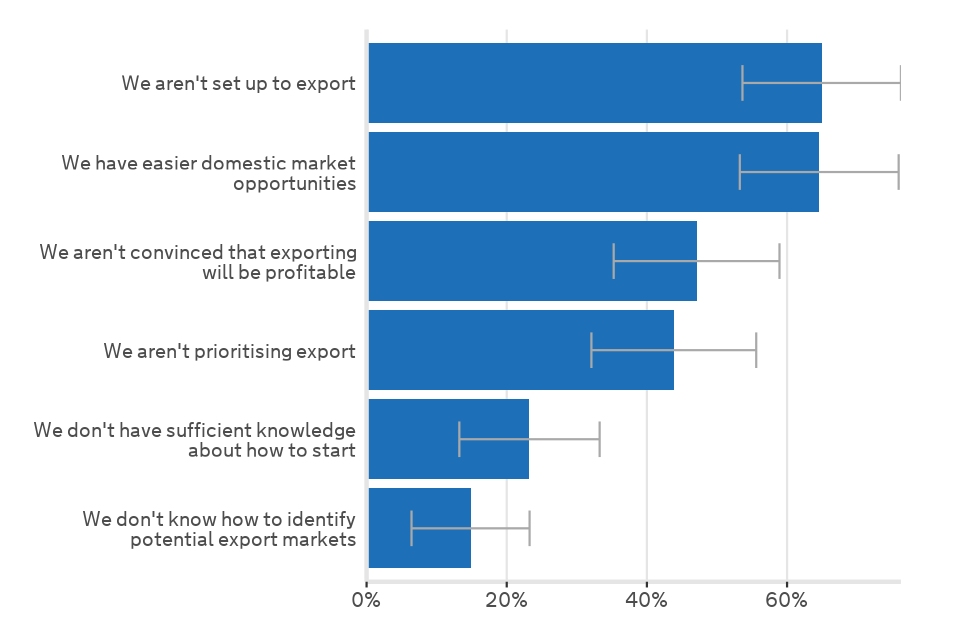
Most popular reason is not being set up to export (65%), then easier domestic market opportunities (65%)
6. Sustainable production
Growers were asked whether they already have in place, or plan to develop or adopt, business targets and a plan to address a range of sustainability issues. The issues covered were reducing their Greenhouse Gas (GHG) footprint, use of plastics, use of chemical inputs and crop waste, and increasing the sustainability of energy sources, water self-sufficiency and biodiversity. Increasing biodiversity is the issue where the greatest number of growers currently have business targets and a plan in place. Reducing their GHG footprint is the issue with the most growers having no intention to develop or adopt business targets or a plan.
Figure 6.1: Percentage of growers with targets and plans for sustainability issues
| Grower type | No intention to develop targets/plans | Existing targets/plans | Intention to develop targets/plans | Total |
|---|---|---|---|---|
| Reducing your GHG footprint | 36.5 | 15.2 | 48.3 | 100 |
| Reducing use of plastics | 22.8 | 37.3 | 39.9 | 100 |
| Reducing use of chemical inputs | 18.9 | 35.9 | 45.2 | 100 |
| Reducing crop waste | 14.4 | 40.0 | 45.6 | 100 |
| Increasing water self-sufficiency | 30.8 | 23.0 | 46.2 | 100 |
| Increasing the sustainability of energy sources | 33.2 | 22.0 | 44.7 | 100 |
| Increasing biodiversity | 25.1 | 43.6 | 31.3 | 100 |
There are 15% of growers who measure their Greenhouse Gas (GHG) footprint, but 53% of these aren’t confident they have sufficient tools to assess their emissions accurately. For those who do not measure their GHG footprint, 60% are unclear how to.
Figure 6.2: Reasons for not measuring GHG footprint
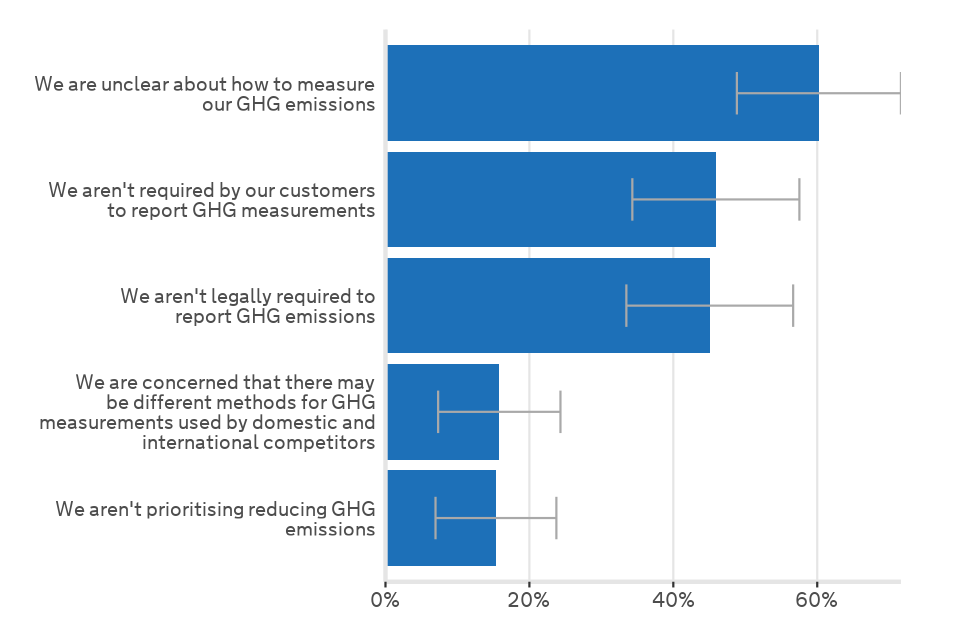
Most popular reason is being unclear how to measure GHG footprint (60%), then no requirement from customers (46%)
Electricity is required for the growing system of 28% of growers, and 89% use the National Grid as a major source of their electricity. 16% of growers require a source of non-solar heat, with the most popular heat source being air heaters fuelled by gas, LPG, kerosene or other fuel oils. Mains water is the only source of water for 47% of growers, whilst 22% are self-sufficient for more than 75% of their water supply.
7. Research and Development
Growers were asked if they had directly invested in their own research and development in the previous five years and 32% have done so. Growers with turnover above £1 million are more likely to have carried out research and development in the last five years (58% of growers compared to 23% of growers with lower turnover). The most common reasons for investing in research and development were for improving productivity (70%) and sustainability (62%).
More growers are planning to invest in research and development over the next five years (38% compared to the 32% over the previous five years). 71% of the growers not planning to invest in research and development have a lack of capacity or resources to do so.
Figure 7.1: Reasons for not planning to carry out research and development in the next five years
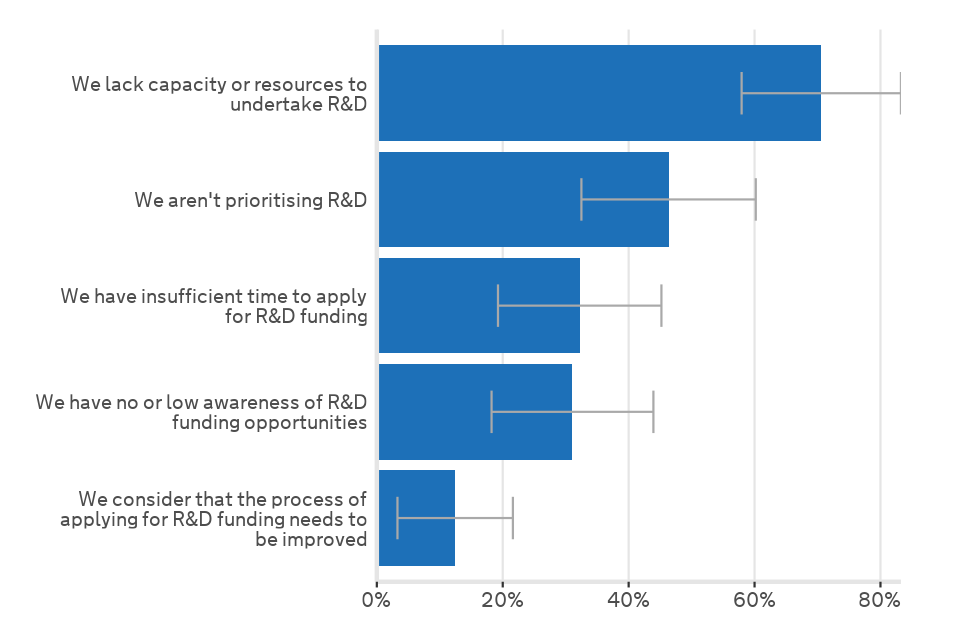
Most popular reason is a lack of capacity or resources (71%), then not prioritising R&D (46%)
8. Methodology
The survey on horticulture business development, productivity and sustainability provides a snapshot of views and opinions on the current and future direction of the horticulture sector in England as at February 2022. Growers were asked questions about their plans for production, productivity, sustainability, export and research and development.
The results provided in this report are based on surveys sent to a representative sample of growers of edible and ornamental produce. The survey was voluntary and 104 responses were received (including some partial responses) from the 819 invitations, resulting in a response rate of 13%.
The sample was drawn from the 2019 June Survey of Agriculture where growers were defined as Horticulture or General Cropping with specialist field vegetables or various field crops combined. There were 5,069 growers in this initial group and growers were then only included where they had provided an email address.
Results have been analysed using a standard methodology for stratified random surveys to produce national estimates. With this method, all of the data are weighted according to the inverse sampling fraction.
We show 95% confidence intervals against the results. These show the range of values that may apply to the figures. They mean that we are 95% confident that this range contains the true value. They are calculated as the standard errors (se) multiplied by 1.96 to give the 95% confidence interval (95% CI). The standard errors only give an indication of the sampling error. They do not reflect any other sources of survey errors, such as non-response bias.
Percentages have been calculated based on the number of responses to the individual question, unless otherwise stated.
Enquiries to: Crops statistics team
Email: crops-statistics@defra.gov.uk
Defra, Rm 201,
Foss House,
Kings Pool,
1-2 Peasholme Green,
York,
YO1 7PX