HM Prison and Probation Service workforce quarterly: September 2022
Published 17 November 2022
Applies to England and Wales

© Crown copyright 2022
This publication is licensed under the terms of the Open Government Licence v3.0 except where otherwise stated. To view this licence, visit nationalarchives.gov.uk/doc/open-government-licence/version/3 or write to the Information Policy Team, The National Archives, Kew, London TW9 4DU, or email: psi@nationalarchives.gov.uk.
Where we have identified any third party copyright information you will need to obtain permission from the copyright holders concerned.
This publication is available at https://www.gov.uk/government/statistics/hm-prison-and-probation-service-workforce-quarterly-september-2022/hm-prison-and-probation-service-workforce-quarterly-september-2022--2
Main Points
| 59,311 FTE (full time equivalent) staff in post | This is a slight increase of 1,145 FTE (2.0%) staff in post compared to 30 September 2021 and a slight increase of 969 FTE (1.7%) since 30 June 2022. Of the staff in post, there were 34,035 FTE in Public Sector Prisons (PSP), 18,366 FTE staff in the Probation Service, 5,370 FTE staff in HQ and Area Services, and 1,541 FTE in the Youth Custody Service (YCS). |
| 21,617 FTE band 3-5 prison officers in post | This is a decrease of 708 FTE (3.2%) since 30 September 2021 and no substantial change compared to 30 June 2022. |
| 5,234 FTE band 2 operational support staff in post | This is an increase of 131 FTE (2.6%) since 30 September 2021 and an increase of 140 FTE (2.8%) operational support staff since 30 June 2022. |
| 4,371 FTE band 4 probation officers in post | This is a slight increase of 84 FTE (2.0%) since 30 September 2021 and a decrease of 170 FTE (3.8%) compared to 30 June 2022. In addition to the band 4 probation officers, there were 6,374 FTE band 3 probation services officers: an increase of 641 FTE (11.2%) since 30 September 2021 and an increase of 563 FTE (9.7%) since 30 June 2022. |
| Leaving rate of 15.7% amongst band 3-5 prison officers | This is a slight increase of 1.2 percentage points compared to the year ending 31 March 2022. The overall leaving rate across HMPPS over the past 12 months stood at 13.3%, which is a slight increase of 0.7 percentage points compared to the year ending 31 March 2022. |
This publication provides details of staffing levels, staff inflows and outflows, sickness absence rates, and protected characteristics for the directly employed workforce of HMPPS. Information presented covers PSP, the Probation Service, the YCS, and HMPPS headquarters, which includes Area Services that provide direct operational support to prisons. Technical details and explanatory notes can be found in the accompanying Guide to HM Prison and Probation (HMPPS) Workforce Statistics.
Statistician’s comment
In this publication we are reporting on the HMPPS workforce as at 30 September 2022.
As at September 2022 there were 59,311 FTE staff in post, an increase of 1,145 FTE over September 2021.This increase was mainly due to increases in staff in Probation Service which saw an increase of 1,115 FTE since September 2021, whilst prisons ( including YCS) saw a decrease of 595 FTE over the same period.
Leaving rates fell during the COVID-19 pandemic, possibly due to increased uncertainty in the employment market. Leaving rates have now increased and are continuing the upward trend seen from March 2016 to March 2020. The number of joiners, however, has also increased, mean a net increase in staff overall.
HMPPS staff sickness accounted for an average of 14.4 working days per person lost for the 12 months to the end of September 2022. This is the highest in the time series and is 4.2 working days higher than the predominantly COVID-19 free year ending 31 March 2020. For the 12 months to the end of June 2022 the main reason for sickness was Mental and Behavioural Disorders (30.5% of absences) followed by Epidemic/Pandemic (23.2%) of absences.
Points to note
HM Prison and Probation Service
HMPPS is focused on supporting operational delivery and the effective running of prison and probation services across the public and private sectors. HMPPS works with a number of partners to carry out the sentences given by the courts, either in custody or the community. This publication covers the reporting period up to 30 September 2022 and therefore considers in detail quarterly staffing levels and staff inflows and outflows, for HMPPS and its predecessors, since 2016.
For ease, the statistics in this publication will be referred to as those of the HMPPS workforce (i.e. staff working in HMPPS and with a contract of employment with HMPPS, excluding those on career breaks and those on secondment or loan outside of HMPPS but including staff on secondment or loan into HMPPS).
Staff employed by private sector establishments, community rehabilitation companies and other contractors are excluded.
Coronavirus (COVID-19)
The annex of experimental statistics on COVID-19 is no longer being produced. There are now fewer cases of COVID-19 having an operational impact and as such the imperative to record COVID-19 cases specifically, has decreased. There are uncertainties around the data quality of the manual Covid reporting and it is likely all manual recording will cease altogether shortly. Levels of sickness and working days lost are incorporated into our general sickness reporting
Annex on Prison Officer recruitment diversity
As noted in previous bulletins, the annex with experimental statistics on Prison Officer and Operational Support Grade (OSG) recruitment has been moved to a six-monthly production cycle.
Annex on Probation Officer Vacancies and Trainees
As of the June 2019 publication, this annex has been added to this bulletin which presents figures on Probation Officers in post, and their required staffing level, in addition it shows the number of trainee and qualified Probation Officers.
Annex on ‘Great Place to Work for Veterans’ recruitment
This annex is a new annex which has been added to this bulletin and presents figures on staff recruited as part of the ‘Great Place to Work for Veterans’ recruitment campaign. It is a simple one table annex and is expected to be repeated biannually. All externally advertised roles, at all grades across MoJ, utilize the Great place to work for Veterans scheme. This scheme allows eligible veterans to opt into the scheme, providing the opportunity for a guaranteed interview if they meet the minimum sift standard for that vacancy. Further information can be found at: https://www.civil-service-careers.gov.uk/great-place-to-work-for-veterans/
Organisational Changes in last two years
-
In June 2022 around 1,000 Approved Premises staff were moved out of HQ directorates and back into Probation Service. This reverses a move from November and December 2019, when over 1,200 NPS staff moved to the Community and Interventions directorate, part of HMPPS HQ and Areas Services. Figures for all historical periods have been revised to reflect this change.
-
The Prison region of Immigration Removal Centre and Foreign National Centre (IRCs and FNCs) group was officially disbanded at the end of March 2021 and the prisons within it were moved to be managed by their respective geographical regions:
Morton Hall – East Midlands
Huntercombe – South Central
Maidstone – Kent, Surrey and Sussex
-
In late June 2021, more than 7,000 staff from private sector Community Rehabilitation Companies (CRC) came together with probation staff already in the public sector in the new Probation Service. Records are still being updated following this change, resulting in some entries being classified as ‘unknown’ in the accompanying tables. In addition, many of the new staff had not been able to update their voluntary declarations on diversity information at the time of joining, which has led to an initial drop in recorded declaration rates for many of the indicators, as can be seen in Table 5d, of the accompanying tables.
-
From April 2021 the Probation Service has been undergoing a reorganisation, with staff moving into new Probation Delivery Units (PDUs).
Future Plans
For future publications we are considering ways in which we can improve the bulletin, and some of the issues we may look into are as follows:
- How to make the tables and presentation of the figures more user-friendly.
- Whether to and how to expand the range of information provided.
If you have any particular comments or views on the above, or any other aspects you would like to be considered about this bulletin, please contact us at the address given at the end of the publication.
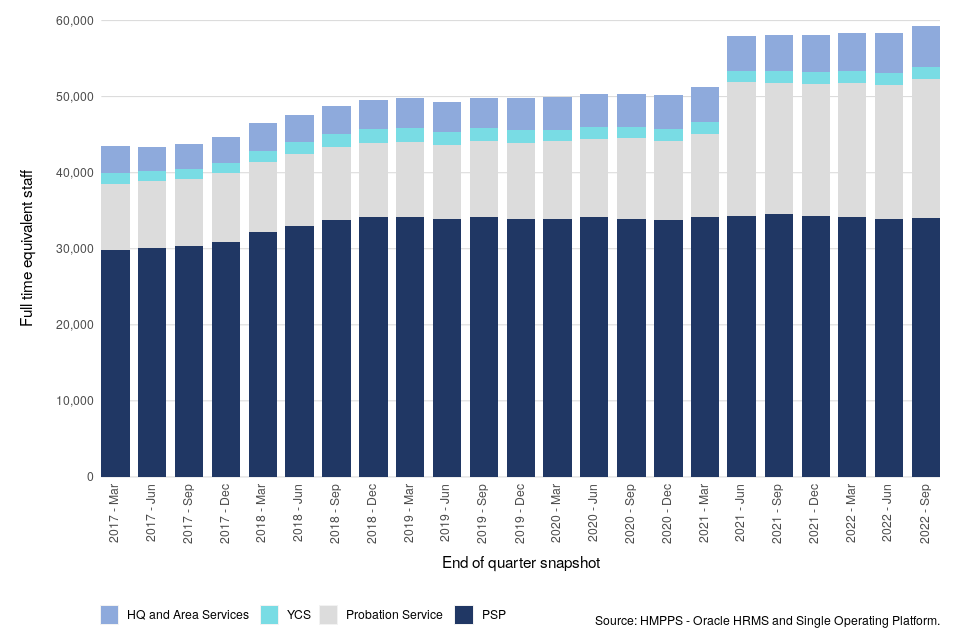
1. Total HMPPS staff in post
59,311 FTE staff in post (as at 30 September 2022)
This is a slight increase of 1,145 FTE (2.0%) staff in post since 30 September 2021 and a slight increase of 969 FTE (1.7%) since 30 June 2022. Of the staff in post, there were 34,035 FTE in Public Sector Prisons (PSP), 18,366 FTE staff in the Probation Service, 5,370 FTE staff in HQ and Area Services, and 1,541 FTE in the YCS.
As at 30 September 2022, there were 59,311 FTE staff in post in HMPPS on a full time equivalent (FTE) basis (Figure 1). This includes 34,035 FTE staff in PSP (making up 57.4% of all HMPPS staff), 18,366 FTE in the Probation Service (31.0% of all HMPPS staff), 5,370 FTE in HMPPS HQ and Area Services (9.1% of all HMPPS staff), and 1,541 FTE in the YCS (2.6% of all HMPPS staff).
Compared to 30 September 2021, the overall staff numbers slightly increased by 1,145 FTE (2.0%): FTE in PSP slightly decreased by 570 (1.6%), FTE in the Probation Service increased by 1,115 (6.5%), FTE in HQ and Area Services increased by 626 (13.2%), and FTE in the YCS slightly decreased by 25 (1.6%).
As at 30 September 2022, there were 27,891 FTE (47.0% of HMPPS staff) operational prison service staff (including YCS staff). This is a slight decrease of 527 FTE staff (1.9%) compared to 30 September 2021. Non-operational roles across PSP, YCS, and HMPPS HQ accounted for 12,727 FTE staff (21.5% of HMPPS staff), which is an increase of 492 FTE (4.0%) since 30 September 2021. There were 18,693 FTE staff[footnote 1] in the Probation Service (31.5% of all HMPPS staff): an increase of 1,181 (6.7%) FTE since 30 September 2021.
Figure 1 shows a big increase in Probation Service staff in June 2021, which was due to more than 7,000 staff from private sector CRCs coming together with probation staff already in the public sector in the new Probation Service.
Figure 1: Number of HMPPS staff in post on an FTE basis, 31 March 2017 to 30 September 2022 (Source: Table 1)
1.1 Length of Service
Across HMPPS overall, 28.8% of FTE staff in post had less than 3 years’ service, which was a slight increase from 27.6% at 30 September 2021 and a slight increase from 27.7% at 30 June 2022. 32.0% of HMPPS FTE staff in post had 10 years or more of experience, representing a decrease from 35.1% at 30 September 2021 and a slight decrease from 33.1% at 30 June 2022.
The proportion of band 3-5 prison officers with less than 3 years’ service at 30 September 2022 rose to 31.0% compared to 29.8% as at 30 September 2021. The proportion of band 3-5 prison officers in post with 10 years or more of experience decreased by 3.6 percentage points from 38.1% at 30 September 2021 to 34.4% at 30 September 2022. This corresponds to 7,442 FTE staff with 10 years or more of experience at 30 September 2022, which is a fall of 1,055 FTE, or 12.4% since 30 September 2021.
The proportion of band 2 OSG FTE staff with less than 3 years’ service increased from 39.2% at 30 September 2021 to 45.9% at 30 September 2022, and the proportion of those with 10 years or more of experience decreased from 37.5% at 30 September 2021 to 31.5% at 30 September 2022.
It should be noted, that the National Probation Service was created on 1 June 2014 and the service of Probation Service staff in Probation Trusts prior to the creation of the Probation Service is not included. Therefore, the figures relating to the length of service of Probation Service staff, which are included in the HMPPS overall figures, do not necessarily represent their full experience but rather the length of service from entry to HMPPS. The situation is different for the over 7000 staff who transferred from the CRCs in June 2021 and for them their service prior to their date of transfer is included.
Excluding the Probation Service, 28.3% of FTE staff in post across HMPPS had less than 3 years’ service as at 30 September 2022. This is a slight increase of 1.1 percentage points compared to 30 September 2021. The non-Probation Service staff with 10 years’ experience or more made up 39.3% of the workforce, which is a 3.5 percentage points decrease compared to 30 September 2021.
Length of service information has been calculated for HMPPS staff from the most recent hire date. Where staff have transferred in from another government department or have transferred in through HMPPS taking over a function, length of service is calculated from entry to HMPPS.
2. Band 3-5 prison officers and band 2 operational support staff
21,617 FTE band 3-5 prison officers in post (as at 30 September 2022)
This is a decrease of 708 FTE (3.2%) in FTE since 30 September 2021 and no substantial change of FTE prison officers compared to 30 June 2022.
5,234 FTE band 2 operational support staff in post (as at 30 September 2022)
This corresponds to an increase of 131 FTE (2.6%) since 30 September 2021 and an increase of 140 FTE (2.8%) operational support staff since 30 June 2022.
The key operational grades in public sector prisons are the band 3 to 5 prison officers. They consist of band 3 prison officers, band 4 officer specialists, band 4 supervising officers, and band 5 custodial managers.
Figure 2: Number of band 3-5 prison officers in post on an FTE basis, 31 March 2017 to 30 September 2022 (Source: Table 3)
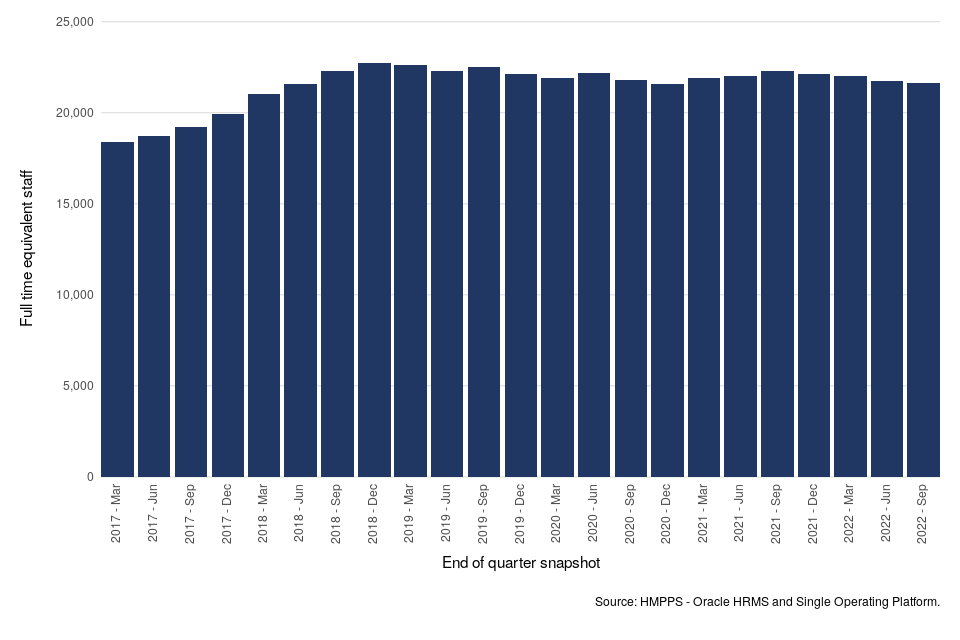
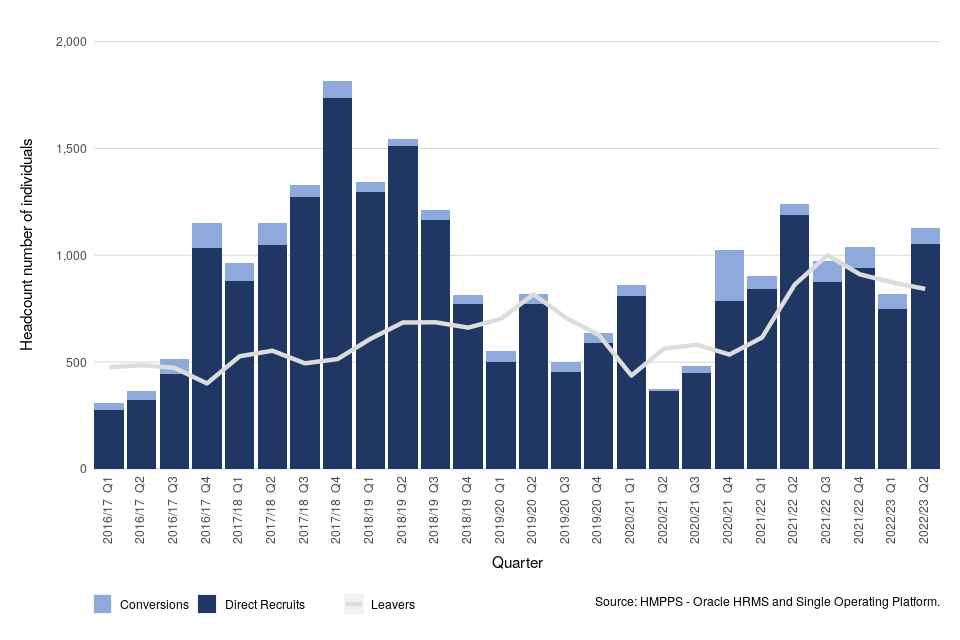
Figure 3 shows a quarterly trend of band 3 to 5 appointments and leavers since 2016/17. Over the year to 30 September 2022, 3,954 band 3 to 5 officers were appointed (consisting of direct new recruits and existing staff who converted to a band 3 officer grade), an increase of 310 (8.5%) compared to 3,644 in the previous year. Looking at the quarterly figures, the headcount of new band 3 to 5 officer appointments increased by 309 (37.8%) from 817 between April and June 2022 to 1,126 between July and September 2022 (Table 17).
The headcount of band 3 to 5 prison officers who left HMPPS in the year ending 30 September 2022 was 3,624, which is an increase of 1,031 (39.8%) compared to the year ending 30 September 2021. This is actually lower than previous quarters. Leaving rates fell during the COVID-19 pandemic, possibly due to increased uncertainty in the employment market. Leaving rates in the last year have increased and are continuing the upward trend seen from March 2016 to March 2020. Examining reasons for leaving, 72.7% of prison officers who left in the year ending 30 September 2022 resigned from their roles (up from 65.4% in the year ending 30 September 2021). Of the other prison officers who left HMPPS, 12.1% were dismissed and 6.6% retired in the year ending 30 September 2022: the proportion dismissed are down from 13.2% compared to previous year while the number retiring are up from 8.6%.
Figure 3: Newly appointed band 3 to 5 prison officers and band 3 to 5 prison officer leavers, April 2016 to 30 September 2022 (Source: Table 17)
The number of band 2 OSG staff who joined HMPPS in the year ending 30 September 2022 was 1,708: an increase of 312 (22.3%) compared to the previous year ending 30 September 2021. There was an increase of 252 (17.3%) since the year ending 30 June 2022. The headcount number of band 2 OSG staff who left HMPPS was 1,050, which is an increase of 283 (36.9%) compared to the year ending 30 September 2021 and a slight decrease of 1 (0.1%) compared to the year ending 30 June 2022.
Joiners and leavers are not the only movements into and out of the band 3 to 5 officer grouping. There are also typically differences in the proportion of new joiners and older officers who work part time as well as movements between grades. For these reasons, the change in FTE does not directly reflect the difference between the number of joiners and leavers. Changes such as staff switching from full time to part time have the effect of reducing the FTE of officers available as they progress through their career.
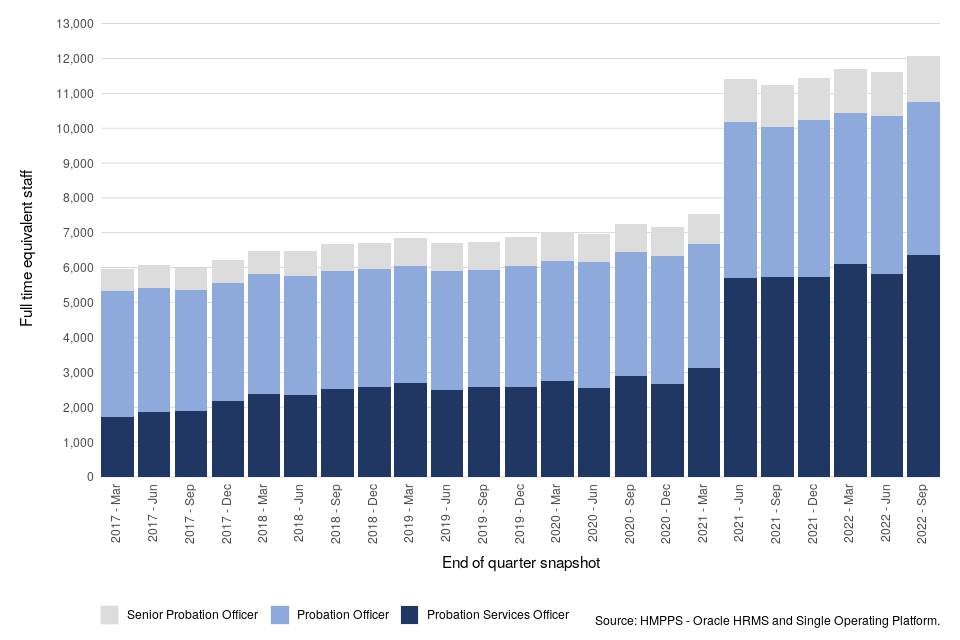
3. Probation practitioners and senior probation officers
4,371 FTE band 4 probation officers in post (as at 30 September 2022)
This figure is a slight increase of 84 FTE (2.0%) since 30 September 2021 and a decrease of 170 FTE (3.8%) probation officers compared to 30 June 2022. In addition to the band 4 probation officers, there were 6,374 FTE band 3 probation services officers: an increase of 641 FTE (11.2%) since 30 September 2021 and an increase of 563 FTE (9.7%) since 30 June 2022 .
Key grades in the Probation Service include band 3 probation services officers, band 4 probation officers (collectively known as probation practitioners), as well as band 5 senior probation officers. Staff who are training to be a probation officer work as a probation services officer during their training, so a proportion of the probation services officers in post will be working towards the professional probation officer qualification.
As of the June 2019 publication, an experimental statistics annex has been added to this bulletin which presents figures on Probation Officers in post, their required staffing level, in addition to the number of trainee and qualified Probation Officers.
As at 30 September 2022 there were 6,374 FTE band 3 probation services officers in post, an increase of 641 FTE (11.2%) over the past year and an increase of 563 FTE (9.7%) over the quarter; 4,371 FTE band 4 probation officers, representing a slight increase of 84 FTE (2.0%) over the past year and a decrease of 170 FTE (3.8%) compared to the previous quarter; and 1,309 FTE band 5 senior probation officers, showing an increase of 85 (7.0%) over the previous year and an increase of 49 (3.9%) since the last quarter (Figure 4).
Figure 4: Number of probation officers, probation services officers and senior probation officers in post on an FTE basis, 31 March 2017 to 30 September 2022 (Source: Table 3)
In the past year, 1,897 probation services officers were appointed, some of whom will be training to become qualified probation officers. This is an increase of 1,117 (143.2%) compared to the year ending 30 September 2021 and an increase of 465 (32.5%) compared to the number appointed in the year ending 30 June 2022. Within the Probation Service, there were 4,314 FTE probation officers in post, a shortfall of 1,846 FTE against the required staffing level of 6,160 FTE. There were 2,339 staff, equivalent to 2,329 FTE, undertaking the PQiP training at the end of September 2022, (please refer to the Probation recruitment annex for more details). In the past year, 874 probation services officers left the service. This is an increase of 488 (126.4%) compared to the year ending 30 September 2021 and an increase of 32 (3.8%) compared to the number who left in the year ending 30 June 2022.The number of leavers has increased considerably since June 2021, which is likely attributable to competition in the labour market
4. Joiners and Leavers
Leaving rate of 15.7% amongst band 3-5 prison officers (for the 12 months ending 30 September 2022)
This is a slight increase of 1.2 percentage points compared to the year ending 31 March 2022. The overall leaving rate across HMPPS over the past year stood at 13.3%, which is a slight increase of 0.7 percentage points compared to the year ending 31 March 2022 of 12.6%
Over the past year, 9,377 staff joined HMPPS, which is an increase of 2,399 (34.4%) compared to the year ending 30 September 2021. These joiners consisted of 5,869 across PSP, 284 in the YCS, 2,913 in the Probation Service, and 311 in HMPPS HQ and Area Services. Compared to the year ending 30 September 2021 these numbers of joiners represent an increase of 16.3% for PSP, an increase of 15.4% for YCS, an increase of 111.2% for Probation Service, and a slight increase of 2.0% for HMPPS HQ and Area Services.
There were 8,409 leavers in the year ending 30 September 2022, an increase of 2,510 (42.5%) compared to the year ending 30 September 2021. This includes 5,592 leavers from PSP (an increase of 32.8%), 239 from YCS (an increase of 52.2%), 2,171 from the Probation Service (an increase of 78.5%), and 407 from HMPPS HQ and Area Services (an increase of 28.8%).
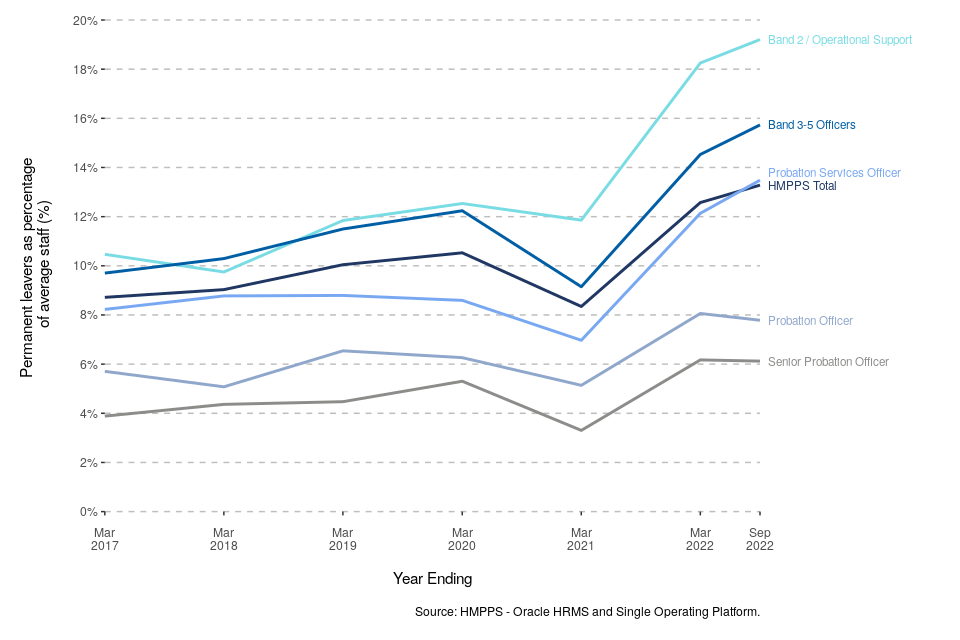
4.1 Leaving Rates[footnote 2]
The overall HMPPS leaving rate for the year to 30 September 2022 was 13.3%, compared to 12.6% for the year to 31 March 2022 (Figure 5), a change of 0.7% . For the year up to 31 March 2021 the increased uncertainty in the employment market following the COVID-19 pandemic may have contributed to the drop in the number of resignations during most of the year, therefore impacting on the overall reduced leaving and resignation rates. The latest leaving rates are now higher than pre-pandemic levels and are continuing the upward trend seen from March 2016 to March 2020.
Figure 5: Annual leaving rates of permanent staff in key operational grades (excluding VEDSR), from the 12 months to 31 March 2017 to the 12 months to 30 September 2022 (Source: Table 11)
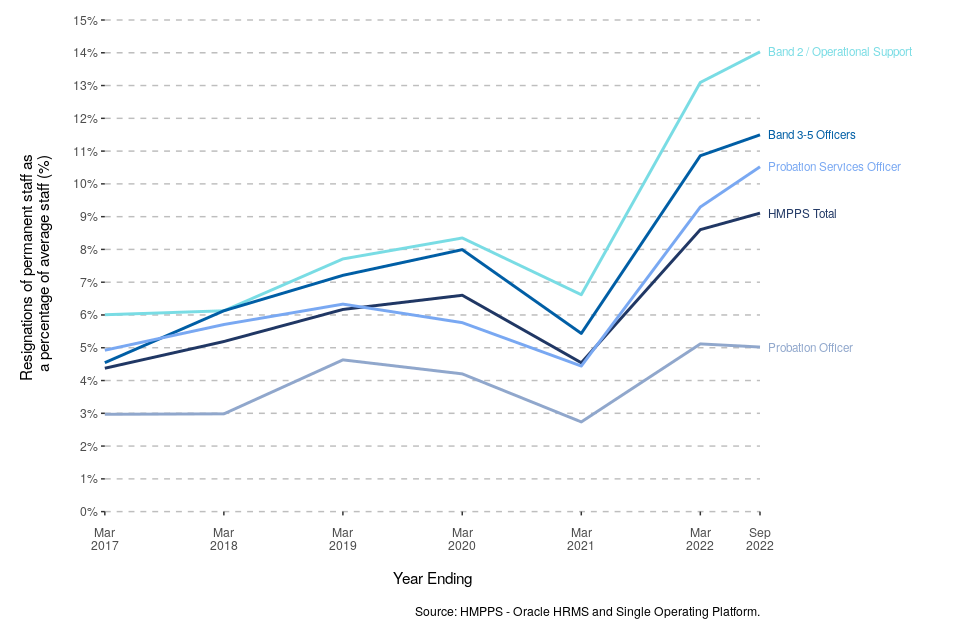
4.2 Resignation Rates[footnote 3]
The overall HMPPS resignation rate for the 12 months to 30 September 2022 was 9.1%, compared to 8.6% for the year to 31 March 2022 (Figure 6). For band 3-5 officers, the resignation rate was 11.5% in the year ending 30 September 2022, which is a slight increase of 0.6 percentage points since the year ending 31 March 2022. The resignation rate for OSG staff was 14.0% for the year ending 30 September 2022, which is a slight increase of 0.9 percentage points since the year ending 31 March 2022.
For Probation Service overall, the resignation rate was 7.5% for the year ending 30 September 2022. This represents a slight increase of 0.5 percentage points compared to the year ending 31 March 2022. Amongst the operational grades within the Probation Service, probation services officers had the highest resignation rate at 10.5%, (a slight increase of 1.2 percentage points) since the year ending 31 March 2022.
Figure 6: Annual resignation rates of permanent staff in key operational grades, from the 12 months to 31 March 2017 to the 12 months to 30 September 2022 (Source: Table 12)
5. Sickness absence
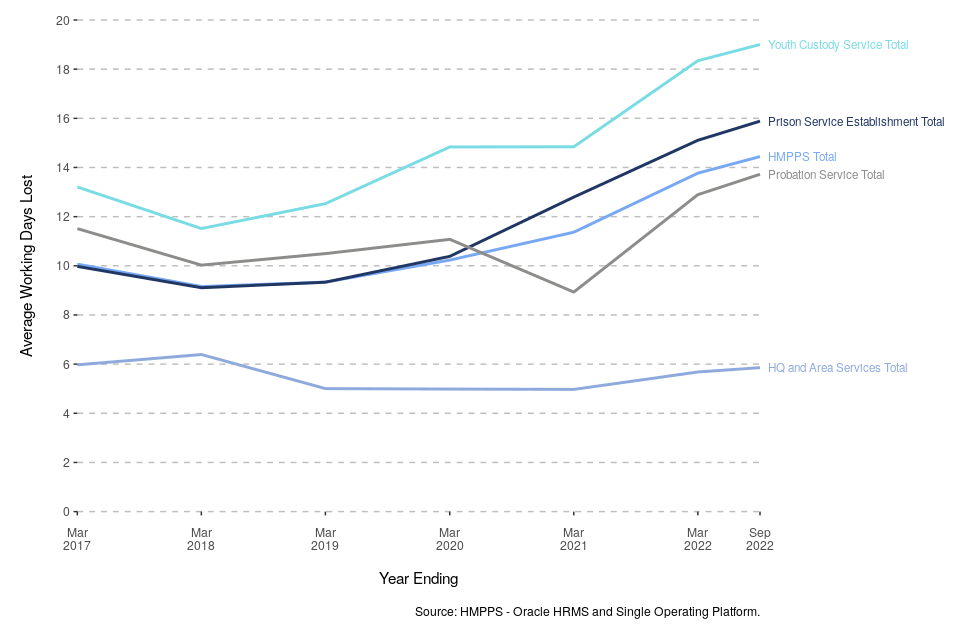
HMPPS staff lost an average of 14.4 working days to sickness absence in the 12 months ending 30 September 2022 (including COVID sickness)
This represents an increase of 0.7 Average Working Days Lost (AWDL) compared to the year ending 31 March 2022.
Since June 2021 these sickness absence figures include COVID-19 AWDL sickness numbers, including a revision to all AWDL figures since the start of the pandemic.
In the year ending 30 September 2022, HMPPS staff lost an average of 14.4 working days to sickness absence. This is an increase from 13.8 average working days lost for the year ending 31 March 2022, and an increase of 4.2 days compared to the predominantly COVID-19 free year ending 31 March 2020.
YCS staff had the highest sickness absence rate at 19.0 AWDL, followed by PSP (15.9 AWDL), Probation Service (13.7 AWDL), and HQ and Area Services (5.9 AWDL) (Figure 7). Compared to the year ending 31 March 2022, these represent an increase of 0.7 days for YCS, an increase of 0.8 days for PSP, an increase of 0.8 days for Probation Service, and a slight increase of 0.2 days for HQ and Area Services staff.
Figure 7: Average working days lost to sickness absence, 12 months to 31 March 2017 to 12 months to 30 September 2022 (Source: Table 18)
The most common category of sickness absence in terms of days lost was mental and behavioural disorders, corresponding to 30.5% of absences in the past year. This category was most prevalent for probation officers, where 52.3% of working days lost were attributed to mental and behavioural disorders.
For HMPPS overall the category that accounted for the second largest proportion of working days lost was epidemic/pandemic (23.2%). Together the top two categories accounted for 53.7% of all working days lost.
Further Information
Accompanying files
As well as this bulletin, the following products are published as part of this release:
-
A technical guide providing details of the HMPPS workforce structure as well as how the data are collected and processed. Information on the revisions policy and disclosure relevant to HMPPS staffing data is also included.
-
A set of summary tables for the latest quarter and year as well as over time.
-
A supplementary annex presenting experimental statistics on Probation Officers in post, their required staffing level, and the number of trainee and qualified Probation Officers.
-
A supplementary annex presenting statistics on ‘Great Place to Work for Veterans’ recruitment.
Official statistics
The statistics in this bulletin are classified as official statistics. The Statistics and Registration Service Act 2007 defines ‘official statistics’ as all those statistical outputs produced by the UK Statistics Authority’s executive office (the Office for National Statistics), by central Government departments and agencies, by the devolved administrations in Northern Ireland, Scotland, and Wales, and by other Crown bodies (over 200 bodies in total). The statistics in this bulletin comply with all aspects of the Code of Practice for Official Statistics. The Code encourages and supports producers of statistics to maintain their independence and to ensure adequate resourcing for statistical production. It helps producers and users of statistics by setting out the necessary principles and practices to produce statistics that are trustworthy, high quality and of public value.
Experimental Statistics
The statistics in the Probation Officer annex are experimental statistics. Experimental statistics are a subset of newly developed or innovative official statistics undergoing evaluation. They are developed under the guidance of the Head of Profession for Statistics (HoP) and published to involve users and stakeholders in the assessment of their suitability and quality at an early stage. Therefore, we would like to receive feedback as to how useful they are, whether a different analysis would be preferable, or any other comments about them. If you wish to send any views you may have about these experimental statistics, please use the contact details below.
Contact
Press enquiries should be directed to the Ministry of Justice press office:
Tel: 020 3334 3536
Email: newsdesk@justice.gov.uk
Other enquiries about these statistics should be directed to:
Bryce Millard
Workforce Statistics & Analysis
Data and Evidence as a Service (DES)
Ministry of Justice
10 South Colonnade
London
E14 4PH
Email: statistics.enquiries@justice.gsi.gov.uk
Next update: 16 February 2023
URL: www.gov.uk/government/collections/national-offender-management-service-workforce-statistics
© Crown copyright
Produced by the Ministry of Justice
Alternative formats are available on request from statistics.enquiries@justice.gov.uk
-
Please refer to footnote 1 of tables 6a and 6b for further information on main recent structural changes. ↩
-
This includes staff in Probation Service grades working in other parts of HMPPS. ↩
-
Percentage of staff with a permanent contract of employment who left HMPPS, including individuals who have retired early, but excluding staff who left due to voluntary early departure schemes and redundancy (VEDSR). ↩