Recruitment diversity experimental statistics Q1 2019 to Q4 2020
Published 18 February 2021
Applies to England and Wales

© Crown copyright 2021
This publication is licensed under the terms of the Open Government Licence v3.0 except where otherwise stated. To view this licence, visit nationalarchives.gov.uk/doc/open-government-licence/version/3 or write to the Information Policy Team, The National Archives, Kew, London TW9 4DU, or email: psi@nationalarchives.gov.uk.
Where we have identified any third party copyright information you will need to obtain permission from the copyright holders concerned.
This publication is available at https://www.gov.uk/government/statistics/hm-prison-and-probation-service-workforce-quarterly-december-2020/recruitment-diversity-experimental-statistics-q1-2019-to-q4-2020
1. Main Findings
| Around one-fifth of applicants in the period Q1 2019 to Q4 2020 were from BAME backgrounds | Between 1 January 2019 and 31 December 2020, 19.8% of Prison Officer applicants and 18.7% of Operational Support Grade (OSG) applicants were from BAME backgrounds |
| Around three to four percent of applicants in the period covered by this report had declared themselves disabled | For the period covered, 3.3% of Prison Officer applicants and 4.4% of OSG applicants declared themselves as disabled |
| Around half of the applicants in the period Q1 2019 to Q4 2020 were female | For the period covered, 46.1% of Prison Officer applicants and 51.9% of OSG applicants were female |
| There is evidence of a disparity in outcomes when comparing BAME applicants to white applicants | The ethnicity Relative Rate Index (RRI) was 0.57 for Prison Officer applicants and 0.67 for OSG applicants for the 2 years to December 2020 |
| There is evidence of a disparity in outcomes when comparing female applicants to male applicants, for Prison Officer but not OSG candidates | The RRI for gender was 0.67 for Prison Officer applicants, but 1.18 for OSG applicants for the overall period covered by this report |
| There is no evidence of a disparity in outcomes when comparing disabled applicants to non-disabled applicants for OSG candidates or Prison Officers | The disability RRI was 0.77 for Prison Officer applicants and 0.81 for OSG applicants, but both were not statistically significant |
2. Background
- Following the Lammy review [footnote 1], HMPPS made a public commitment that 14% of all new recruits will come from BAME backgrounds by December 2020.
- As at 31 December 2020, 10.8% of all HMPPS staff declared themselves to be from a BAME background. On the same date, 8.3% of all Public Sector Prisons staff and 15.8% of all YCS staff were from a BAME background.
- Prison Officer and Operational Support Grade (OSG) campaigns are run in different parts of the country, recruiting from local populations, at different times. It should therefore be expected that the percentage of BAME applicants will fluctuate over time.
- The Lammy review also recommended that new data should be collected and published with a full breakdown by ethnicity. This experimental statistical release sets out to meet that recommendation.
As these are experimental statistics, we would welcome feedback as to how useful they are, whether different analysis would be preferable, or any other comments about them. If you wish to send any views you may have about these experimental statistics, please use the contact details at the end of this bulletin
Statistics are shown for the following stages of the Prison Officer and Operational Support Grade application process, for campaigns that were run between 1 January 2019 and 31 December 2020:
- applications;
- invitations to assessment/interview;
- provisional offers;
- formal offers; and
- acceptances of a formal offer.
These experimental Official Statistics are used to monitor and evaluate the diversity of applications and appointments. These are newly developed statistics and are currently considered experimental so that users and stakeholders can be involved in the assessment of their suitability and quality.
Recently, there have been a number of recruitment stages that have changed, mainly in the intermediate stages of the recruitment process, such as more roles moving towards using assessment centres. It may not always be possible to capture these updates in the data straightaway which may result in an undercount of candidates at some stages. It is therefore recommended that the statistics in this annex are treated as estimates.
It is important to note that some candidates are still working their way through the recruitment pipeline. Where this is the case, the candidates’ progress is shown up to the last stage they passed prior to 31 December 2020. As a result, the numbers relating to recent quarters will show lower totals for all the stages after initial application.
In the next release of these statistics, numbers will be updated if any information has been recorded to reflect candidates’ further progress. This means that figures shown for the more recent quarters are currently based only on a small proportion of the eventual final data, particularly for the later stages of the process. As the data is updated in future publications there could possibly be significant changes in the proportions and Relative Rate Index values (RRI – please see full explanation on page 6) used to compare the rate of success between groups. For this reason, the figures for the stages after application for the latest quarter have not be shown in Tables 2 and 3.
In some campaigns a merit list may be held, whereby candidates who are successful at assessment/interview are put onto a waiting list until a suitable vacancy opens up. Where this is the case, a candidate may not be offered a post until sometime after the initial application and assessment/interview stages.
The diversity of candidates is monitored at various stages throughout the recruitment process. To assess the relative levels of success we examine the progress of all the candidates who have applied for posts on a quarterly basis. Candidates may apply for multiple roles but only one application per candidate per quarter is included in the analysis, and the application that is included is the one that made it furthest through the process.
A cohort approach is used in the accompanying data tables, with the progress of people through all later stages of the recruitment process shown in the quarter the candidate applied in, regardless of when the subsequent stages happened. For example, if a candidate applied in March 2020 their progress would be represented in Q1 2020 in the data tables, even if the later stages happened in Q2 or Q3 2020. If the candidate applied at the very end of the latest quarter they are likely to only be in the application stage and not represented in any of the later stages of the process.
For the Prison Officer and OSG recruitment campaigns included in this bulletin we examine the volumes of candidates who have progressed through each of the following stages of the recruitment process:
| Public Sector Prison Officer Recruitment Stage | Description |
| Application | The candidate submits an online application for a role as a Prison Officer. To progress to the next stage the candidate will have to pass an online test, which tests candidates’ situational judgement and the mathematical skills needed for the role. Some prisons also invite candidates to attend a familiarisation tour prior to their invitation to the assessment day. |
| Applicants invited to assessment | All candidates who pass the online tests will be invited to attend an assessment day. The assessment day consists of a literacy and language test, a fitness test, role-playing tests with actors playing the part of prisoners, and retake the situational judgement and mathematical skills test. |
| Applicant successful at assessment | If the assessment is passed the candidate will then either immediately be made a provisional offer, or if there is not an immediate vacancy at the prison, the candidate may be placed on a merit list until a vacancy arises and will be made a provisional offer when one does. |
| Applicant made provisional offer | Candidates who have been made a provisional offer will now undergo pre-employment checks including security vetting. |
| Applicant made formal offer | A candidate will be made a formal offer when they pass all the pre-employment checks. |
| Applicant accepts formal offer | Candidate has confirmed acceptance of Formal Offer and this has been recorded on the recruitment system. |
For OSG recruitment there are the following stages:
| OSG Recruitment Stage | Description |
| Application | The candidate submits an online application for a role as an OSG. |
| Applicants invited to interview | Applications are reviewed through a sift process and successful applicants will be invited to Interview. |
| Applicant successful at interview | If the candidate passes the interview they will then either immediately be made a provisional offer, or if there is not an immediate vacancy at the prison, the candidate may be placed on a merit list until a vacancy arises and will be made a provisional offer when one does. |
| Applicant made provisional offer | A candidate who have been made a provisional offer will now undergo pre-employment checks including security vetting. |
| Applicant made formal offer | A candidate will be made a formal offer when they pass all the pre-employment checks |
| Applicant accepts formal offer | Candidate has confirmed acceptance of Formal Offer and this has been recorded on the recruitment system. |
3. Representation percentages
Within the bulletin, representation percentages are presented for the following stages of the recruitment process:
- Initial applications;
- invitations to assessment/interview;
- provisional offers;
- formal offers; and
- acceptances of formal offer.
The diversity statistics in this report are based on self-declared information that applicants have provided on the Oleeo recruitment system. Completion of the data on Oleeo is voluntary, and the information is not considered during the recruitment process. The declaration rates are typically high at above 98 per cent. Some applicants choose not to declare their ethnicity, disability status or gender, or do not complete the information – these applicants are grouped together and included in the ‘Unknown’ group. As this is not a meaningful category those who do not declare their information are not included within the analysis.
The declaration rate is calculated as the total number of valid declarations divided by the total number of cases. Where the declaration rate of a diversity characteristic is in excess of 60 per cent, the representation rate is also presented; this is calculated as the known declarations from the particular group divided by the total number of valid declarations of the characteristic. This represents the best estimate of the true level of representation among all candidates. To date, declaration rates in this data have far exceeded the 60 per cent threshold to allow us to present representation percentages for every stage in the recruitment process. However, it should be noted that for some campaigns in some quarters, the numbers involved can be very small and so any interpretation of them should be treated with caution. In addition, where there are two or fewer individuals in a cell in the accompanying Excel tables, these numbers have been suppressed to avoid disclosure.
Representation percentages allow comparison of the diversity proportions at the various recruitment stages outlined above. This is particularly useful for the application stage, as it provides a picture of the diversity of the pool of applicants, and how closely they represent the general population, or the diverse make-up of a local population where a Prison Officer and OSG recruitment campaign is localised to a particular geographic area. It is also particularly useful at the formal offer stage to illustrate any differences in the diversity proportions at the final stage. However, representation among those receiving a formal offer reflects both the representation among applicants and rates of success for each group at the preceding stages.
To make valid comparisons across time or across different groups requires a measure of disparity of outcomes on a standard scale. This standardised measure of disparity of outcomes is described as the Relative Rate Index (RRI).
Further details on the RRI can be found in the Further Information section at the end of this publication. Caution should be used interpreting these figures as in many cases they may not be statistically significant, particularly where they are based on very low number of applicants. Statistically significant values are indicated in the tables.
We are now actively reviewing this experimental recruitment diversity annex to determine whether it is fit for purpose, and if not, how it might be changed, or even whether to cease its production. Further information on any progress with the review will be included in future HMPPS workforce bulletins as appropriate.
4. Detailed Results
For the 2-year period covered by this report, there were 128,618 applicants for Prison Officer recruitment campaigns, of which 124,141 were for Public Sector Prison and 4,477 were for Youth Custody Services (YCS) campaigns. There were also 41,666 applicants for the Operational Support Grade (OSG) recruitment campaigns run in the period 1 January 2019 to 31 December 2020. COVID-19 had a significant disruption on the recruitment process for Prison Officers and OSG staff during part of 2020. This manifested in two ways – firstly in the number of campaigns and therefore applicants in Q2 and Q3 (only 736 and 3,318 applicants for Prison Officer posts in Q2 and Q3 2020 respectively, compared to over 10,000 in the previous four quarters); and secondly in affecting the subsequent stages after application.
Prison Officers (Summary Table 1a and Table 2)
Figure 1: BAME representation for Prison Officer candidates at each stage of the application process, Q1 2019 to Q4 2020
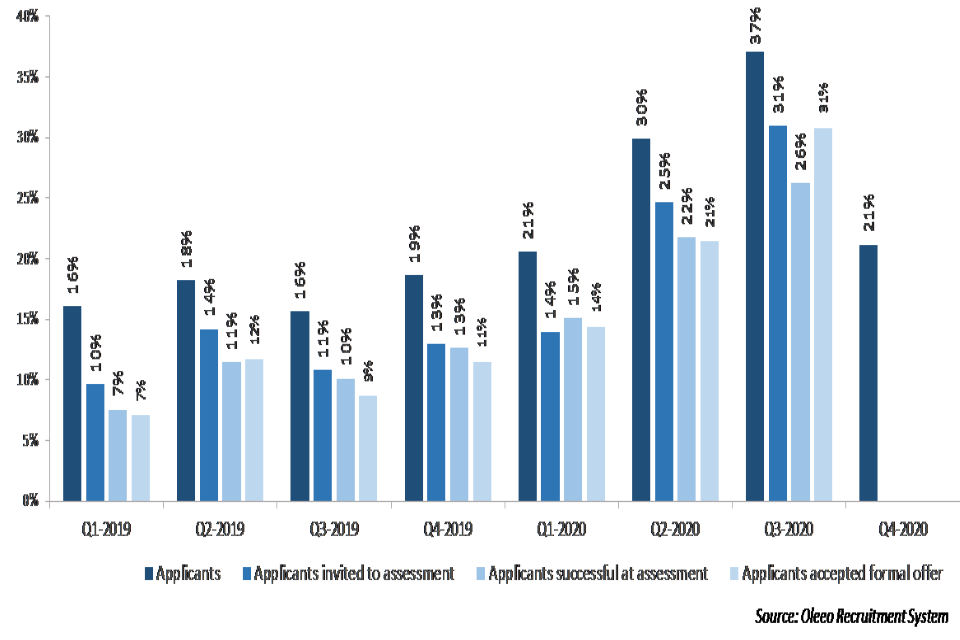
BAME candidates made up 19.8% of all Prison Officer applicants, and 12.3% of formal offers accepted between January 2019 and December 2020. These proportions varied over the quarters of the 24-month period covered by this report, ranging from 15.7% to 37.0% for applicants, and 7.1% to 30.8% for offers formally accepted. These variations would have been dependent on where in the country the campaigns were being run at any particular time, and the makeup of the local working population being recruited from. So, for example, nearly a third (29%) of the total applicants in Q2 2020 were for posts in London prisons, whereas in previous quarters the percentage of posts in London varied from 10 to 19%, thus indicating that the increase in the proportion of posts in London for Q2 2020 likely had an effect in the increase in the proportion of BAME applicants seen in that quarter.
Figure 2: Disability representation for Prison Officer candidates at each stage of the application process, Q1 2019 to Q4 2020
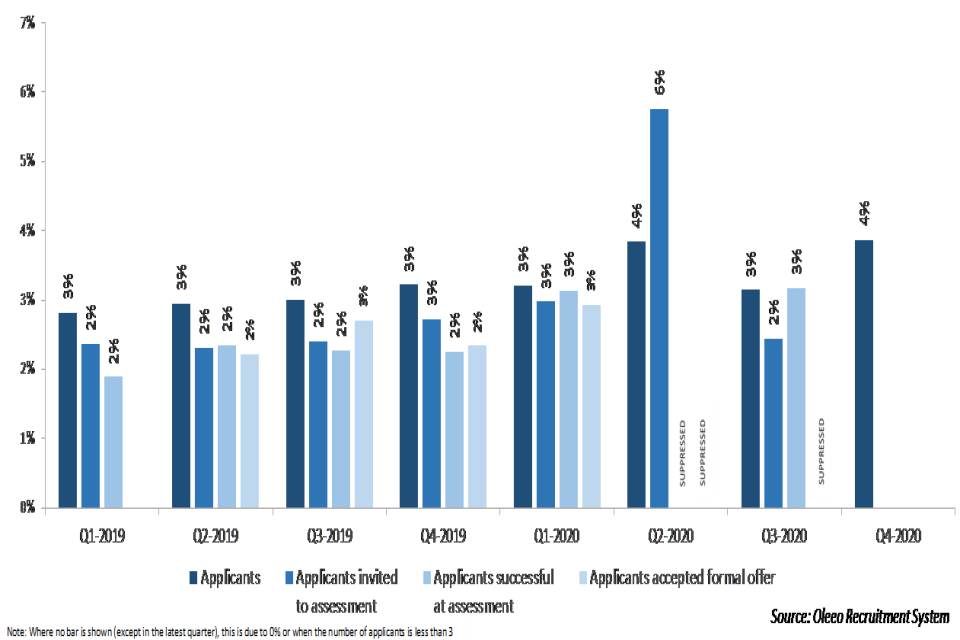
Disabled candidates made up 3.3% of all Prison Officer applicants, and 2.5% of formal offers accepted between January 2019 and December 2020. These proportions generally remained similar over the 24-month period.
Figure 3: Female representation for Prison Officer candidates at each stage of the application process, Q1 2019 to Q4 2020
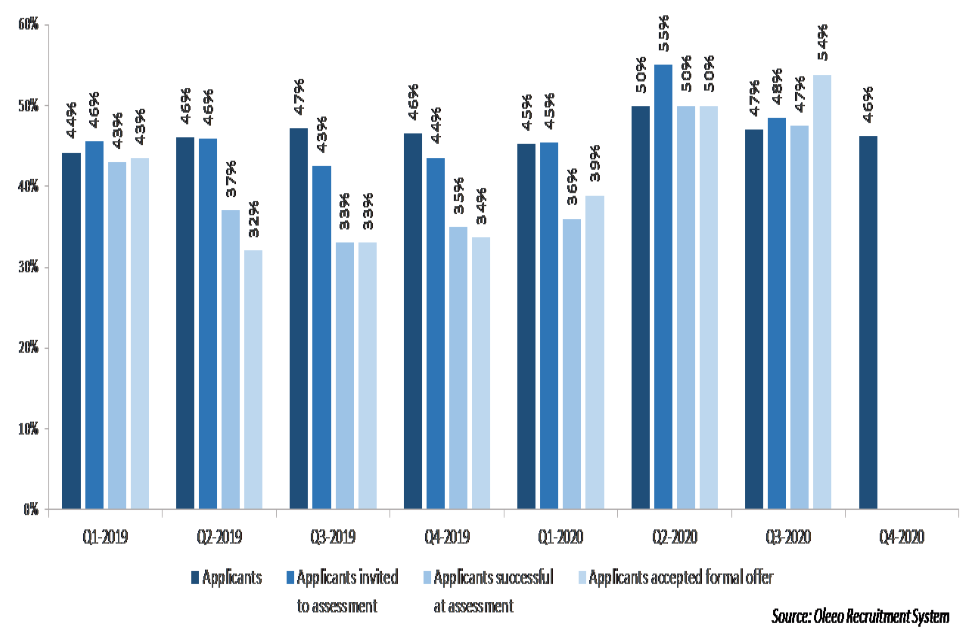
Female candidates made up 46.1% of all Prison Officer applicants, and 36.4% of formal offers accepted between January 2019 and December 2020. These proportions remained similar over the 24-month period. Relative comparison of the overall rates for the 24-month period by ethnicity gave a statistically significant RRI value of 0.57, indicating a disparity of outcomes[footnote 2], with BAME candidates having around half the rate of success compared with white candidates. Similarly, a statistically significant RRI value of 0.67 when comparing the overall rates by gender indicates a level of disparity in the success between male and female applicants. The overall RRI value for disability, over the same period, was 0.77 but not statistically significant, meaning that no clear inferences can be made.
4.1 Public Sector Prisons (PSP) Prison Officers (Summary Table 1b and Table 2a)
Figure 4: BAME representation for PSP Prison Officer candidates at each stage of the application process, Q1 2019 to Q4 2020
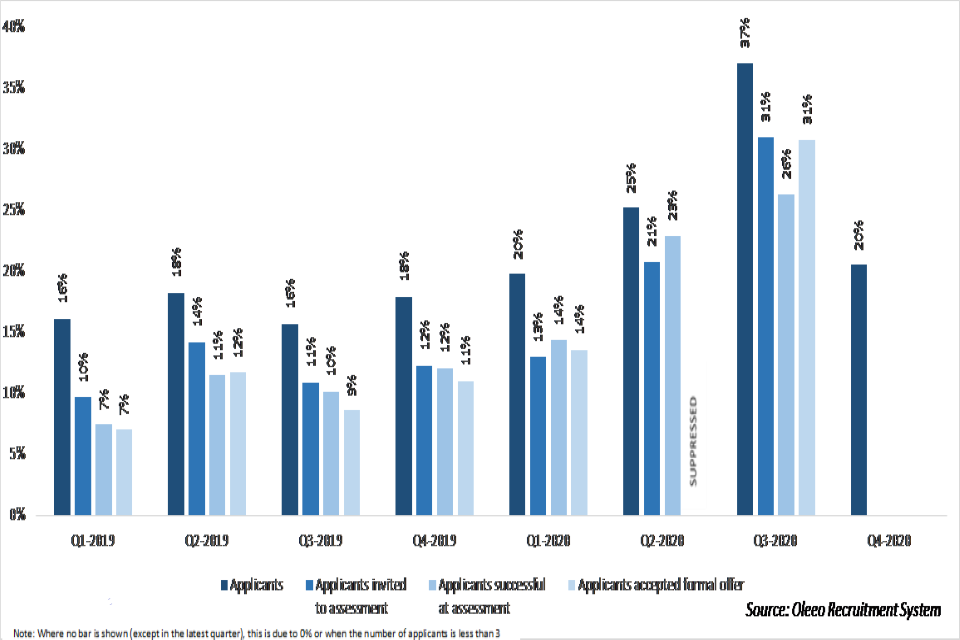
BAME applicants made up 19.2% of all PSP Prison Officer applicants and 11.7% of formal offers accepted over the last 24 months. As for total Prison Officers, the proportion of BAME candidates for PSP Prison Officers varied over the quarters (for applicants from 15.7% to 37.0% and for offers accepted from 7.1% to 30.8%), in part due to the campaigns being run in different areas and differences in the makeup of their local working populations.
Figure 5: Disability representation for PSP Prison Officer candidates at each stage of the application process, Q1 2019 to Q4 2020
In line with findings for all Prison Officers, disabled PSP PO candidates made up 3.3% of all PSP applicants, and 2.6% of formal offers accepted between January 2019 and December 2020. These proportions generally remained similar across all stages of the process over the 24-month period.
Figure 6: Female representation for PSP Prison Officer candidates at each stage of the application process, Q1 2019 to Q4 2020
Female PSP Prison Officer candidates made up 45.6% of all PSP applicants, and 35.6% of formal offers accepted between January 2019 and December 2020. In line with findings related to all Prison Officers, these proportions generally remained similar across the 24-month period. The RRI values for ethnicity and gender were similar for PSP applicants as for all Prison Officers, with statistically significant values of 0.56 and 0.63 respectively for the whole period, indicating that BAME and female candidates had lower rates of success compared with white and male candidates respectively over the period. The overall RRI value for disability, over the same period, was 0.78 but not statistically significant, meaning that there was no disparity between disabled and non-disabled candidates.
4.2 Youth Custody Service (YCS) Prison Officers (Summary Table 1c and Table 2b)
The number of overall applicants for YCS Prison Officers was much smaller (4,477 applicants) compared with PSP POs (124,141 applicants) during the 2-year period covered by this report. The numbers involved in each quarter are relatively small and therefore any conclusions should be treated with caution. Please note in 2019 there were no active recruitment campaigns for Prison Officers in YCS sites due to the implementation of the Fast Track Candidates being brought in. These sites have had merit lists in place from previous campaigns to fill any vacancies in this time. Since then, both Business as Usual and Fast Track adverts at all sites have been advertised.
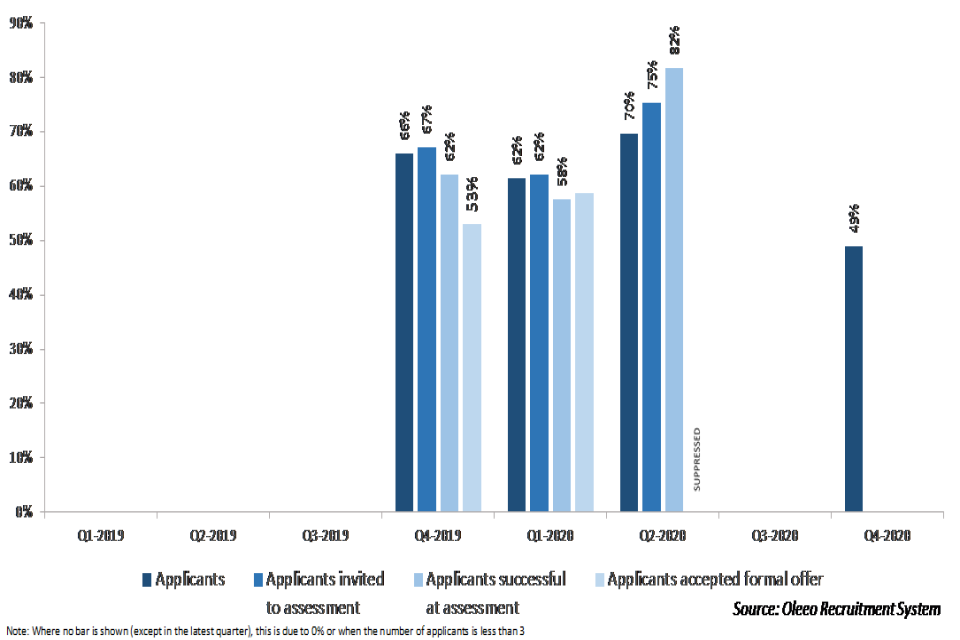
Figure 7: BAME representation for YCS Prison Officer candidates at each stage of the application process, Q1 2019 to Q4 2020
BAME applicants made up 36.0% of YCS Prison Officer applicants and 25.6% of formal offers accepted over the whole period. These proportions of BAME applicants for YCS Prison Officer roles were higher than for those PSP Prison Officers. This is because YCS establishments are generally located in areas where the BAME proportion in the local working population is higher, particularly in the case of Feltham the largest of the YCS establishments which is based in London with its higher BAME population. As with PSP Prison Officers, the proportion of BAME YCS applicants varied between quarters, from 33.2% to 47.1%.
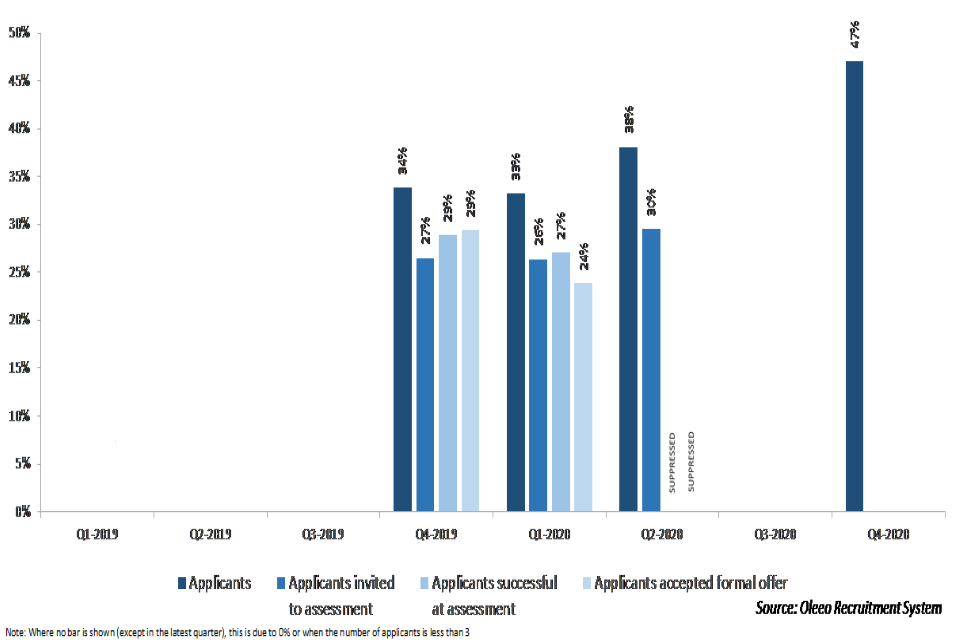
Figure 8: Disability representation for YCS Prison Officer candidates at each stage of the application process, Q1 2019 to Q4 2020
Disabled YCS Prison Officer candidates made up 4.2% of all YCS applicants in the period January 2019 to December 2020. Please note the number of disabled candidates accepting formal offers over the period is too small to show.
Figure 9: Female representation for YCS Prison Officer candidates at each stage of the application process, Q1 2019 to Q4 2020
Female YCS Prison Officer candidates made up 60.9% of all YCS applicants and 57.3% of formal offers accepted between January 2019 and December 2020. Looking at the RRI, the overall value was 0.61 for ethnicity, 0.86 for gender, but only the former was statistically significant, indicating a disparity of outcomes between BAME and White candidates.
Operational Support Grades (Summary Table 1d and Table 3)
Due to the small numbers involved (41,666 total applicants for the 2-year period), the campaigns for Public Sector Prisons and the Youth Custody Service for Operational Support Grades have been combined; however, the numbers involved in each quarter are still relatively small and therefore any conclusions should be treated with caution.
Figure 10: BAME representation for Operational Support Grade (OSG) candidates at each stage of the application process, Q1 2019 to Q4 2020
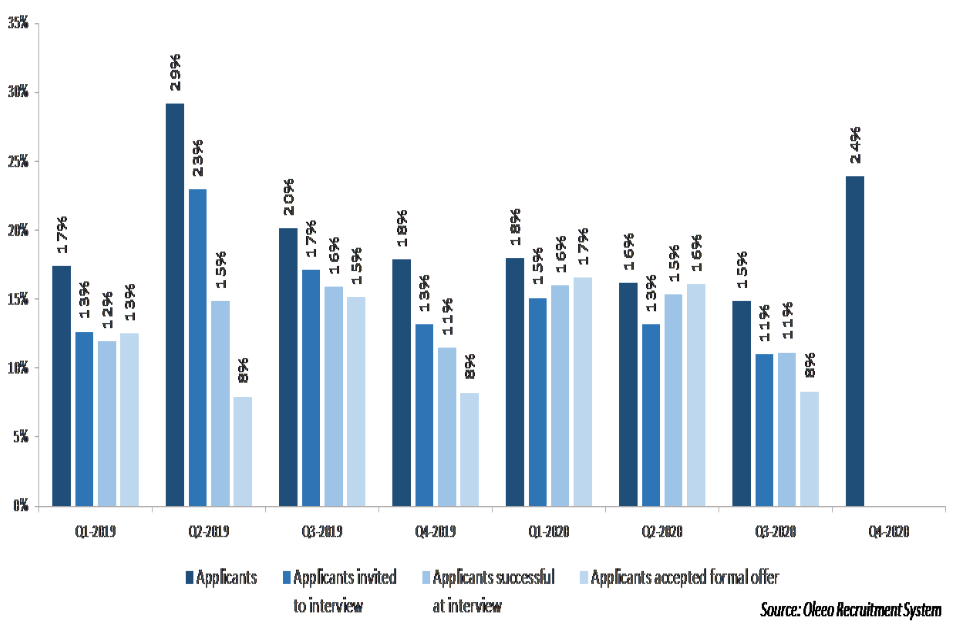
For the period January 2019 to December 2020, BAME candidates made up 18.7% of applicants and 13.4% of formal offers accepted. These proportions varied over the 24-month period covered by this report, ranging from 14.8% to 29.2% for applicants, and 7.9% to 16.5% for offers formally accepted. These variations would have been dependent on where in the country the campaigns were being run at any particular time, and the makeup of the local working population being recruited from.
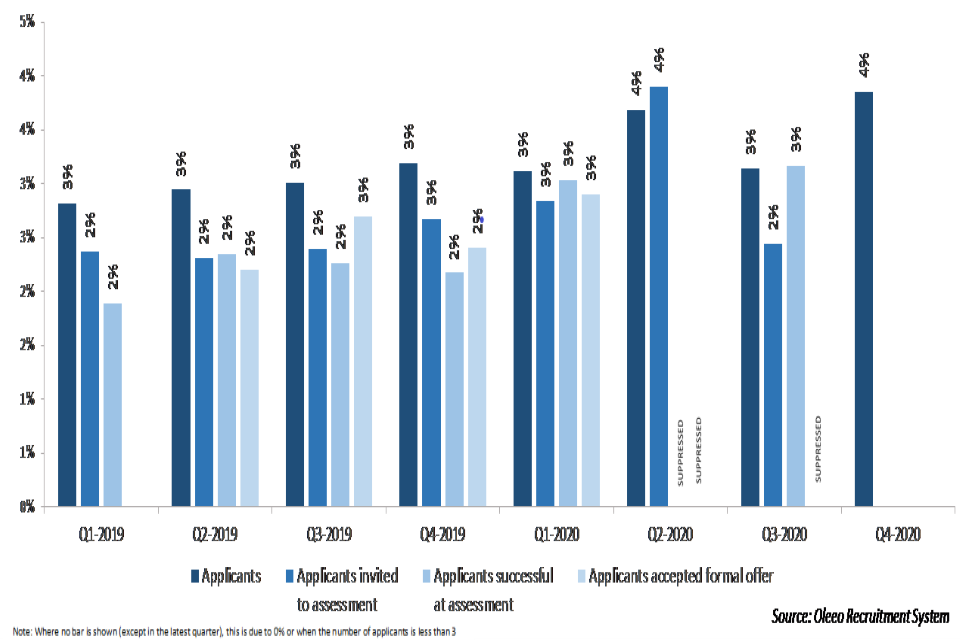
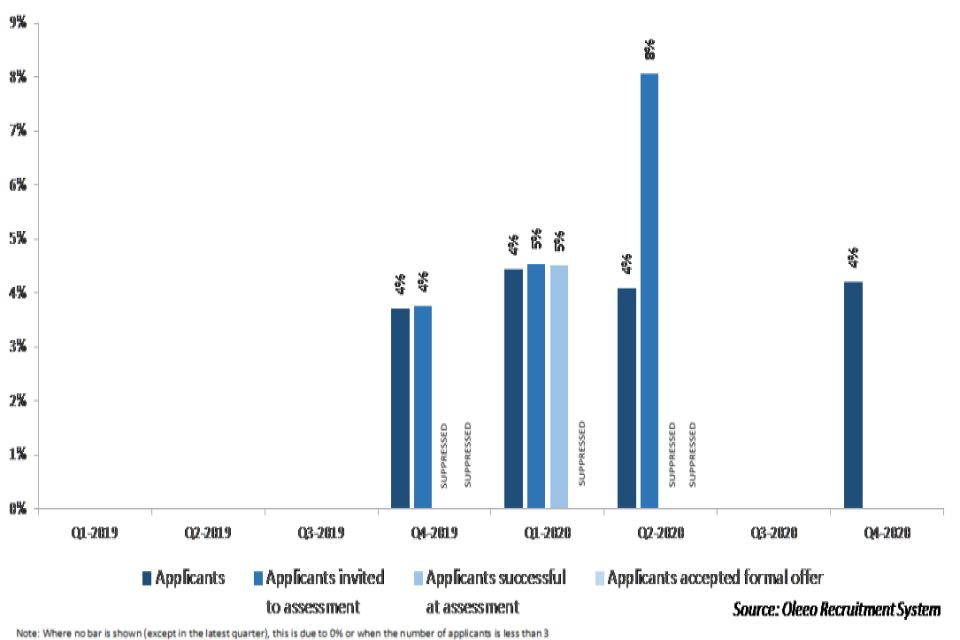
Figure 11: Disability representation for Operational Support Grade (OSG) candidates at each stage of the application process, Q1 2019 to Q4 2020
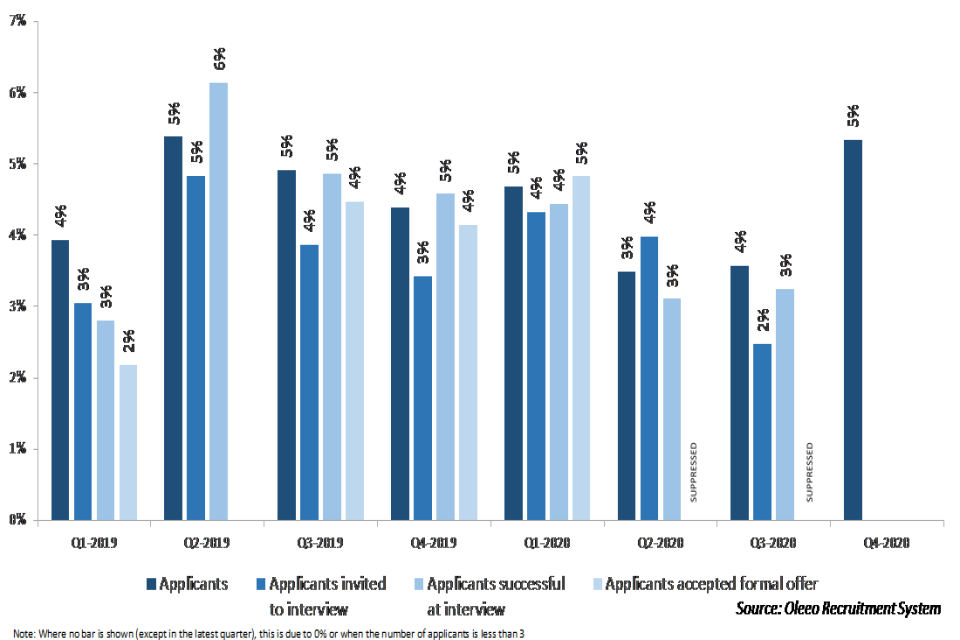
Disabled candidates made up 4.4% of all OSG applicants, and 3.6% of formal offers accepted between January 2019 and December 2020. These proportions (where not suppressed due to small numbers) were generally similar across the quarters of the period covered by this report.
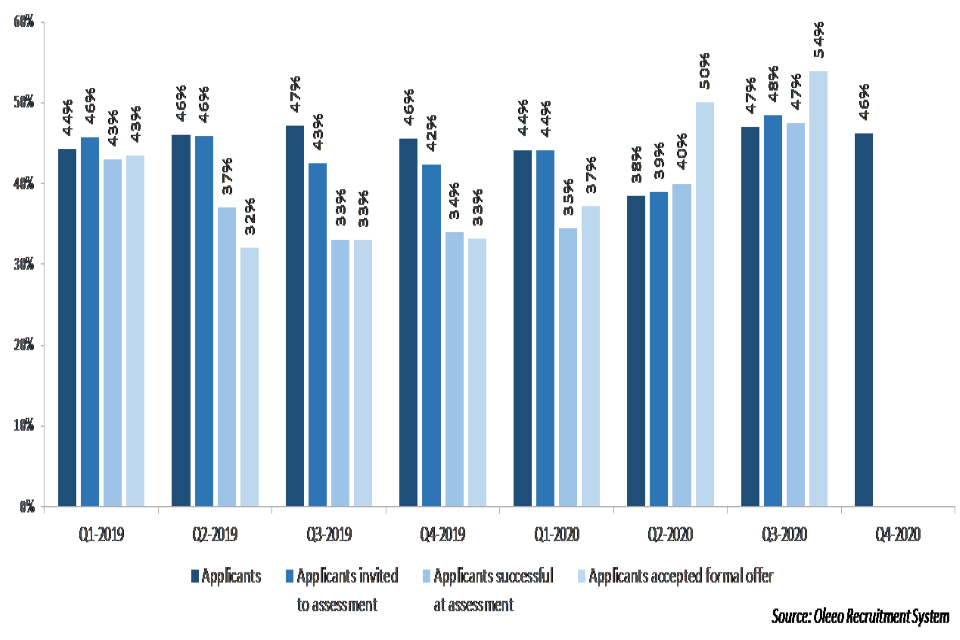
Figure 12: Female representation for Operational Support Grade (OSG) candidates at each stage of the application process, Q1 2019 to Q4 2020
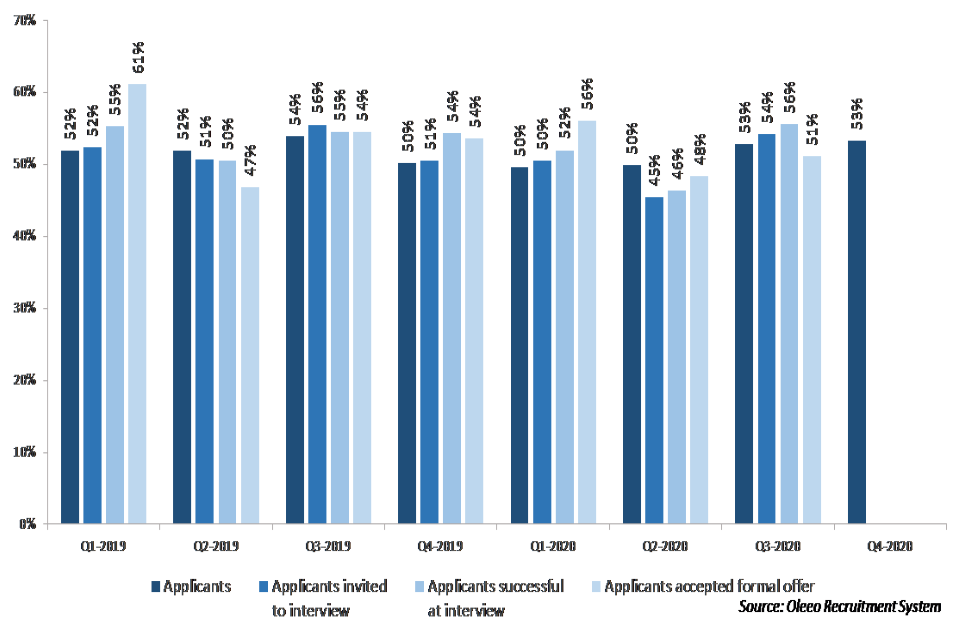
Female OSG candidates made up 51.9% of all OSG applicants, and 55.9% of formal offers accepted between January 2019 and December 2020. These proportions remained similar across the period covered by this report. Relative comparison of the overall rates for the 24-month period by ethnicity gave a statistically significant RRI value of 0.67, which suggests that there was disparity in the outcomes between BAME and white candidates. The overall RRI value for gender, over the same period was 1.18, which was statistically significant but not outside the 0,8 to 1.25 range. This means that no clear inferences can be made about the differences in the outcomes for men and women. The overall RRI value for disability, over the 2-year period, was 0.81 but not statistically significant, meaning that no clear inferences can be made.
5. Further information
5.1 Technical information
The diversity statistics in this report are based on self-declared information that applicants have provided on the Oleeo recruitment system. Completion of the data on Oleeo is voluntary. Some applicants choose not to declare their details or do not complete the information – these applicants are grouped together and included in the ‘Unknown’ group. This is not a meaningful category, and accordingly those who do not declare their information cannot be included within analysis of the outcomes.
Any records downloaded from the Oleeo system with a time stamp after 23:59 on the last day of December 2020 have been removed. Some records do not have a timestamp for some of the recruitment stages. Where this is the case, we have assumed that where a candidate has reached a stage, he or she passed all the previous stages, even if they don’t actually have the relevant timestamps for all those earlier stages.
A single candidate can make multiple applications. Where this is the case, duplicates have been removed to leave a single instance of each candidate in each quarterly cohort (an individual can appear a maximum of 6 times in the table). The application which got furthest in the process is selected. If there are several applications from different quarters at the same stage, the earliest submission is selected. This selection is done before we split the data into Public Sector Prisons and Youth Custody Service; this is done to ensure that individuals are not counted twice in the overall totals, and if an individual applies to both PSP and YCS in the same quarter only one application is reported. This ensures that the volumes in PSP and YCS tables sum to give the volumes in the overall table.
Applications are categorised as Youth Custody Service (YCS) if the Oleeo ‘building/site’ field corresponds to Cookham Wood, Feltham, Medway Secure Training Centre, Werrington or Wetherby. All other applications are considered to be for a PSP. Oleeo does not separate Feltham A and B sites, so all Feltham applications are categorised as YCS in the tables in this report.
Within the Prison Officer applications, the vast majority of roles are advertised as “Prison Officer”; however, recently there have been a small number that are advertised as “youth officer”. This is a Prison Officer role that aimed particularly at Prison Officers who will work with juvenile offenders in the YCS. This Youth Officer role has been included with Prison Officers in this publication.
5.2 Relative Rate Index (RRI)
The RRI, or Relative Rate Index,[footnote 3] gives a standardised measure of difference between groups. This has been adopted in line with the Judicial Appointments Commission use of the RRI for presenting similar data, which was reviewed by MoJ statisticians in February 2020[footnote 4], and the RRI was widely used within the Lammy Review[footnote 1]. These statistics use this metric to give a standardised view of any disparity of outcomes on recruitment by diversity characteristic.
The RRI is calculated by dividing the rate of success (i.e. the percentage of those who applied that accepted a formal offer) for one group by the rate of success for the other group with a diversity characteristic, thus creating a single standardised ratio measure of relative difference in outcomes between those two groups. If the rates were the same, the result would be a value of 1, which would indicate identical rates for both groups (that is a parity of outcomes). Deviation from 1 in either direction suggests a difference in the rates of outcomes.
Considering differences in the two success rates on a relative basis on a standard scale, enables direct comparison of any disparity of outcomes between groups across exercises and across time. By convention, the RRI has been calculated with the under-represented group as the numerator, with the baseline reference group as the denominator. However, calculation in the reverse direction is equivalent and would result in the same interpretation.
When comparing rates and the RRI, it is important to consider uncertainty, to avoid the over-interpretation of fluctuations in outcomes that may be the result of chance alone. Tests of statistical significance have been conducted on the estimates in this publication that are based on the full 24-month period in order to ensure the interpretation of the RRI values take full account of the probability that the observed outcome may be the result of chance alone. Where a RRI is significant at the 95% confidence level, this has been denoted against the RRIs in Table 1 with a ‘**’.
In addition to consideration of the extent to which chance variation is involved in any apparent difference in the rates, it is important to consider what is known as practical significance– whether the actual magnitude of the apparent difference in the rates is sufficient to have a material impact, or whether the difference is small and of little material impact. To represent a meaningful disparity of outcomes, an apparent difference must be both statistically significant (unlikely to be the result of chance alone), and of sufficient magnitude to have practical significance.
To further aid interpretation using the ‘4/5th rule of thumb for adverse impact’ [footnote 5], RRI values that fall within a range of 0.8 to 1.25 (the zone of tolerance) are not likely to indicate a difference in outcomes resulting in a disparity having practical significance. This sets a range around parity, within which fluctuations at least in part due to natural variation would not be taken as evidence of a disparity of outcomes representative of adverse impact to one group. This does not imply that an RRI falling outside of this range is indicative of the presence of a meaningful disparity.
As such, both statistical significance and practical significance where an RRI falls outside of the range 0.8 to 1.25 should be generally required to establish evidence of a disparity.
Findings suggestive of a disparity of outcome do not necessarily imply issues within the recruitment process and may reflect other differences between groups, such as level of experience. As rates are the combined result of representation among applicants and those accepting a formal offer, it is essential that a disparity of outcomes is interpreted in conjunction with a view on representation among applicants and success at each stage of the recruitment process.
5.3 Notes and Conventions
The following symbols are used within the tables in this experimental statistics release:
| ~ | values of two or fewer which have been suppressed |
| * | percentage suppressed due to small numbers. Where small numbers are present, percentages are highly volatile and potentially misleading. |
| - | denotes relative rate index not calculated due to suppressed values |
| .. | denotes data not available. |
5.4 Experimental Statistics
The statistics in this report are classified as experimental Official Statistics. Experimental Official Statistics are statistics that are in the testing phase and not yet fully developed. This report has been designated experimental the methodology has only recently been adopted and the results published. As such, the methods and approach used in this report are subject to modification. More information about the different types of Official Statistics can be found here: https://uksa.statisticsauthority.gov.uk/about-the-authority/what-we-do/uk-statistical-system/types-of-official-statistics/
Feedback relating to the content of this release should be sent to: statistics.enquiries@justice.gov.uk
5.5 Related statistics
These experimental Official Statistics have been published alongside Her Majesty’s Prison and Probation Service (HMPPS) Workforce Statistics Bulletin, as at 31 December 2020.
5.6 Contact
Press enquiries should be directed to the Ministry of Justice press office:
Tel: 020 3334 3536
Email: newsdesk@justice.gsi.gov.uk
Other enquiries about these statistics should be directed to:
Wincen Lowe
Data and Evidence as a Service
Ministry of Justice
10 South Colonnade
London
E14 4PH
Email: statistics.enquiries@justice.gov.uk
Next update: 19 August 2021
URL: www.gov.uk/government/collections/national-offender-management-service-workforce-statistics
© Crown copyright
Produced by the Ministry of Justice
Alternative formats are available on request from statistics.enquiries@justice.gsi.gov.uk
-
https://www.gov.uk/government/organisations/lammy-review ↩ ↩2
-
RRI values falling outside the range 0.80 to 1.25 are outside the range within which the magnitude of the difference in rates would not normally represent evidence of a disparity of outcome. ↩
-
Altman DG (1991) Practical statistics for medical research. London: Chapman and Hall ↩
-
https://assets.publishing.service.gov.uk/government/uploads/system/uploads/attachment_data/file/869028/Methodology_Review_Report.pdf ↩
-
Dan Biddle. Adverse Impact and Test Validation: A Practitioner’s Guide to Valid and Defensible Employment Testing. Aldershot, Hants, England: Gower Technical Press. pp. 2–5. ISBN 0-566-08778-2. Toward a Coherent Test for Disparate Impact Discrimination: Peresie, J.L. 2009 www.repository.law.indiana.edu/cgi/viewcontent.cgi?referer=&httpsredir=1&article=1120&context=ilj ↩