United Kingdom Poultry and Poultry Meat Statistics – February 2024
Updated 20 February 2025

© Crown copyright 2025
This publication is licensed under the terms of the Open Government Licence v3.0 except where otherwise stated. To view this licence, visit nationalarchives.gov.uk/doc/open-government-licence/version/3 or write to the Information Policy Team, The National Archives, Kew, London TW9 4DU, or email: psi@nationalarchives.gov.uk.
Where we have identified any third party copyright information you will need to obtain permission from the copyright holders concerned.
This publication is available at https://www.gov.uk/government/statistics/historical-statistics-notices-on-poultry-and-poultry-meat-production-2024/united-kingdom-poultry-and-poultry-meat-statistics-february-2024
This release shows the latest monthly information on poultry statistics, including hatchery output, slaughtering and meat production volumes.
1. Key messages
February 2024 in comparison to February 2023:
- UK commercial layer chick placings were up 30% at 3.2 million chicks - table 3.3
- UK broiler chick placings were down 1.2% at 90.8 million chicks - table 3.3
- Turkey chick placings were down 4.6% at 0.5 million chicks - table 3.3
- Turkey slaughterings were up 19% at 0.6 million birds - table 4.1
- UK broiler slaughterings were up 2.1% at 88.4 million birds - table 4.1
- Total UK poultry meat production was up 2.6% at 155.7 thousand tonnes
2. Commentary
The number of eggs set each month indicates how many chicks will be available for placing into poultry systems in future months. Hen eggs take around 21 days to hatch, turkey eggs take around 28 days. The number of placed chicks each month indicates future volumes of poultry meat and egg production. Consumer demand strongly affects broiler chick and turkey poult placings. There are clear peaks (of turkeys) and troughs (of broilers) in the average weekly placings figures in the months running up to Christmas (Figs 3.1 and 3.2). This translates into equivalent high/low levels in the slaughtering volumes over the Christmas period (Figs 4.1 and 4.2).
3. Numbers of eggs set and chicks placed by UK hatcheries
This section contains tables and charts that indicate the number of eggs set and chicks placed by United Kingdom hatcheries in the most recent months.
Please note that the surveys are not calendar months. They are statistical months containing either 4 or 5 weeks. In order to remove the statistical month effect and give a clearer indication of trends, weekly average numbers have been used. The Methodology section provides more explanation of the statistical week system.
Table 3.1: Number of eggs set per month by UK Hatcheries (millions)
| Feb 23 | Dec 23 | Jan 24 | Feb 24 | yr on yr | |
|---|---|---|---|---|---|
| 4 weeks | 4 weeks | 5 weeks | 4 weeks | % change | |
| Commercial broilers (a) | 104.5 | 109.5 | 129.2 | 101.2 | -3.2% |
| Broiler breeders (a) (b) | 5.3 | 5.5 | 6.5 | 4.9 | -6.6% |
| Turkeys (c) | 0.7 | 0.7 | 0.9 | 0.7 | -4.4% |
| Commercial layers (c) | 7.1 | 6.3 | 9.9 | 9.0 | 27% |
(a) Includes eggs set to produce chicks for placing outside the UK
(b) Includes Broiler parents and grandparents
(c) Only includes eggs set for commercial stock, including those for placing outside the UK
(d) For yearly comparisons please note that December 2022 was 5-week month in a 53 week statistical year.
Table 3.2: Average number of eggs set per week by UK Hatcheries (millions)
| Feb 23 | Dec 23 | Jan 24 | Feb 24 | % change | |
|---|---|---|---|---|---|
| Commercial broilers (a) | 26.1 | 27.4 | 25.8 | 25.3 | -2.1% |
| Broiler breeders (a) (b) | 1.3 | 1.4 | 1.3 | 1.2 | -5.5% |
| Turkeys (c) | 0.2 | 0.2 | 0.2 | 0.2 | -9.6% |
| Commercial layers (c) | 1.8 | 1.6 | 2.0 | 2.2 | 14% |
(a) Includes eggs set to produce chicks for placing outside the UK
(b) Includes Broiler parents and grandparents
(c) Only includes eggs set for commercial stock, including those for placing outside the UK
(d) For yearly comparisons please note that December 2022 was 5-week month in a 53 week statistical year.
Table 3.3: Chicks and poults placed per month in the UK by UK Hatcheries (millions)
| Feb 23 | Dec 23 | Jan 24 | Feb 24 | yr on yr | |
|---|---|---|---|---|---|
| 4 weeks | 4 weeks | 5 weeks | 4 weeks | % change | |
| Commercial broilers (a) | 91.9 | 92.4 | 110.6 | 90.8 | -1.2% |
| Broiler breeders (b) | 0.6 | 0.6 | 0.9 | 0.5 | -23% |
| Turkey poults (c) | 0.6 | 0.6 | 0.6 | 0.5 | -4.6% |
| Commercial layers | 2.5 | 2.5 | 2.8 | 3.2 | 30% |
(a) Includes ‘by-product’ chicks
(b) Female parents only. Excludes grandparent chicks and ‘by-product’ chicks. Includes imported female parent chicks
(c) Including female breeder poults (d) For yearly comparisons please note that December 2022 was 5-week month in a 53 week statistical year.
Table 3.4: Average numbers of chicks and poults placed per week in the UK by UK Hatcheries (millions)
| Feb 23 | Dec 23 | Jan 24 | Feb 24 | Month % change | |
|---|---|---|---|---|---|
| Commercial broilers (a) | 23.0 | 23.1 | 22.1 | 22.7 | 2.6% |
| Broiler breeders (b) | 0.2 | 0.2 | 0.2 | 0.1 | -28% |
| Turkey poults (c) | 0.1 | 0.1 | 0.1 | 0.1 | 3.1% |
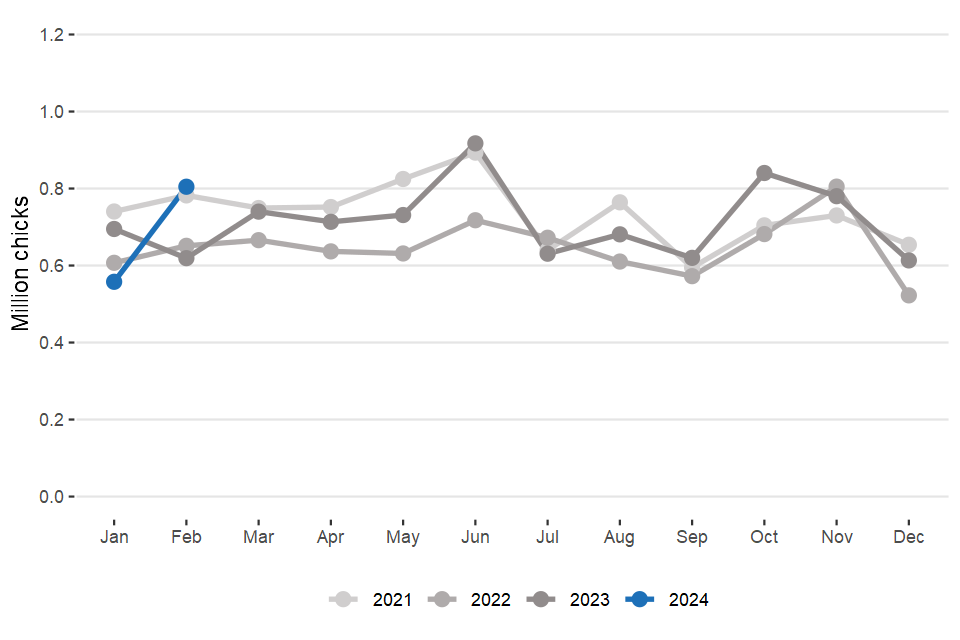
| Commercial layers | 0.6 | 0.6 | 0.6 | 0.8 | 44% |
(a) Includes ‘by-product’ chicks
(b) Female parents only. Excludes grandparent chicks and ‘by-product’ chicks. Includes imported female parent chicks
(c) Including female breeder poults
(d) For yearly comparisons please note that December 2022 was 5-week month in a 53 week statistical year.
Figure 3.1: Average number of broiler chicks placed per week by UK Hatcheries
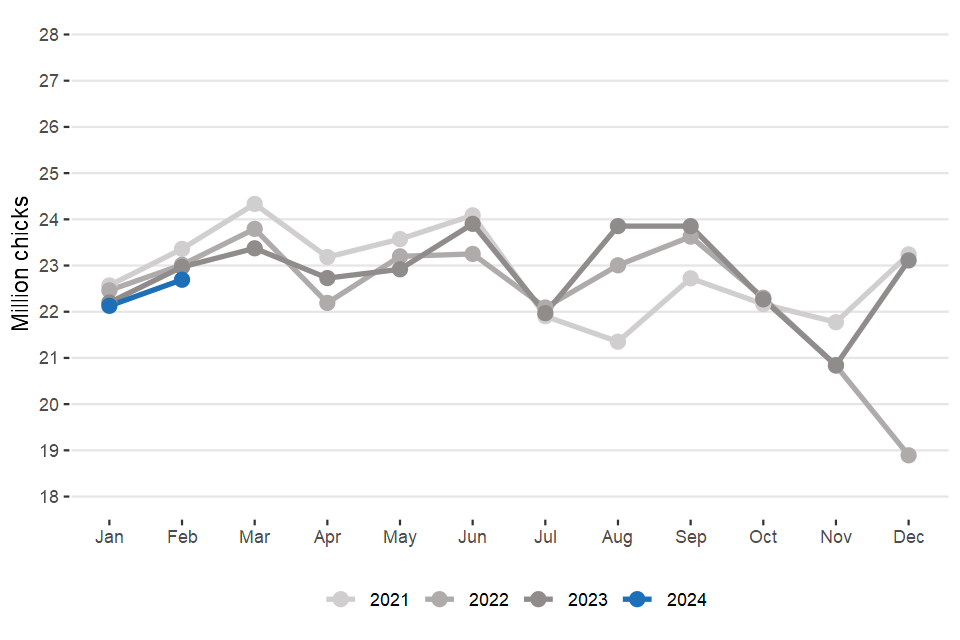
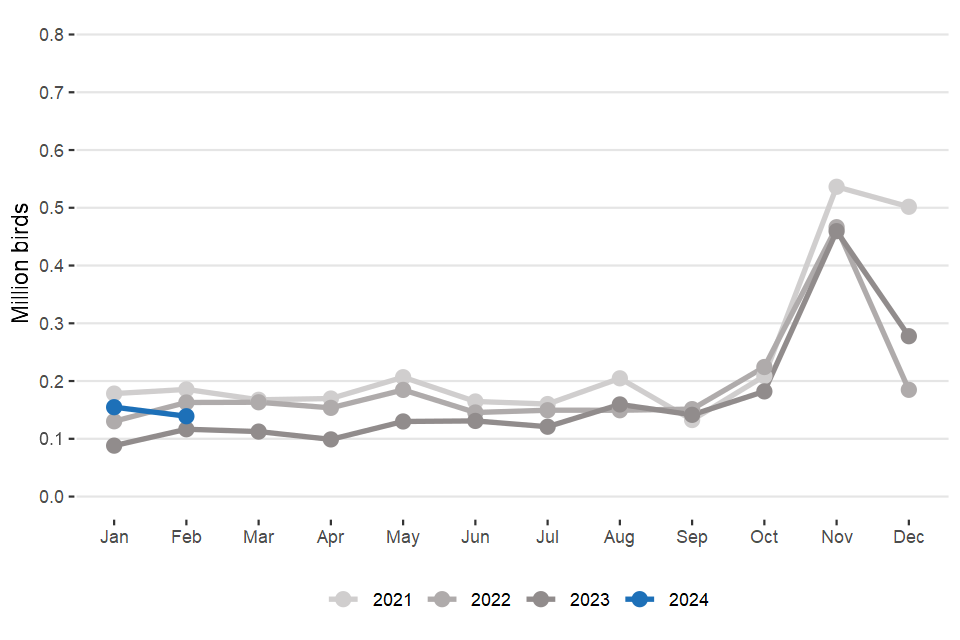
Figure 3.2: Average number of turkey poults placed per week by UK Hatcheries
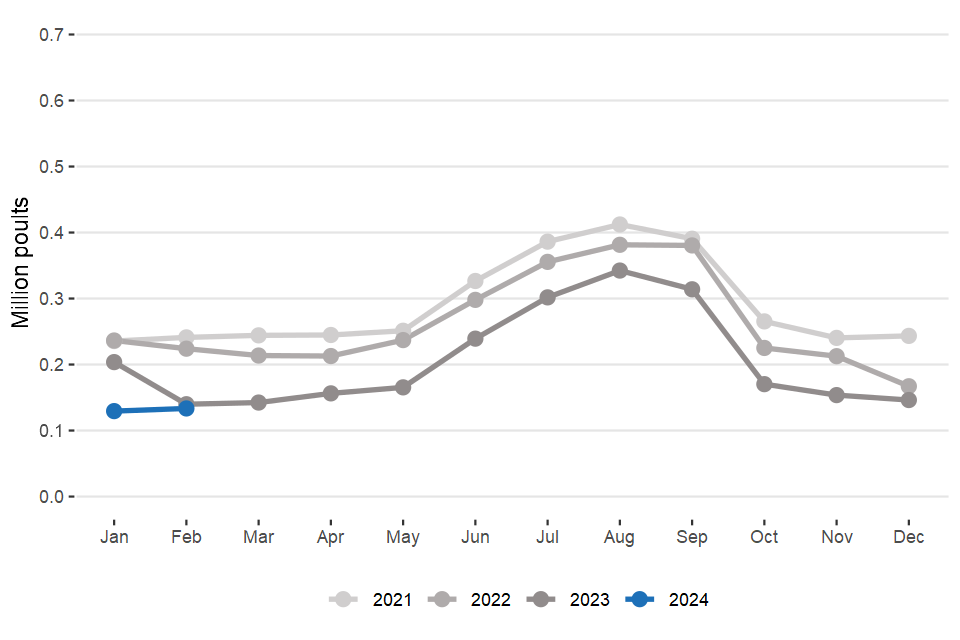
Figure 3.3: Average number of layer chicks placed per week by UK Hatcheries
4. Poultry meat production
This section shows the number of poultry slaughtered and the average liveweights of poultry; together these indicate the volume of poultry meat production in the UK.
As in earlier tables, weekly averages are included to remove the statistical month effect.
Table 4.1: Number of poultry slaughtered per month in the UK (million birds)
| Feb 23 | Dec 23 | Jan 24 | Feb 24 | yr on yr | |
|---|---|---|---|---|---|
| 4 weeks | 4 weeks | 5 weeks | 4 weeks | % change | |
| Broilers | 86.7 | 74.5 | 108.4 | 88.4 | 2.1% |
| Boiling fowl (a) | 3.1 | 2.8 | 2.8 | 2.8 | -10% |
| Turkeys | 0.5 | 1.1 | 0.8 | 0.6 | 19% |
(a) Includes spent hens and spent breeders
(b) For yearly comparisons please note that December 2022 was 5-week month in a 53 week statistical year.
Table 4.2: Average number of poultry slaughtered per week in the UK (million birds)
| Feb 23 | Dec 23 | Jan 24 | Feb 24 | Month % change | |
|---|---|---|---|---|---|
| Broilers | 21.7 | 18.6 | 21.7 | 22.1 | 2.0% |
| Boiling fowl (a) | 0.8 | 0.7 | 0.6 | 0.7 | 21% |
| Turkeys | 0.1 | 0.3 | 0.2 | 0.1 | -10% |
(a) Includes spent hens and spent breeders
(b) For yearly comparisons please note that December 2022 was 5-week month in a 53 week statistical year.
Table 4.3: Average liveweights per bird at point of slaughter in England & Wales (kilograms)
| Feb 23 | Dec 23 | Jan 24 | Feb 24 | year on year % change | |
|---|---|---|---|---|---|
| Broilers | 2.3 | 2.3 | 2.3 | 2.3 | -0.1% |
| Boiling fowl | 2.3 | 2.1 | 2.0 | 2.4 | 3.9% |
| Turkeys |
(b) The average turkey weight has been suppressed due to a low survey response rate.
Table 4.4: Volume of poultry meat produced per month in the UK (thousand tonnes carcase weight)(a)
| Feb 23 | Dec 23 | Jan 24 | Feb 24 | yr on yr | |
|---|---|---|---|---|---|
| 4 weeks | 4 weeks | 5 weeks | 4 weeks | % change | |
| Broilers | 139.9 | 121.5 | 179.4 | 142.8 | 2.1% |
| Boiling fowl | 4.7 | 3.9 | 3.9 | 4.3 | -7.0% |
| Turkeys | |||||
| Ducks | |||||
| Total (b) |
(a) Converted to whole bird equivalent carcase weight, net of offal
(b) Excludes other poultry types, e.g. geese
(c) The volume of turkey and duck meat produced has been suppressed due to a low survey response rate.
(d) For yearly comparisons please note that December 2022 was 5-week month in a 53 week statistical year.
Figure 4.1: Average number of broilers slaughtered per week in the UK
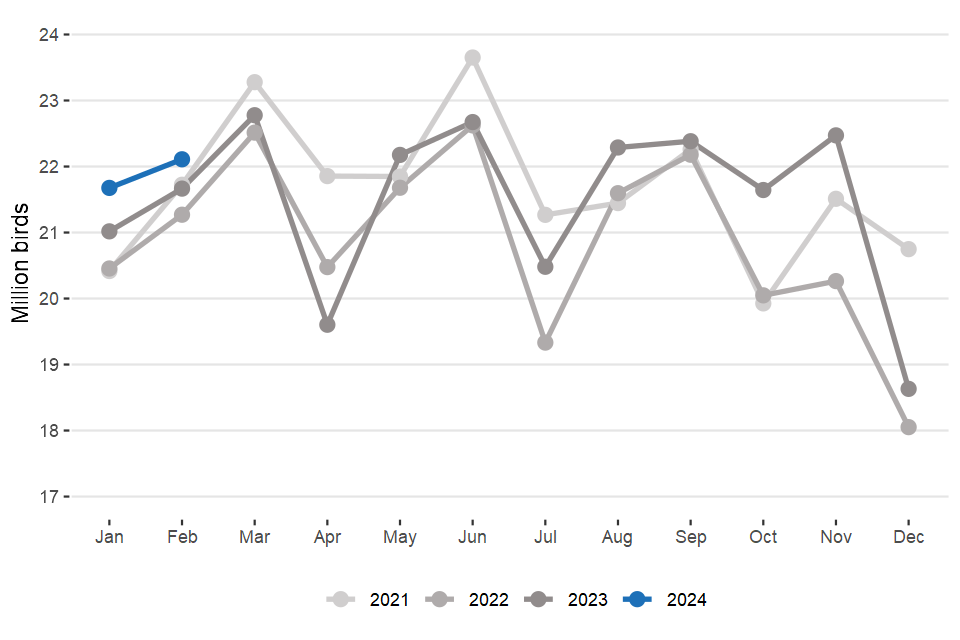
Figure 4.2: Average numbers of turkeys slaughtered per week in the UK
5. About these statistics
5.1 Methodology
From July 2020 the methodology of poultry slaughterings and meat production for England and Wales has changed. Poultry slaughter numbers are now provided by the Food Standards Agency (FSA) and cover all England and Wales slaughterhouses. The FSA slaughter figures are converted into a statistical month format; and meat production statistics are estimated from these statistical month FSA slaughter figures. Scotland and Northern Ireland poultry slaughterings and meat production figures continue to use the pre-July 2020 methodology. For data pre-July 2020, poultry slaughterings and poultry meat production statistics are estimated from the number of chicks placed by hatcheries and day old chick imports using industry advice on life-spans and mortality.
Average liveweights for each type of poultry are obtained from Defra’s monthly survey of England and Wales poultry slaughterhouses. This is a sample survey of large poultry slaughterhouses, around 26 respondents. Similar surveys are run in Scotland and Northern Ireland. Meat production is calculated from the estimated number of birds slaughtered and the average liveweights. The liveweight is converted to carcase weight using industry advice on conversion factors.
Monthly survey results are produced using the statistical week system (this enables comparable quarter on quarter results). This method allocates 13 weeks per quarter of a year, which breaks down into a “5 week month”, followed by two lots of “4 week months”. Monthly results, therefore, are not directly comparable to each other as they are based on differing numbers of weeks. Every 6 years this produces a 53 week statistical year; 2016 is such a year. In order to account for this extra week, December 2016 data have been revised to 5 weeks instead of the usual 4 weeks. To enable direct comparisons, weekly averages have been calculated which divide the monthly figures by the number of statistical weeks in the relevant month. Survey data are subject to a variety of validation checks which identify inconsistencies in the data. All data are cleaned prior to publication in discussion with the survey respondents.
5.2 Revisions policy
Figures in this release are provisional and subject to revision. We will provide information about any revisions we make to previously published information in this statistics release and the associated datasets. Revisions could occur for various reasons, including:
- if we have not received survey data from respondents we make an estimate based on their previous returns. These estimates are replaced with actual survey data when it is received.
- survey respondents occasionally supply amended figures for previous periods.
Northern Ireland slaughter data from September 2023 is estimated. Northern Ireland hatcheries data for November, December, January and February is estimated.
5.3 Data users/uses
Representatives of the poultry industry are also major users of the data. The data on Commercial layer chick sets and placings are the key sector indicators for the British Egg Industry Council (BEIC) as they indicate the future laying flock size (and hence egg production). The British Poultry Council also makes heavy use of the data as the Commercial broiler chick sets and placings give evidence on the current state of the industry and predict the available supplies of meat for the coming year. This, in turn, can affect poultry meat prices and trade decisions on levels of imports and exports to maintain supply. The breeder chick placings are also a key measure of future flock sizes and intentions of the sector. The Agricultural and Horticultural Development Board (AHDB- Cereals and Oilseeds), rely on the chick placings data as a good indicator of feed demand and hence grain usage by the sector.
Our statistics are also often heavily referenced in industry publications such as “Poultry World”.
5.4 Future publications
The next release of this notice is at 09:30 on 18th April 2024.
Full UK and England/Wales time series of poultry and poultry meat are all available on the gov.uk website at “Poultry and poultry meat statistics”
5.5 Other information
The data are subject to a variety of validation checks, which identify inconsistencies in the data. All data are cleaned prior to publication in discussion with the survey respondents.
6. Definitions
- Eggs Set: eggs placed into an incubator.
- Chicks placed: the introduction of a hatched chick into a poultry rearing system.
- Broiler: a bird raised primarily for meat production.
- Layer: a bird raised primarily to lay eggs for human consumption.
- Breeder: a bird raised primarily to provide the next generation of chicks.
- Boiler/Boiling fowl/spent hen: a layer or breeding bird whose primary purpose is spent.
- Poult: a turkey chick
7. Accredited official status
Accredited official statistics are called National Statistics in the Statistics and Registration Service Act 2007. An explanation can be found on the Office for Statistics Regulation website.
Our statistical practice is regulated by the Office for Statistics Regulation (OSR). OSR sets the standards of trustworthiness, quality and value in the Code of Practice for Statistics that all producers of official statistics should adhere to.
These accredited official statistics were independently reviewed by the Office for Statistics Regulation in 2014. They comply with the standards of trustworthiness, quality and value in the Code of Practice for Statistics and should be labelled ‘accredited official statistics’.
You are welcome to contact us directly with any comments about how we meet these standards (see contact details below). Alternatively, you can contact OSR by emailing regulation@statistics.gov.uk or via the OSR website.
Since the latest review by the Office for Statistics Regulation, we have continued to comply with the Code of Practice for Statistics, and have made the following improvements:
• From 2020, after a quality assurance exercise, we changed the data source of our livestock slaughter numbers to Food Standards Agency (FSA) administrative data. The FSA data provides full monthly coverage of slaughterhouse throughput in England and Wales.
• Improved the data quality by updating guidance for data providers and carrying out enhanced validation checks on data received
For general enquiries about National Statistics, contact the National Statistics Public Enquiry Service: Tel: 0845 601 3034 Email: info@statistics.gov.uk.
You can find National Statistics on the internet at www.statistics.gov.uk/
Contact details
Julie Rumsey
Email: julie.rumsey@defra.gov.uk
Public enquiries: +44 (0) 2080 266306