United Kingdom Poultry and Poultry Meat Statistics – February 2021
Updated 17 February 2022

© Crown copyright 2022
This publication is licensed under the terms of the Open Government Licence v3.0 except where otherwise stated. To view this licence, visit nationalarchives.gov.uk/doc/open-government-licence/version/3 or write to the Information Policy Team, The National Archives, Kew, London TW9 4DU, or email: psi@nationalarchives.gov.uk.
Where we have identified any third party copyright information you will need to obtain permission from the copyright holders concerned.
This publication is available at https://www.gov.uk/government/statistics/historical-statistics-notices-on-poultry-and-poultry-meat-production-2021/united-kingdom-poultry-and-poultry-meat-statistics-february-2021
An issue with the response rate of turkey slaughtering numbers has been detected. For August 2020 data onwards we have moved the data source to the FSA throughput data while we investigate the issue with the previous data source.
We have conducted a review of our hatcheries survey register to include additional participants. These additional participants were included from November 2020 and have provided backdated data from January 2020 until survey inclusion. Corresponding month’s figures have been amended to include this backdated data. Due to this process the data before January 2020 will not be directly comparable with data post-January 2020.
This release shows the latest monthly information on poultry statistics, including hatchery output, slaughtering and meat production volumes.
1. Key messages
February 2021 in comparison to February 2020:
- UK commercial layer chick placings were down 25% to 2.8 million chicks - table 3.3
- UK broiler chick placings were unchanged at 93.5 million chicks - table 3.3
- Turkey chick placings were down by 1.4% at 1.0 million chicks - table 3.3
- Turkey slaughterings were down 55% at 0.5 million birds - table 4.1
- UK broiler slaughterings were up 2.0% at 85.3 million birds - table 4.1
- Total UK poultry meat production were down 8.2% at 137.8 thousand tonnes - table 4.4
2. Commentary
The number of eggs set each month indicates how many chicks will be available for placing into poultry systems in future months. Hen eggs take around 21 days to hatch, turkey eggs take around 28 days. The number of placed chicks each month indicates future volumes of poultry meat and egg production. Consumer demand strongly affects broiler chick and turkey poult placings. There are clear peaks (of turkeys) and troughs (of broilers) in the average weekly placings figures in the months running up to Christmas (Figs 2.1 and 2.2). This translates into equivalent high/low levels in the slaughtering volumes over the Christmas period (Figs 3.1 and 3.2).
3. Numbers of eggs set and chicks placed by UK hatcheries
This section contains tables and charts that indicate the number of eggs set and chicks placed by United Kingdom hatcheries in the most recent months.
Please note that the surveys are not calendar months. They are statistical months containing either 4 or 5 weeks. In order to remove the statistical month effect and give a clearer indication of trends, weekly average numbers have been used. The Methodology section provides more explanation of the statistical week system.
Table 3.1: Number of eggs set per month by UK Hatcheries (millions)
| Feb 20 | Dec 20 | Jan 21 | Feb 21 | yr on yr | |
|---|---|---|---|---|---|
| 4 weeks | 4 weeks | 5 weeks | 4 weeks | % change | |
| Commercial broilers (a) | 109.2 | 108.5 | 138.9 | 111.3 | 1.9% |
| Broiler breeders (a) (b) | 5.4 | 3.7 | 5.3 | 4.9 | -8.4% |
| Turkeys (c) | 1.1 | 1.2 | 1.5 | 1.2 | 5.2% |
| Commercial layers (c) | 8.7 | 7.8 | 10.0 | 7.9 | -9% |
(a) Includes eggs set to produce chicks for placing outside the UK
(b) Includes Broiler parents and grandparents
(c) Only includes eggs set for commercial stock, including those for placing outside the UK
Table 3.2: Average number of eggs set per week by UK Hatcheries (millions)
| Feb 20 | Dec 20 | Jan 21 | Feb 21 | month % change | |
|---|---|---|---|---|---|
| Commercial broilers (a) | 27.3 | 27.1 | 27.8 | 27.8 | 0.2% |
| Broiler breeders (a) (b) | 1.3 | 0.9 | 1.1 | 1.2 | 15% |
| Turkeys (c) | 0.3 | 0.3 | 0.3 | 0.3 | 1.4% |
| Commercial layers (c) | 2.2 | 2.0 | 2.0 | 2.0 | -0.6% |
(a) Includes eggs set to produce chicks for placing outside the UK
(b) Includes Broiler parents and grandparents
(c) Only includes eggs set for commercial stock, including those for placing outside the UK
Table 3.3: Chicks and poults placed per month in the UK by UK Hatcheries - millions
| Feb 20 | Dec 20 | Jan 21 | Feb 21 | yr on yr | |
|---|---|---|---|---|---|
| 4 weeks | 4 weeks | 5 weeks | 4 weeks | % change | |
| Commercial broilers (a) | 93.5 | 94.5 | 112.8 | 93.5 | 0.0% |
| Broiler breeders (b) | 0.7 | 0.8 | 0.8 | 0.7 | 3.4% |
| Turkey poults (c) | 1.0 | 0.9 | 1.2 | 1.0 | -1.4% |
| Commercial layers | 3.8 | 3.0 | 3.5 | 2.8 | -25% |
(a) Includes ‘by-product’ chicks
(b) Female parents only. Excludes grandparent chicks and ‘by-product’ chicks. Includes imported female parent chicks
(c) Including female breeder poults
Table 3.4: Average numbers of chicks and poults placed per week in the UK by UK Hatcheries (millions)
| Feb 20 | Dec 20 | Jan 21 | Feb 21 | month % change | |
|---|---|---|---|---|---|
| Commercial broilers (a) | 23.4 | 22.9 | 22.6 | 23.4 | 3.6% |
| Broiler breeders (b) | 0.2 | 0.2 | 0.2 | 0.2 | 8.8% |
| Turkey poults (c) | 0.2 | 0.2 | 0.2 | 0.2 | -2.4% |
| Commercial layers | 0.9 | 0.7 | 0.7 | 0.7 | -0.5% |
(a) Includes ‘by-product’ chicks
(b) Female parents only. Excludes grandparent chicks and ‘by-product’ chicks. Includes imported female parent chicks
(c) Including female breeder poults
Figure 3.1: Average number of broiler chicks placed per week by UK Hatcheries
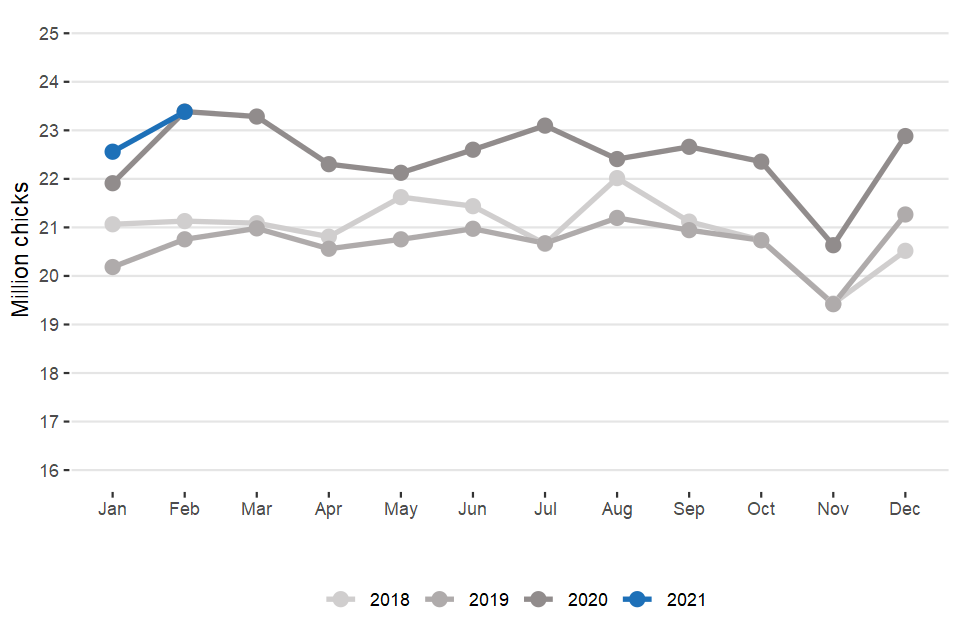
Average number of broiler chicks placed per week by UK hatcheries
Figure 3.2: Average number of turkey poults placed per week by UK Hatcheries
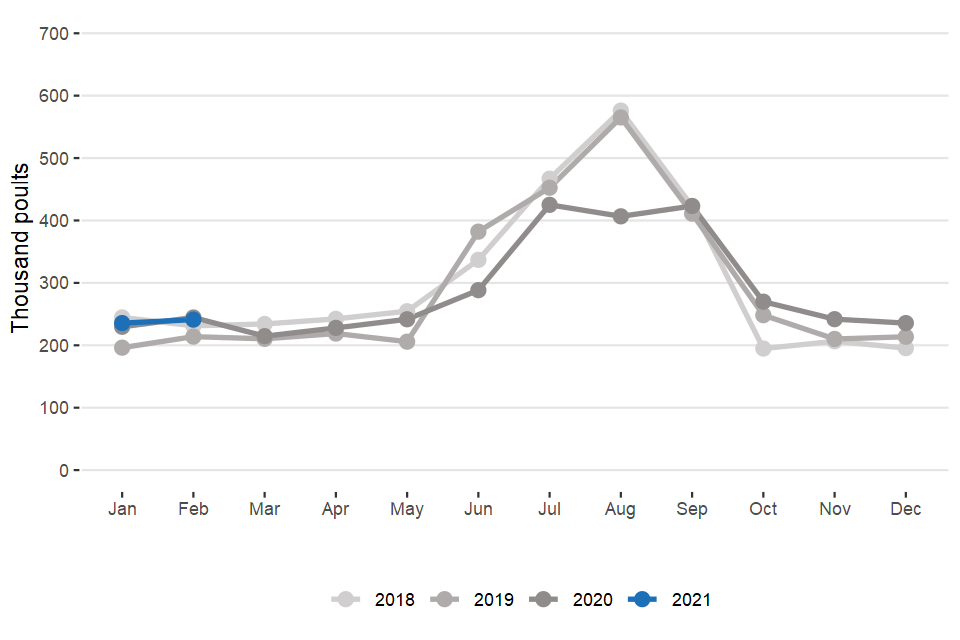
Average number of turkey poults placed per week by UK hatcheries
Figure 3.3: Average number of layer chicks placed per week by UK Hatcheries
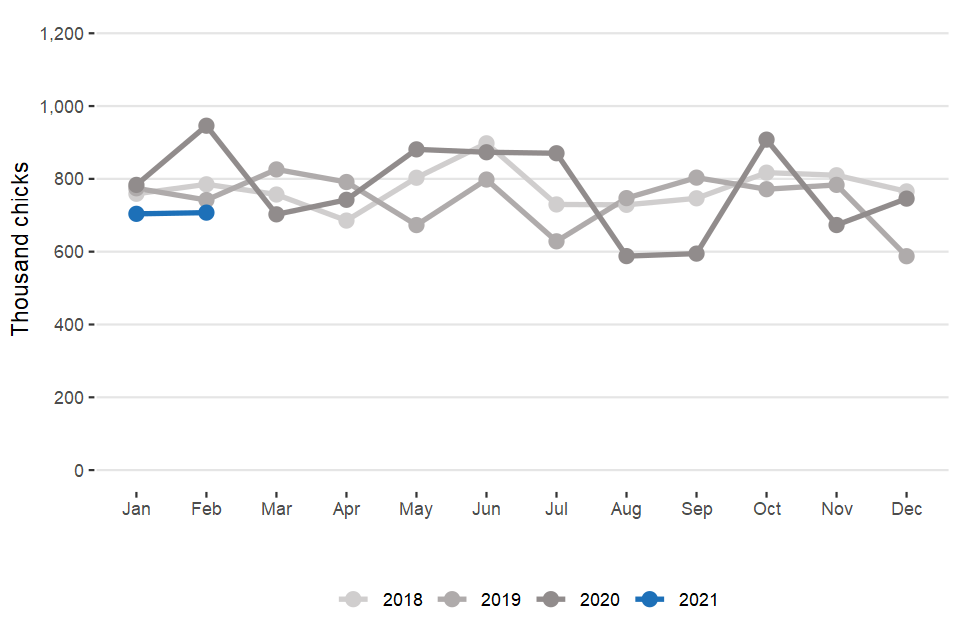
Average number of layer chicks placed per week by UK hatcheries
4. Poultry meat production
This section shows the number of poultry slaughtered and the average liveweights of poultry; together these indicate the volume of poultry meat production in the UK.
As in earlier tables, weekly averages are included to remove the statistical month effect.
Table 4.1: Number of poultry slaughtered per month in the UK (million birds)
| Feb 20 | Dec 20 | Jan 21 | Feb 21 | yr on yr | |
|---|---|---|---|---|---|
| 4 weeks | 4 weeks | 5 weeks | 4 weeks | % change | |
| Broilers | 83.7 | 78.1 | 103.0 | 85.3 | 2.0% |
| Boiling fowl (a) | 4.3 | 4.2 | 4.3 | 4.3 | -0.9% |
| Turkeys | 1.1 | 2.8 | 0.8 | 0.5 | -55% |
(a) Includes spent hens and spent breeders
Table 4.2: Number of poultry slaughtered per week in the UK (million birds)
| Feb 20 | Dec 20 | Jan 21 | Feb 21 | month % chg | |
|---|---|---|---|---|---|
| Broilers | 20.9 | 19.5 | 20.6 | 21.3 | 3.5% |
| Boiling fowl (a) | 1.1 | 1.1 | 0.9 | 1.1 | 22% |
| Turkeys | 0.3 | 0.7 | 0.2 | 0.1 | -22% |
(a) Includes spent hens and spent breeders
Table 4.3: Average liveweights per bird at point of slaughter in England & Wales (kilograms)
| Feb 20 | Dec 20 | Jan 21 | Feb 21 | yr on yr % change | |
|---|---|---|---|---|---|
| Broilers | 2.2 | 2.2 | 2.1 | 2.1 | -5.0% |
| Boiling fowl | 2.2 | 2.1 | 2.2 | 2.1 | -7.9% |
| Turkeys | 13.8 | 8.8 | 10.6 | 10.2 | -27% |
Table 4.4: Volume of poultry meat produced per month in the UK (thousand tonnes carcase weight)(a)
| Feb 20 | Dec 20 | Jan 21 | Feb 21 | yr on yr % change | |
|---|---|---|---|---|---|
| 4 weeks | 4 weeks | 5 weeks | 4 weeks | % change | |
| Broilers | 128.9 | 123.0 | 151.2 | 126.3 | -2.1% |
| Boiling fowl | 6.2 | 5.8 | 6.1 | 5.7 | -7.8% |
| Turkeys | 12.9 | 21.6 | 7.1 | 4.3 | -67% |
| Ducks | 2.0 | 1.6 | 1.6 | 1.6 | -22% |
| Total (b) | 150.1 | 151.9 | 166.0 | 137.8 | -8.2% |
(a) Converted to whole bird equivalent carcase weight, net of offal
(b) Excludes other poultry types, e.g. geese
Figure 4.1: Average number of broilers slaughtered per week in the UK
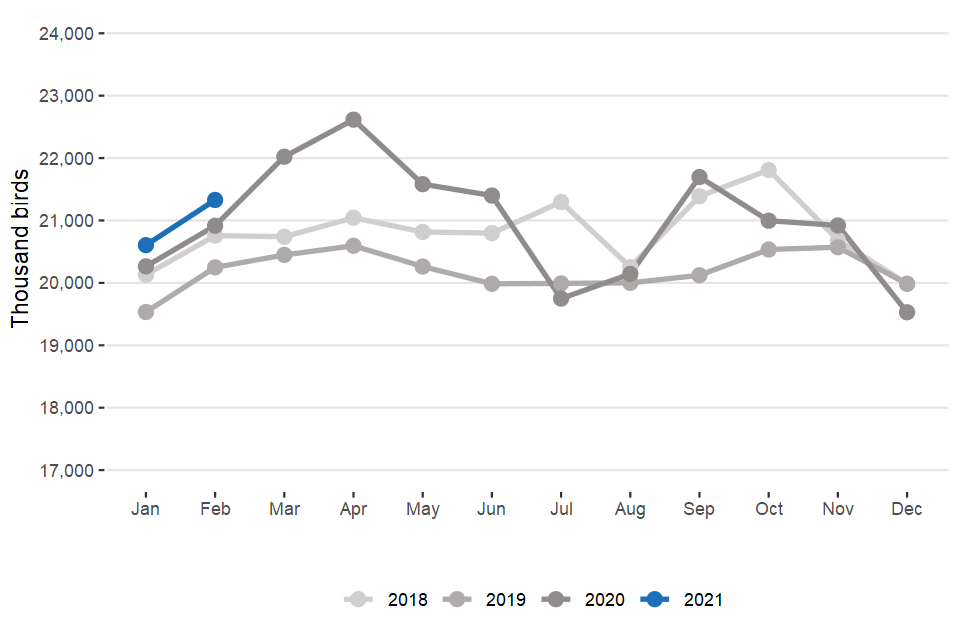
Average number of broilers slaughtered per week in the UK