Usage of milk by dairies in the United Kingdom statistics: May 2021 (published 1 July 2021)
Updated 3 March 2022

© Crown copyright 2022
This publication is licensed under the terms of the Open Government Licence v3.0 except where otherwise stated. To view this licence, visit nationalarchives.gov.uk/doc/open-government-licence/version/3 or write to the Information Policy Team, The National Archives, Kew, London TW9 4DU, or email: psi@nationalarchives.gov.uk.
Where we have identified any third party copyright information you will need to obtain permission from the copyright holders concerned.
This publication is available at https://www.gov.uk/government/statistics/historical-national-statistics-notices-on-milk-utilisation-by-dairies-2021/usage-of-milk-by-dairies-in-the-united-kingdom-statistics-may-2021-published-1-july-2021
This release shows the latest monthly information on the volume of milk used by dairies in the United Kingdom for the production of a range of milk products.
1. Key messages
-
In May, UK dairies processed 1,342 million litres of milk. The 12 month rolling average up to May saw a 0.1% increase on the milk processed compared to the 12 months to April - Figures 2.1 and Table 2.1.
-
Production of liquid milk, which usually remains relatively constant around 500-550 million litres per month, rose 4.7% to 531 million litres in May. The 12 month rolling average up to May saw a 0.1% increase in liquid milk and a 1.5% increase in butter compared to the 12 months to April - Figures 2.1 and Table 2.1.
-
Cheese production continues to be the largest manufactured product Figure 2.2 with cheddar the most popular cheese by far Figure 2.3.
2. Monthly milk utilisation
Figure 2.1 Monthly milk use: liquid milk and other products (million litres)

Monthly milk use: liquid milk and other products (million litres)
Figure 2.2 Milk use by product, excluding liquid milk (million litres)
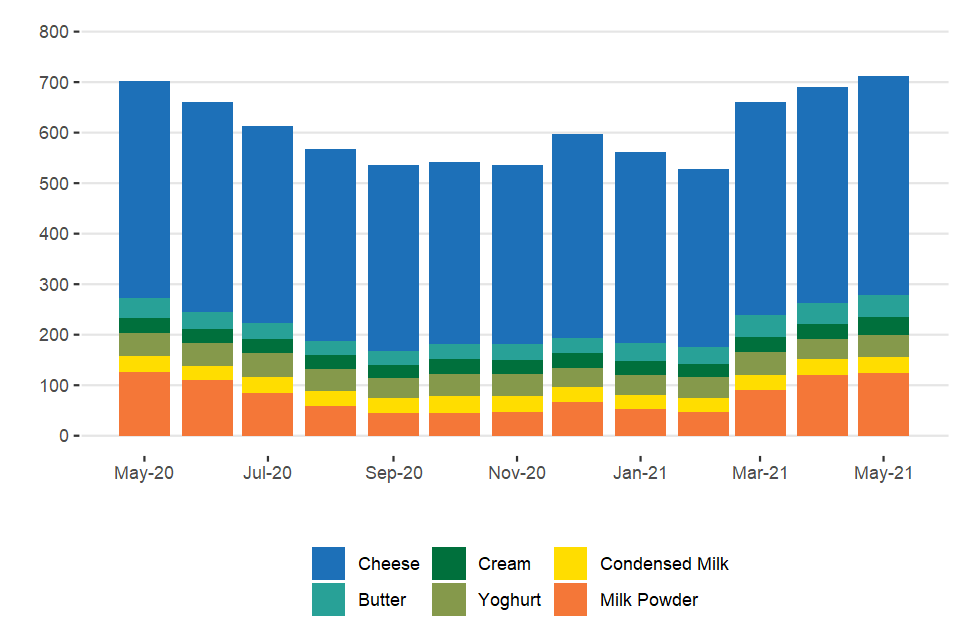
Milk use by product, excluding liquid milk (million litres)
Figure 2.3 monthly utilisation of milk by cheese type (million litres)
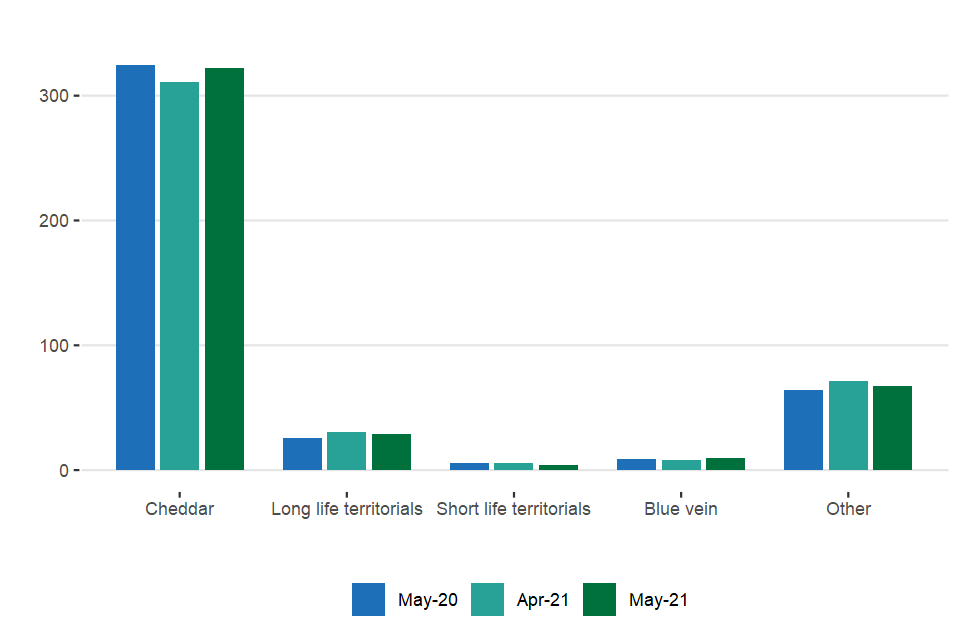
Monthly utilisation of milk by cheese type (million litres)
Table 2.1 Utilisation of milk at UK processors
| Monthly total | Monthly total | Percentage change | 12 month rolling average to | 12 month rolling average to | Percentage change | |
|---|---|---|---|---|---|---|
| Apr 21 | May 21 | Apr 21 | May 21 | |||
| Milk available to processors (million litres) | 1,293 | 1,342 | 3.8% | 1,188 | 1,189 | 0.1% |
| Liquid milk production (million litres) | 507 | 531 | 4.7% | 508 | 508 | 0.1% |
| Cheese production (‘000 tonnes) | 45.4 | 45.9 | 1.2% | 41.5 | 41.5 | 0.0% |
| Butter production (‘000 tonnes) | 20.9 | 21.7 | 4.1% | 16.6 | 16.9 | 1.5% |
| Milk powder production (‘000 tonnes) | 12.5 | 13.0 | 3.7% | 7.5 | 7.5 | -0.1% |
3. About these statistics
3.1 Methodology
E&W statistics presented in this dataset are from the monthly survey of milk availability and usage by dairies in England and Wales. It is a voluntary sample survey with the largest 34 dairies sampled monthly and an additional 20 dairies surveyed quarterly (the quarterly data is apportioned into monthly data for the relevant 3 month period).
These 54 dairies cover approximately 90% of the total milk available for processing (based on the long term comparison with RPA volume data) so the survey data is raised to 100% of milk delivered to dairies in England and Wales.
UK results are derived as a sum of the survey results from England and Wales, Scotland and Northern Ireland. Similar surveys are run by the Scottish Government and the Department of Agriculture, Environment and Rural Affairs (DAERA) for Northern Ireland. Northern Ireland results are available at the Daera milk-ultilisation statistics webpage. Data for Scotland are not available separately due to confidentiality reasons. Scottish Government publications are available at the Scottish government’s publication webpage
The wholesale production figures (e.g. for butter and cheese) are estimated from the volume of milk used for each production and compared to conversion factors advised by the dairy industry. Conversion factors can be variable and fluctuate on a monthly basis so average conversion factors have been used for calculating production volumes.
3.2 Revisions policy
Data for Northern Ireland from January 2020 is estimated.
Figures in this release are provisional and subject to revision. We will provide information about any revisions we make to previously published information in this statistics release, and the associated datasets. Revisions could occur for various reasons, including:
-
If we have not received survey data from respondents we make an estimate based on their previous returns. These estimates are replaced with actual figures when they are received.
-
Survey respondents occasionally supply amended figures for previous periods.
-
Estimates have been used for some companies while awaiting clarification on data.
3.3 Data users/uses
The milk utilisation statistics accompany another Defra monthly publication on farm gate milk prices, this is available at the UK milk prices and composition publication webpage which shows the prices paid to milk producers by dairies. This data, alongside the milk utilisation data, gives a comprehensive overview of the UK milk market and is used heavily by the dairy industry, in particular the division of the Agriculture and Horticulture Development Board (AHDB) known as DairyCo (who represent milk producers) and Dairy UK (who represent milk processors). DairyCo consider the price and utilisation statistics vital for assessing market trends and to carry out further analysis on how changing prices affect the sector. Milk utilisation data provides insight into market characteristics and to monitor where milk is being used for domestic production. It provides insight to how production of products (such as butter, cheese etc.) changes in response to changes in global demand and market conditions.
Milk utilisation statistics are also used heavily by the British Cheese Board to monitor volumes of national cheese production over time.
The information in this release is also used by the UK government as evidence for assessing market conditions and evaluating agricultural policy. Other users include academia and the general public.
3.4 Future publications
The next monthly release will be published at 09:30 on 5th August 2021.
Full UK and England/Wales time series of milk utilisation, production of milk products (butter, cheese etc.) and import/export volumes of milk products are all available on the gov.uk website at “Milk utilisation by dairies”
3.5 Other info
The data are subject to a variety of validation checks, which identify inconsistencies in the data. All data are cleaned prior to publication in discussion with the survey respondents.
4 Conversion factors
Table 4.1: Conversion factors: litres of milk to produce 1 kg of product
| Product | Conversion factor (litres/kg) |
|---|---|
| Butter (from Cream) | 2.04 |
| Cheddar | 9.5 |
| Other Long Life Territorials | 9.2 |
| Short life Territorials | 8.1 |
| Blue vein | 9.1 |
| Mozarella | 9.8 |
| Cottage cheese /Fromage frais | 3.6 |
| Soft cheese | 8 |
| Non-specified cheese | 9.7 |
| Condensed Milk | 2.7 |
| Milk Powder (from Whole milk) | 8.5 |
| Milk Powder (from Skim milk) | 10.1 |
| Milk Powder (from Cream) | 12.3 |
| Cream (from cream) | 1 |
| Yoghurt | 1.1 |
5. National Statistics Status
National Statistics are produced to high professional standards. They undergo regular quality assurance reviews to ensure that they meet customer needs. They are produced free from any political interference.
The continued designation of these statistics as National Statistics was confirmed in 2014 following a compliance check by the UK Statistics Authority (now the Office for Statistics Regulation) against the Code of Practice for Statistics.
Since the last review of these statistics in 2014, we have continued to comply with the Code of Practice for Statistics, and have made improvements including: - Providing a detailed breakdown of livestock categories following user feedback - Improved the data quality by updating guidance for data providers and carrying out enhanced validation checks on data received
For general enquiries about National Statistics, contact the National Statistics Public Enquiry Service:
Tel: 0845 601 3034 Email: info@statistics.gov.uk
You can find National Statistics on the internet at www.statistics.gov.uk
6. What you need to know about this release
Contact details
Livestock statistics team
Email: DEFRA.FISU@defra.gov.uk
Public enquiries: +44 (0) 2080 266306
Defra, Rm 201,
Foss House,
Kings Pool,
1-2 Peasholme Green,
York,
YO1 7PX