Her Majesty’s Prison and Probation Service workforce quarterly: March 2022
Published 19 May 2022
Applies to England and Wales

© Crown copyright 2022
This publication is licensed under the terms of the Open Government Licence v3.0 except where otherwise stated. To view this licence, visit nationalarchives.gov.uk/doc/open-government-licence/version/3 or write to the Information Policy Team, The National Archives, Kew, London TW9 4DU, or email: psi@nationalarchives.gov.uk.
Where we have identified any third party copyright information you will need to obtain permission from the copyright holders concerned.
This publication is available at https://www.gov.uk/government/statistics/hm-prison-and-probation-service-workforce-quarterly-march-2022/her-majestys-prison-and-probation-service-workforce-quarterly-march-2022
Main Points
| 58,437 FTE (full time equivalent) staff in post | This is an increase of 7,172 FTE (14.0%) staff in post since 31 March 2021 and a minimal change of 255 FTE (0.4%) since 31 December 2021. This includes over 7,000 staff transferred from the Private Sector Community Rehabilitation Companies (CRCs) in June 2021. Of the staff in post, there were 34,180 FTE in Public Sector Prisons (PSP), 16,711 FTE staff in the Probation Service, 5,975 FTE staff in HQ and Area Services, and 1,572 FTE in the Youth Custody Service (YCS). |
| 22,002 FTE band 3-5 prison officers in post | This is no substantial change since 31 March 2021 and a slight decrease of 154 FTE (0.7%) prison officers compared to 31 December 2021. |
| 5,083 FTE band 2 operational support staff in post | This is an increase of 113 FTE (2.3%) since 31 March 2021 and a slight increase of 81 FTE (1.6%) operational support staff since 31 December 2021. |
| 4,338 FTE band 4 probation officers in post | This is an increase of 799 FTE (22.6%) since 31 March 2021 and a decrease of 152 FTE (3.4%) compared to 31 December 2021. In addition to the band 4 probation officers, there were 6,103 FTE band 3 probation services officers: an increase of 2,968 FTE (94.6%) since 31 March 2021 and an increase of 364 FTE (6.4%) since 31 December 2021. This has mainly been caused by the transfer of CRC staff in June 2021. |
| Leaving rate of 14.5% amongst band 3-5 prison officers | This is an increase of 5.4 percentage points compared to the year ending 31 March 2021. The overall leaving rate across HMPPS over the past 12 months stood at 12.6%, which is an increase of 4.2 percentage points compared to the year ending 31 March 2021. |
This publication provides details of staffing levels, staff inflows and outflows, sickness absence rates, and protected characteristics for the directly employed workforce of HMPPS. Information presented covers PSP, the Probation Service, the YCS, and HMPPS headquarters, which includes Area Services that provide direct operational support to prisons. Technical details and explanatory notes can be found in the accompanying Guide to HM Prison and Probation (HMPPS) Workforce Statistics.
Statistician’s comment
In this publication we are reporting on the HMPPS workforce as at 31 March 2022.
As at March 2022 there were 58,437 FTE staff in post. The size of the workforce has increased by 14.0% compared to March last year, this was mainly due to the transfer of over 7,000 staff from the Private Sector Community Rehabilitation Companies (CRCs) in June 2021.
Leaving rates fell during the COVID-19 pandemic, possibly due to increased uncertainty in the employment market. Leaving rates have now increased and are continuing the upward trend seen from March 2016 to March 2020.
HMPPS staff sickness accounted for 13.8 working days lost for 12 months to March 2022. This is the highest in the time series and is 2.4 working days higher than last year, and 3.5 working days higher than the predominantly COVID-19 free year ending 31 March 2020. For 12 months to March 2022 the main reason for sickness was mental and behavioural disorders (30.2% of absences) followed by epidemic/pandemic (22.0%) of absences.
The latest equality and diversity statistics show HMPPS has increased its diversity across a number of protected characteristics during the past year. For those staff who declared, as at March 2022: females represented 53.6% of HMPPS staff (3.6 percentage points higher than last year), Ethnic Minority staff represented 12.0% of staff (1.1 percentage points higher than last year), disabled staff represented 15.4% of staff (1.2 percentage points higher than last year), LGB staff represented 6.9% of staff (0.4 percentage points higher than last year) and non-Christian religion represented 8.4% of staff (0.3 percentage points higher than last year).
Points to note
Her Majesty’s Prison and Probation Service
HMPPS is focused on supporting operational delivery and the effective running of prison and probation services across the public and private sectors. HMPPS works with a number of partners to carry out the sentences given by the courts, either in custody or the community. This publication covers the reporting period up to 31 March 2022 and therefore considers in detail quarterly staffing levels and staff inflows and outflows, for HMPPS and its predecessors, since 2016.
For ease, the statistics in this publication will be referred to as those of the HMPPS workforce (i.e. staff working in HMPPS and with a contract of employment with HMPPS, excluding those on career breaks and those on secondment or loan outside of HMPPS but including staff on secondment or loan into HMPPS).
Staff employed by private sector establishments, community rehabilitation companies and other contractors are excluded.
Coronavirus (COVID-19)
Figures relating to effect of the coronavirus (COVID-19) on HMPPS staff are published alongside this edition of the bulletin as a separate annex. They are experimental statistics and include information about COVID-19 related testing, sickness and deaths of HMPPS staff.
Annex on Prison Officer recruitment diversity
As noted in previous bulletins, the annex with experimental statistics on Prison Officer and Operational Support Grade (OSG) recruitment has been moved to a six-monthly production cycle.
Annex on Probation Officer Vacancies and Trainees
As of the June 2019 publication, this annex has been added to this bulletin which presents figures on Probation Officers in post, and their required staffing level, in addition it shows the number of trainee and qualified Probation Officers.
Recent Organisational Changes
-
In late June 2021, more than 7,000 staff from private sector Community Rehabilitation Companies (CRC) came together with probation staff already in the public sector in the new Probation Service.
-
From April 2021 the Probation Service has been undergoing a reorganisation, with staff moving into new Probation Delivery Units (PDUs). As staff movement is ongoing we have only published staffing data at the regional level in Table 16 of the accompanying tables.
-
Medway Secure Training Centre closed on 31 March 2020.
Future Plans
For future publications we are considering ways in which we can improve the bulletin, and some of the issues we may look into are as follows:
-
How to make the tables and presentation of the figures more user-friendly.
-
Whether to and how to expand the range of information provided.
If you have any particular comments or views on the above, or any other aspects you would like to be considered about this bulletin, please contact us at the address given at the end of the publication.
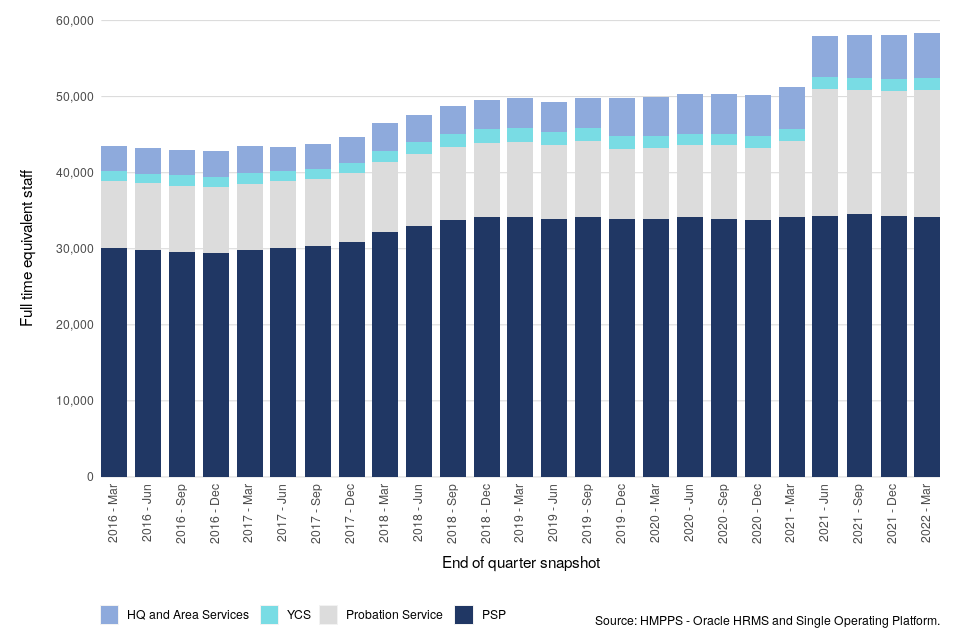
1. Total HMPPS staff in post
58,437 FTE staff in post (as at 31 March 2022)
This is an increase of 7,172 FTE (14.0%) staff in post since 31 March 2021 and a minimal change of 255 FTE (0.4%) since 31 December 2021 driven mainly by the transfer of CRC personnel into HMPPS. Of the staff in post, there were 34,180 FTE in Public Sector Prisons (PSP), 16,711 FTE staff in the Probation Service, 5,975 FTE staff in HQ and Area Services, and 1,572 FTE in the YCS.
As at 31 March 2022, there were 58,437 FTE staff in post in HMPPS on a full time equivalent (FTE) basis (Figure 1). This includes 34,180 FTE staff in PSP (making up 58.5% of all HMPPS staff), 16,711 FTE in the Probation Service (28.6% of all HMPPS staff), 5,975 FTE in HMPPS HQ and Area Services (10.2% of all HMPPS staff), and 1,572 FTE in the YCS (2.7% of all HMPPS staff).
Compared to 31 March 2021, the overall staff numbers increased by 7,172 FTE (14.0%): FTE in PSP remained effectively the same, FTE in the Probation Service increased by 6,691 (66.8%), FTE in HQ and Area Services increased by 419 (7.5%), and FTE in the YCS increased by 42 (2.7%). These changes are affected by the organisational changes described above, such as move of over 7,000 staff from Private Sector CRCs into the Probation Service in June 2021.
As at 31 March 2022, there were 28,094 FTE (48.1% of HMPPS staff) operational prison service staff (including YCS staff). This is a slight increase of 213 FTE staff (0.8%) compared to 31 March 2021. Non-operational roles across PSP, YCS, and HMPPS HQ accounted for 12,439 FTE staff (21.3% of HMPPS staff), which is an increase of 300 FTE (2.5%) since 31 March 2021. There were 17,905 FTE staff[footnote 1] in the Probation Service (30.6% of all HMPPS staff): an increase of 6,659 (59.2%) FTE since 31 March 2021.
The big increase in Probation Service staff was mainly due to more than 7,000 staff from private sector CRCs coming together with probation staff already in the public sector in the new Probation Service at the end of June 2021. Processing of these staff into the HMPPS organisation is still ongoing. Records are still being updated following this change, resulting in some entries being classified as ‘unknown’ in the accompanying tables. In addition, many staff had not been able to update their voluntary declarations on diversity information by the 30 June, which has led to a drop in recorded declaration rates for many of the indicators, as can be seen in Table 5d, of the accompanying tables.
Figure 1: Number of HMPPS staff in post on an FTE basis, 31 March 2016 to 31 March 2022 (Source: Table 1)
1.1 Length of Service
Length of service information has been calculated for HMPPS staff from the most recent hire date. Where staff have transferred in from another government department or have transferred in through HMPPS taking over a function, length of service is calculated from entry to HMPPS.
Across HMPPS overall, 27.2% of FTE staff in post had less than 3 years’ service, which was a slight decrease from 28.7% at 31 March 2021 and no substantial change from 27.1% at 31 December 2021. 33.8% of HMPPS FTE staff in post had 10 years or more of experience, representing a decrease from 35.9% at 31 March 2021 and a slight decrease from 34.5% at 31 December 2021.
It should be noted, that the National Probation Service was created on 1 June 2014 and the service of Probation Service staff in Probation Trusts prior to the creation of the Probation Service is not included. Therefore, the figures relating to the length of service of Probation Service staff, which are included in the HMPPS overall figures, do not necessarily represent their full experience but rather the length of service from entry to HMPPS. The situation is different for the over 7000 staff who transferred from the CRCs in June 2021 and for them their service prior to their date of transfer is included.
Excluding the Probation Service, 26.8% of FTE staff in post across HMPPS had less than 3 years’ service as at 31 March 2022. This is a decrease of 2.2 percentage points compared to 31 March 2021. The non-Probation Service staff with 10 years’ experience or more made up 40.5% of the workforce, which is a 3.6 percentage points decrease compared to 31 March 2021.
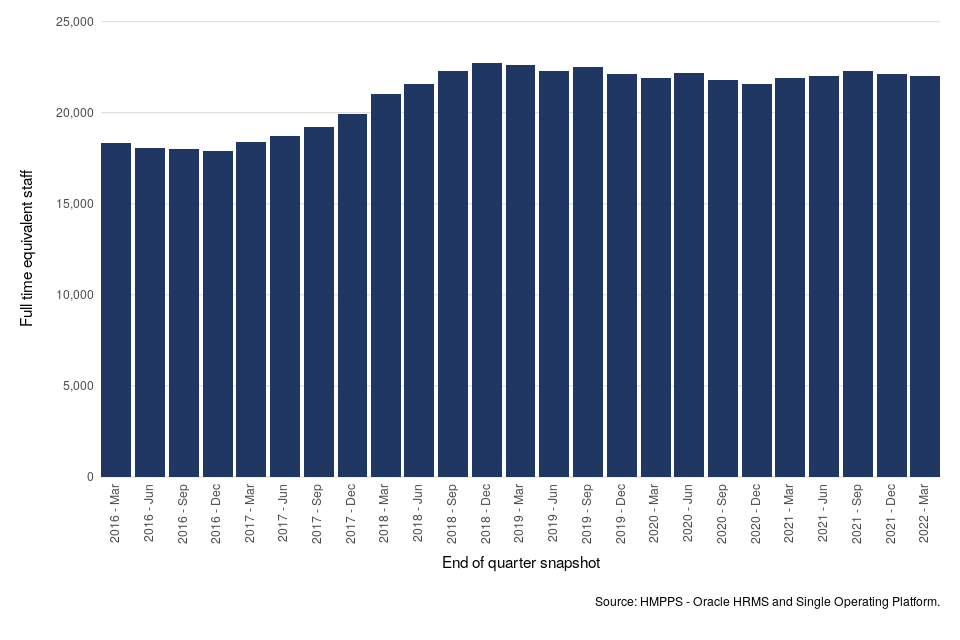
2. Band 3-5 prison officers and band 2 operational support staff
22,002 FTE band 3-5 prison officers in post (as at 31 March 2022)
This is no substantial change in FTE since 31 March 2021 and a slight decrease of 154 FTE (0.7%) prison officers compared to 31 December 2021.
5,083 FTE band 2 operational support staff in post (as at 31 March 2022)
This corresponds to an increase of 113 FTE (2.3%) since 31 March 2021 and a slight increase of 81 FTE (1.6%) operational support staff since 31 December 2021.
The key operational grades in public sector prisons are the band 3 to 5 prison officers. They consist of band 3 prison officers, band 4 officer specialists, band 4 supervising officers, and band 5 custodial managers.
Figure 2: Number of band 3-5 prison officers in post on an FTE basis, 31 March 2016 to 31 March 2022 (Source: Table 3)
The proportion of band 3-5 prison officers with less than 3 years’ service at 31 March 2022 fell to 29.2% compared to 32.3% as at 31 March 2021. The proportion of band 3-5 prison officers with between 3 to 9 years of service increased by 7.2 percentage points from 27.0% at March 2021 to 34.2% at 31 March 2022.
The proportion of officers in post with 10 years or more of experience decreased by 4.1 percentage points from 40.7% at 31 March 2021 to 36.6% at 31 March 2022. This corresponds to 8,056 FTE staff with 10 years or more of experience at 31 March 2022, which is a fall of 873 FTE, or 9.8% since 31 March 2021.
The proportion of band 2 OSG FTE staff with less than 3 years’ service increased from 38.2% at 31 March 2021 to 41.5% at 31 March 2022, and the proportion of those with 10 years or more of experience decreased from 40.4% at 31 March 2021 to 34.8% at 31 March 2022.
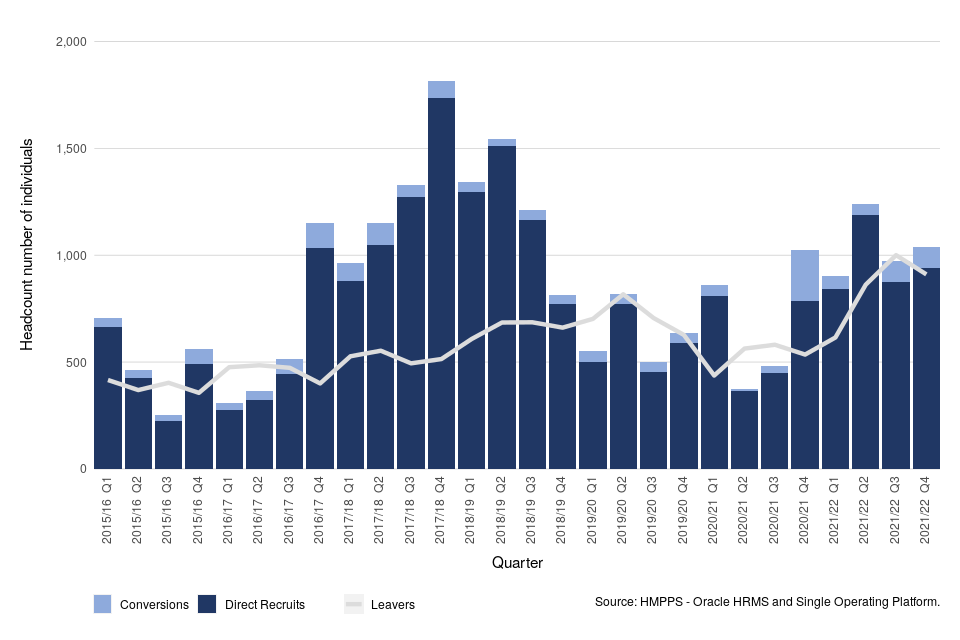
Figure 3 shows a quarterly trend of band 3 to 5 appointments and leavers since 2015/16. Over the year to 31 March 2022, 4,153 band 3 to 5 officers were appointed (consisting of direct new recruits and existing staff who converted to a band 3 officer grade), an increase of 1,415 (51.7%) compared to 2,738 in the previous year. Looking at the quarterly figures, the headcount of new band 3 to 5 officer appointments increased by 67 (6.9%) from 972 between October and December 2021 to 1,039 between January and March 2022 (Table 17).
The headcount of band 3 to 5 prison officers who left HMPPS in the year ending 31 March 2022 was 3,387, which is an increase of 1,271 (60.1%) compared to the year ending 31 March 2021. Examining reasons for leaving, 73.9% of prison officers who left in the year ending 31 March 2022 resigned from their roles (up from 58.5% in the year ending 31 March 2021). Of the other prison officers who left HMPPS, 10.6% were dismissed and 7.3% retired in the year ending 31 March 2022: the numbers dismissed are down from 16.4% compared to previous year while the number retiring are up from 10.1%.
Figure 3: Newly appointed band 3 to 5 prison officers and band 3 to 5 prison officer leavers, April 2015 to 31 March 2022 (Source: Table 17)
The number of band 2 OSG staff who joined HMPPS in the year ending 31 March 2022 was 1,438: an increase of 303 (26.7%) compared to the previous year ending 31 March 2021. There was a slight increase of 10 (0.7%) since the year ending 31 December 2021. The headcount number of band 2 OSG staff who left HMPPS was 982, which is an increase of 370 (60.5%) compared to the year ending 31 March 2021 and an increase of 99 (11.2%) compared to the year ending 31 December 2021.
Joiners and leavers are not the only movements into and out of the band 3 to 5 officer grouping. There are also typically differences in the proportion of new joiners and older officers who work part time as well as movements between grades. For these reasons, the change in FTE does not directly reflect the difference between the number of joiners and leavers. Changes such as staff switching from full time to part time have the effect of reducing the FTE of officers available as they progress through their career.
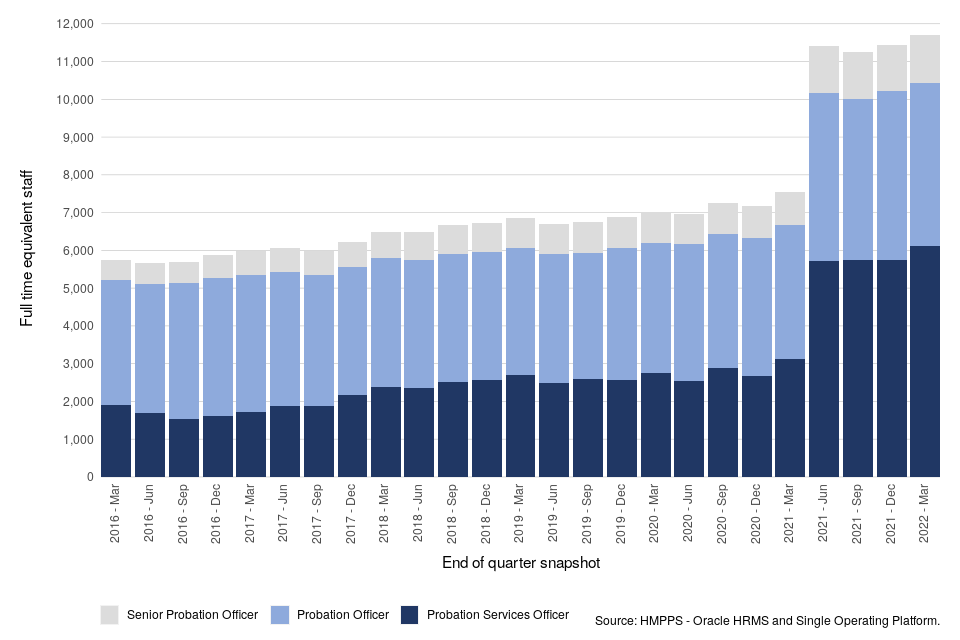
3. Probation practitioners and senior probation officers
4,338 FTE band 4 probation officers in post (as at 31 March 2022)
This figure is an increase of 799 FTE (22.6%) since 31 March 2021 and a decrease of 152 FTE (3.4%) probation officers compared to 31 December 2021. In addition to the band 4 probation officers, there were 6,103 FTE band 3 probation services officers: an increase of 2,968 FTE (94.6%) since 31 March 2021 and an increase of 364 FTE (6.4%) since 31 December 2021 which would have been driven by the transfer of ex-CRC staff into the public sector in June 2021.
Key grades in the Probation Service include band 3 probation services officers, band 4 probation officers (collectively known as probation practitioners), as well as band 5 senior probation officers. Staff who are training to be a probation officer work as a probation services officer during their training, so a proportion of the probation services officers in post will be working towards the professional probation officer qualification.
As of the June 2019 publication, an experimental statistics annex has been added to this bulletin which presents figures on Probation Officers in post, their required staffing level, in addition to the number of trainee and qualified Probation Officers.
In late June 2021, more than 7,000 staff from private sector CRCs came together with probation staff already in the public sector in the new Probation Service. These staff are being treated as transfers in and will not be counted as new joiners. Processing of these staff into the HMPPS organisation is still ongoing with some yet to be allocated grades or to a PDU.
As at 31 March 2022 there were 6,103 FTE band 3 probation services officers in post, an increase of 2,968 FTE (94.6%) over the past year and an increase of 364 FTE (6.4%) over the quarter; 4,338 FTE band 4 probation officers, representing an increase of 799 FTE (22.6%) over the past year and a decrease of 152 FTE (3.4%) compared to the previous quarter; and 1,249 FTE band 5 senior probation officers, showing an increase of 375 (42.9%) over the previous year and an increase of 30 (2.5%) since the last quarter (Figure 4). These increases have been driven by the introduction of ex-CRC staff back into the public sector in June 2021.
Figure 4: Number of probation officers, probation services officers and senior probation officers in post on an FTE basis, 31 March 2016 to 31 March 2022 (Source: Table 3)
In the past year, 1,242 probation services officers were appointed, some of whom will be training to become qualified probation officers. This is an increase of 413 (49.8%) compared to the year ending 31 March 2021 and an increase of 66 (5.6%) compared to the number appointed in the year ending 31 December 2021. The PQiP recruitment drive in 2021 aimed to recruit 1,500 probation officers in total for 2021/22, and in the 12 months to March 2022, 1,518 trainees started training, consisting of both external and internal candidates. Please note, over the year April 2021 to March 2022,the Probation Services Officer total for joiners will not match the number of PQiP starts which relates specifically to people starting the PQiP training course. Those starting the PQiP course include both internal and external candidates, so do not align with the new to HMPPS joiners figure. The official number of PQiP starts can be found in the Probation Officer Recruitment annex. In the past year, 722 probation services officers left the service. This is an increase of 514 (247.1%) compared to the year ending 31 March 2021 and an increase of 152 (26.7%) compared to the number who left in the year ending 31 December 2021.
4. Joiners and Leavers
Leaving rate of 14.5% amongst band 3-5 prison officers (for the 12 months ending 31 March 2022)
This is an increase of 5.4 percentage points compared to the year ending 31 March 2021. The overall leaving rate across HMPPS over the past year stood at 12.6%, which is an increase of 4.2 percentage points compared to the year ending 31 March 2021.
Over the past year, 8,158 staff joined HMPPS, which is an increase of 2,355 (40.6%) compared to the year ending 31 March 2021. These joiners consisted of 5,723 across PSP, 290 in the YCS, 1,679 in the Probation Service, and 466 in HMPPS HQ and Area Services. Compared to the year ending 31 March 2021 these numbers of joiners represent an increase of 45.0% for PSP, an increase of 81.2% for YCS, an increase of 39.6% for Probation Service, and a decrease of 5.7% for HMPPS HQ and Area Services.
There were 7,764 leavers in the year ending 31 March 2022, an increase of 3,234 (71.4%) compared to the year ending 31 March 2021. This includes 5,309 leavers from PSP (an increase of 55.8%), 200 from YCS (an increase of 62.6%), 1,783 from the Probation Service (an increase of 174.7%), and 472 from HMPPS HQ and Area Services (an increase of 34.9%).
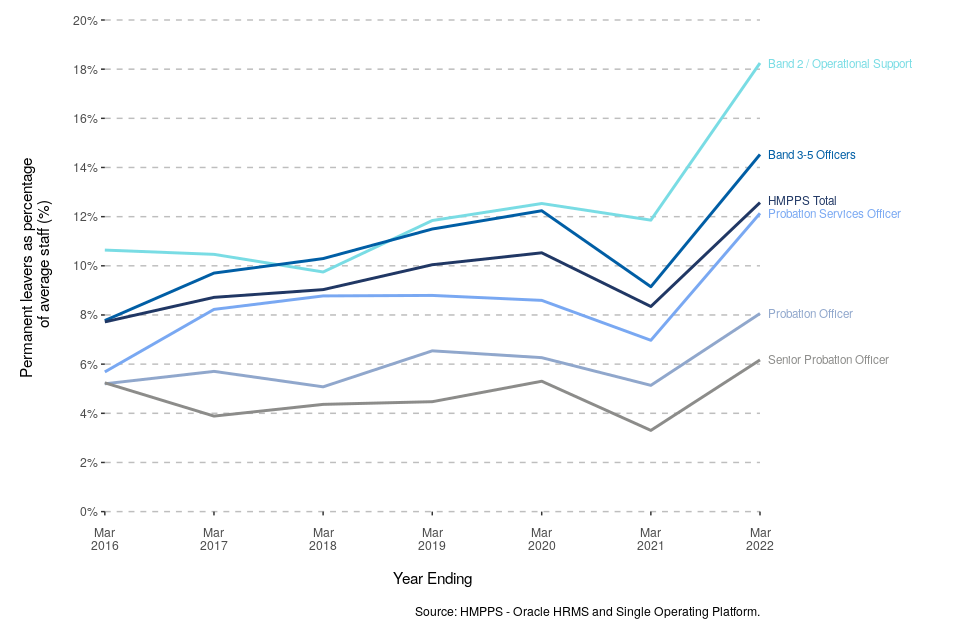
4.1 Leaving Rates[footnote 2]
The overall HMPPS leaving rate for the year to 31 March 2022 was 12.6%, compared to 8.3% for the year to 31 March 2021 (Figure 5). For the year up to 31 March 2021 the increased uncertainty in the employment market following the COVID-19 pandemic may have contributed to the drop in the number of resignations during most of the year, therefore impacting on the overall reduced leaving and resignation rates. The latest leaving rates are now higher than pre-pandemic levels and are continuing the upward trend seen from March 2016 to March 2020. For band 3 to 5 prison officers, the leaving rate of 14.5% in the year ending 31 March 2022 represented an increase of 5.4 percentage points since the year ending 31 March 2021. The leaving rate for band 2 OSG staff was 18.3% in the year ending 31 March 2022, which is an increase of 6.4 percentage points compared to the year ending 31 March 2021.
Figure 5: Annual leaving rates of permanent staff in key operational grades (excluding VEDSR), from the 12 months to 31 March 2016 to the 12 months to 31 March 2022 (Source: Table 11)
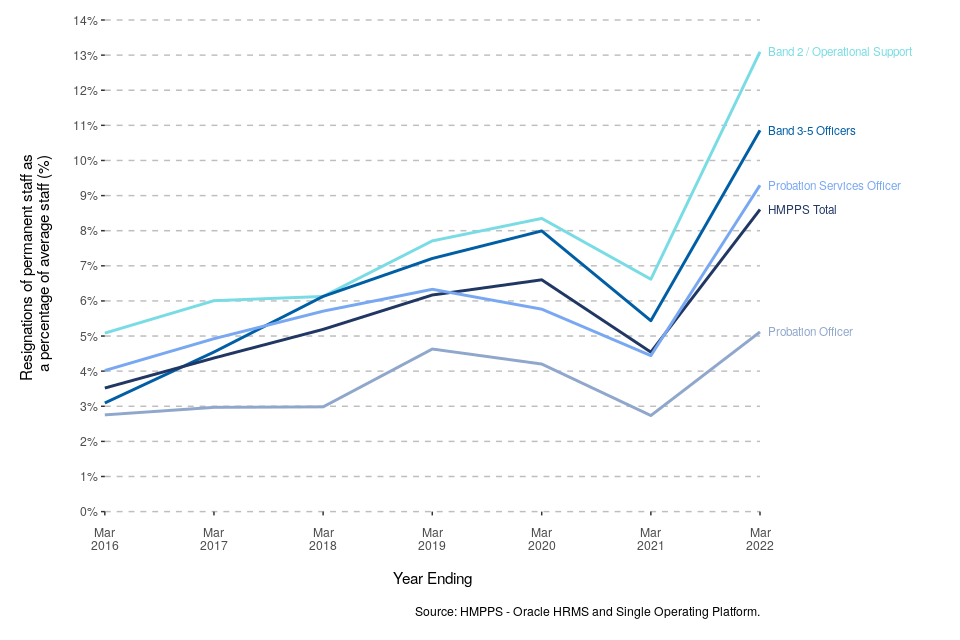
4.2 Resignation Rates[footnote 3]
The overall HMPPS resignation rate for the 12 months to 31 March 2022 was 8.6%, compared to 4.5% for the year to 31 March 2021 (Figure 6). For band 3-5 officers, the resignation rate was 10.9% in the year ending 31 March 2022, which is an increase of 5.4 percentage points since the year ending 31 March 2021. The resignation rate for OSG staff was 13.1% for the year ending 31 March 2022, which is an increase of 6.5 percentage points since the year ending 31 March 2021.
For Probation Service overall, the resignation rate was 6.9% for the year ending 31 March 2022. This represents an increase of 3.7 percentage points compared to the year ending 31 March 2021. Amongst the operational grades within the Probation Service, probation services officers had the highest resignation rate at 9.3%, (an increase of 4.9 percentage points) since the year ending 31 March 2021. Resignation rates for probation officers stood at 5.1% (an increase of 2.4 percentage points) since the year ending 31 March 2021).
Figure 6: Annual resignation rates of permanent staff in key operational grades, from the 12 months to 31 March 2016 to the 12 months to 31 March 2022 (Source: Table 12)
5. Sickness absence
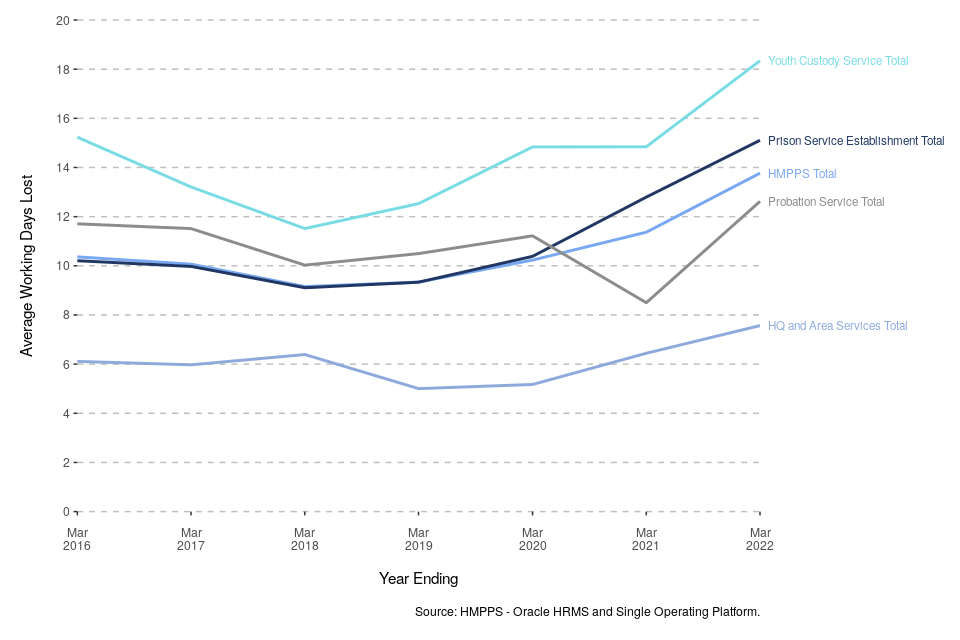
HMPPS staff lost an average of 13.8 working days to sickness absence in the 12 months ending 31 March 2022 (including COVID sickness)
This represents an increase of 2.4 Average Working Days Lost (AWDL) compared to the year ending 31 March 2021.
Since June 2021 these sickness absence figures include COVID-19 AWDL sickness numbers, including a revision to all AWDL figures since the start of the pandemic. In addition, please see the annex with experimental statistics on COVID-19 and HMPPS staff, which includes information about staff absent due to COVID on given days.
In the year ending 31 March 2022, HMPPS staff lost an average of 13.8 working days to sickness absence. This is an increase from 11.4 average working days lost for the year ending 31 March 2021, and an increase of 3.5 days compared to the predominantly COVID-19 free year ending 31 March 2020.
YCS staff had the highest sickness absence rate at 18.3 AWDL, followed by PSP (15.1 AWDL), Probation Service (12.6 AWDL), and HQ and Area Services (7.6 AWDL) (Figure 7). Compared to the year ending 31 March 2021, these represent an increase of 3.5 days for YCS, an increase of 2.3 days for PSP, an increase of 4.1 days for Probation Service, and an increase of 1.1 days for HQ and Area Services staff.
Figure 7: Average working days lost to sickness absence, 12 months to 31 March 2016 to 12 months to 31 March 2022 (Source: Table 18)
The most common category of sickness absence in terms of days lost was mental and behavioural disorders, corresponding to 30.2% of absences in the past year. This category was most prevalent for probation officers, where 49.7% of working days lost were attributed to mental and behavioural disorders.
For HMPPS overall the category that accounted for the second largest proportion of working days lost was epidemic/pandemic (22.0%). Together the top two categories accounted for 52.2% of all working days lost.
6. Equality and Diversity
Data on the protected characteristics of ethnicity, disability, sexual orientation, and religion/belief are collected from self-declared, non-compulsory fields. Consequently, only figures for which declaration rates have reached a threshold of 60% or above have been reported in the following section.
For staff in post as at 31 March 2022 the main representation rates were as follows; 53.6% of staff were female, 12.0% were ethnic minorities (excluding White minorities), 15.4% disabled, 6.9% were LGB and 8.4% were Non Christian.
For new staff joining in the 12 months to 31 March 2022 the main representation rates were as follows; 57.2% of staff were female, 9.2% disabled, 10.2% were LGB and 8.6% were Non Christian. Declaration rates for ethnicity are below 60% so are therefore not reported.
For staff leaving in the 12 months to 31 March 2022 the main representation rates were as follows; 50.5% of staff were female, 10.9% were Ethnic Minority, 14.6% disabled, 8.2% were LGB and 7.9% were Non Christian.
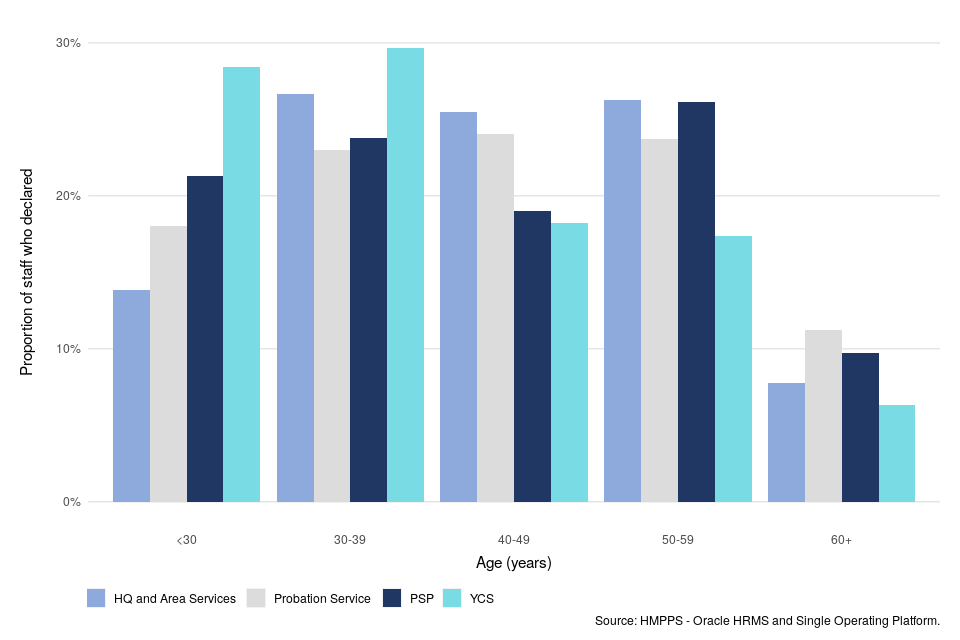
6.1 Age
The largest individual age group across all of HMPPS at 31 March 2022 was 50-59 year olds with 15,644 staff (25.2%). The number of staff aged under 30 increased by 1,627 in the 12 months to 31 March 2022 compared to the previous year and made up 19.8% of the HMPPS workforce. HQ and Area Services had the oldest workforce, consisting of 59.5% of staff who were aged 40 or over. This is compared to 59.0% among Probation Service staff, 54.9% among PSP staff, and 41.9% among YCS staff.
Those aged under 30 make up the highest proportion of joiners (55.7%) overall, and those aged under 30 make up the highest proportion of leavers (32.0%) overall.
Figure 8: Age of HMPPS staff, as at 31 March 2022 (Source: Table 5)
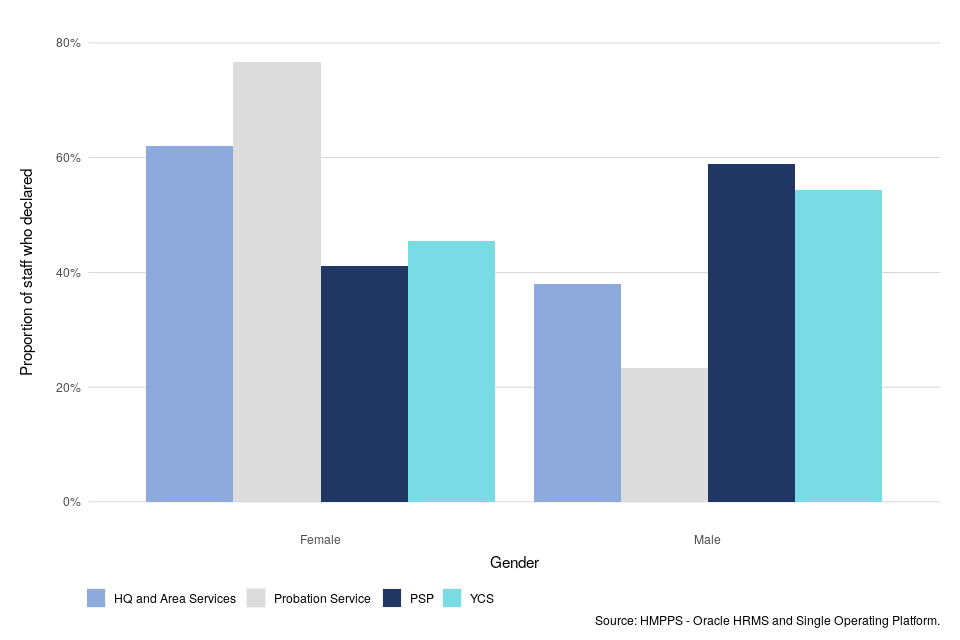
6.2 Gender
As at 31 March 2022, 53.6% of HMPPS staff overall were female, which is an increase compared to 50.0% the previous year. Female representation was highest within the Probation Service at 76.6%, compared to 62.0% in HQ and Area Services, 45.6% in the YCS, and 41.1% in PSP.
Across all of HMPPS, over the 12 months to 31 March 2022, 57.2% of joiners and 50.5% of leavers were female.
Figure 9: Gender of HMPPS staff, as at 31 March 2022 (Source: Table 5)
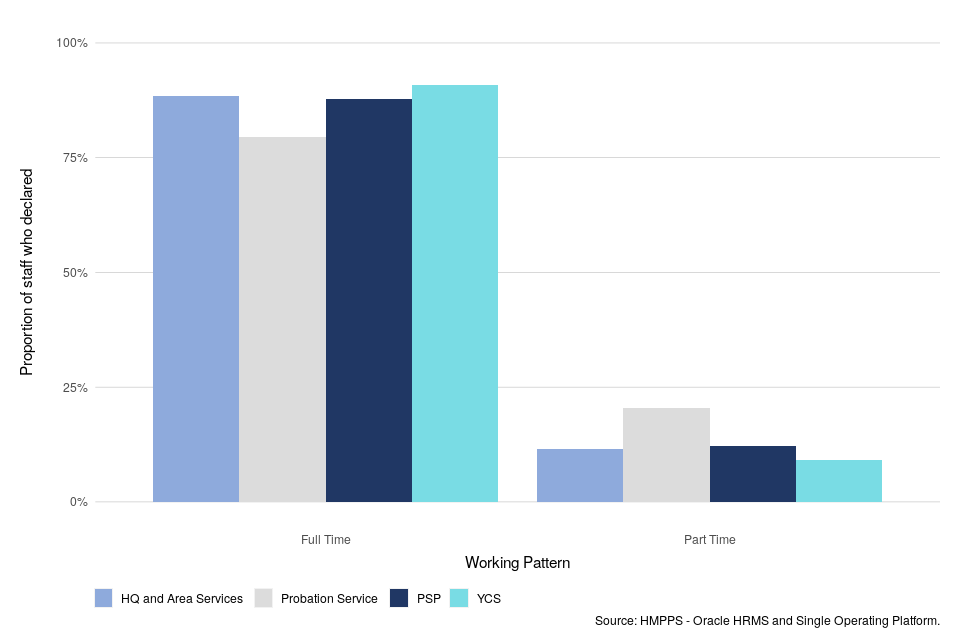
6.3 Full time/part time status
Full time/part time is a status that may fluctuate across an individual’s career. Part time as a grouping covers a wide range of working patterns and working hours. Within HMPPS overall, 14.5% of the workforce were identified as working part time, representing a slight increase of 0.6 percentage points compared to the previous year. Working on a part time basis is more common amongst staff in the Probation Service. As at 31 March 2022, 20.6% of Probation Service staff were working part time, compared to 12.2% of staff in PSP, 11.6% of staff in HQ and Area Services, and 9.1% of staff in YCS.
Only 3.3% of joiners identified as working part time, which is to be expected given this period usually marks the start of an individual’s career, whilst 16.3% of leavers were recognised as having part time status.
Figure 10: Working pattern of HMPPS staff, as at 31 March 2022 (Source: Table 5)
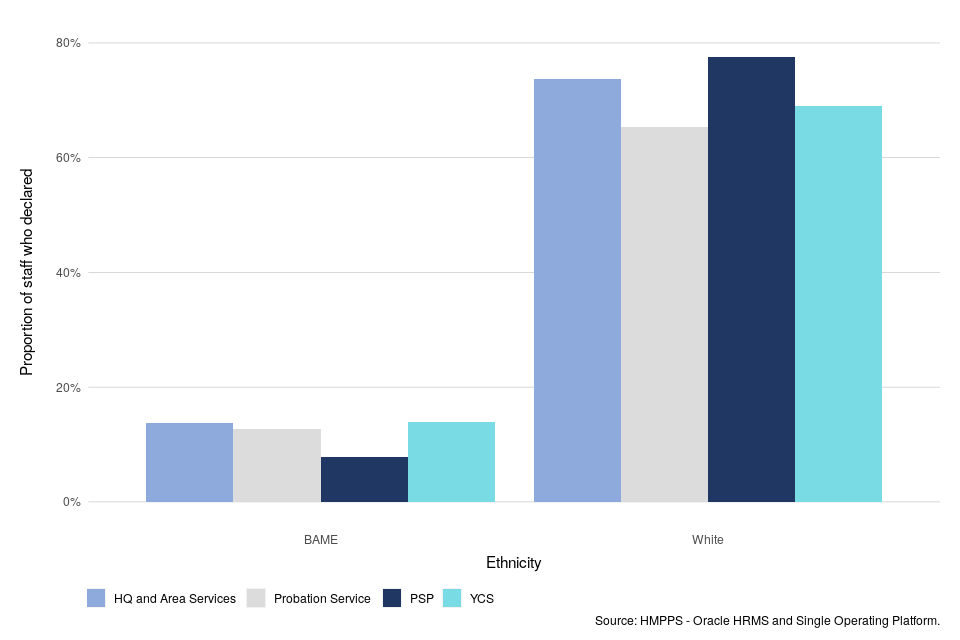
6.4 Ethnicity
As at 31 March 2022, 12.0% of HMPPS staff who had declared their ethnicity were from Ethnic Minorities (excluding White minorities) backgrounds, which is a slight increase of 1.1 percentage points compared to the previous year. PSP had the lowest representation rate with 9.1% of staff who declared their ethnicity being Ethnic Minorities (excluding White minorities) (a slight increase of 0.7 percentage points since 31 March 2021), compared to 15.7% of staff in HQ and Area Services (no substantial change since 31 March 2021), 16.4% of staff in Probation Service (a slight increase of 0.8 percentage points since 31 March 2021), and 16.8% of staff in YCS (a slight increase of 0.9 percentage points since 31 March 2021).
In the 12 months to 31 March 2022, 10.9% of leavers across all of HMPPS who had declared their ethnicity were from Ethnic Minorities (excluding White minorities) backgrounds.
Figure 11: Ethnicity of HMPPS staff, as at 31 March 2022 (Source: Table 5)
6.5 Other Protected Characteristics
From March 2020, most of the declaration rates for disability, religion/belief, and sexual orientation for HMPPS overall, PSP, YCS, HQ & Area Services, and Probation Service were for the first time above the 60% threshold for reporting.
As at 31 March 2022, 15.4% of HMPPS staff who had declared their disability status were disabled. PSP had the lowest representation rate with 12.1% of staff who declared their disability status being disabled, compared to 13.0% of staff in YCS, 14.8% of staff in HQ and Area Services, and 22.2% of staff in Probation Service. In the 12 months to 31 March 2022, 9.2% of joiners and 14.6% of leavers across all of HMPPS who had declared their disability status were disabled.
As at 31 March 2022, LGB staff represented 6.9% of HMPPS staff who had declared their sexual orientation. Probation Service had the lowest representation rate with 6.5% of staff who declared their sexual orientation identifying as LGB, compared to 6.7% of staff in HQ and Area Services, 7.2% of staff in PSP, and 7.7% of staff in YCS. In the 12 months to 31 March 2022, 10.2% of joiners and 8.2% of leavers across all of HMPPS who had declared their sexual orientation were LGB.
As at 31 March 2022, 8.4% of HMPPS staff who had declared their religion or belief followed another (non-Christian) religion. PSP had the lowest representation rate with 7.2% of staff following a non-Christian religion, compared to 9.8% of staff in Probation Service, 9.9% of staff in HQ and Area Services, an 12.3% of staff in YCS. In the 12 months to 31 March 2022, 8.6% of joiners and 7.9% of leavers across all of HMPPS who had declared their religion were non-Christian.
No data are currently presented or available for the other protected characteristics of Marriage and Civil Partnership, Pregnancy and Maternity.
Data are not collected for Gender Reassignment as those in receipt of gender recognition certificates are recorded as their legal gender, and are not identified as being transgender in accordance with the Gender Recognition Act 2004 and the Equality Act 2010.
Further Information
Accompanying files
As well as this bulletin, the following products are published as part of this release:
-
A technical guide providing details of the HMPPS workforce structure as well as how the data are collected and processed. Information on the revisions policy and disclosure relevant to HMPPS staffing data is also included.
-
A set of summary tables for the latest quarter and year as well as over time.
-
A supplementary annex presenting experimental statistics on Probation Officers in post, their required staffing level, and the number of trainee and qualified Probation Officers.
-
A supplementary annex on the effect of the coronavirus (COVID-19) on HMPPS staff. They are experimental statistics and include information about COVID-19 related testing, sickness and deaths of HMPPS staff.
Official statistics
The statistics in this bulletin are classified as official statistics. The Statistics and Registration Service Act 2007 defines ‘official statistics’ as all those statistical outputs produced by the UK Statistics Authority’s executive office (the Office for National Statistics), by central Government departments and agencies, by the devolved administrations in Northern Ireland, Scotland, and Wales, and by other Crown bodies (over 200 bodies in total). The statistics in this bulletin comply with all aspects of the Code of Practice for Official Statistics. The Code encourages and supports producers of statistics to maintain their independence and to ensure adequate resourcing for statistical production. It helps producers and users of statistics by setting out the necessary principles and practices to produce statistics that are trustworthy, high quality and of public value.
Experimental Statistics
The statistics in the Recruitment annex and the annex on the effect of the coronavirus (COVID-19) on HMPPS staff are experimental statistics. Experimental statistics are a subset of newly developed or innovative official statistics undergoing evaluation. They are developed under the guidance of the Head of Profession for Statistics (HoP) and published to involve users and stakeholders in the assessment of their suitability and quality at an early stage. Therefore, we would like to receive feedback as to how useful they are, whether a different analysis would be preferable, or any other comments about them. If you wish to send any views you may have about these experimental statistics, please use the contact details below.
Contact
Press enquiries should be directed to the Ministry of Justice press office:
Tel: 020 3334 3536
Email: newsdesk@justice.gov.uk
Other enquiries about these statistics should be directed to:
Chris Casanovas
Corporate Data Sharing Lead
Data and Evidence as a Service
Ministry of Justice
10 South Colonnade
London
E14 4PH
Email: statistics.enquiries@justice.gov.uk
Next update: 18 August 2022
URL: www.gov.uk/government/collections/national-offender-management-service-workforce-statistics
© Crown copyright
Produced by the Ministry of Justice
Alternative formats are available on request from statistics.enquiries@justice.gov.uk
-
This includes staff in Probation Service grades working in other parts of HMPPS. ↩
-
Percentage of staff with a permanent contract of employment who left HMPPS, including individuals who have retired early, but excluding staff who left due to voluntary early departure schemes and redundancy (VEDSR). ↩
-
Percentage of staff with a permanent contract of employment who resigned from HMPPS. ↩