Her Majesty’s Prison and Probation Service workforce quarterly: March 2021
Published 20 May 2021
Applies to England and Wales

© Crown copyright 2021
This publication is licensed under the terms of the Open Government Licence v3.0 except where otherwise stated. To view this licence, visit nationalarchives.gov.uk/doc/open-government-licence/version/3 or write to the Information Policy Team, The National Archives, Kew, London TW9 4DU, or email: psi@nationalarchives.gov.uk.
Where we have identified any third party copyright information you will need to obtain permission from the copyright holders concerned.
This publication is available at https://www.gov.uk/government/statistics/hm-prison-and-probation-service-workforce-quarterly-march-2021/her-majestys-prison-and-probation-service-workforce-quarterly-march-2021
Main Points
| 51,266 full time equivalent (FTE) staff in post | This is an increase of 1,251 (2.5%) FTE staff in post since 31 March 2020 and an increase of 1,081 (2.2%) since 31 December 2020. Of the staff in post, there were 34,159 in Public Sector Prisons (PSP), 10,020 staff in the National Probation Service (NPS), 5,557 FTE staff in HQ and Area Services, and 1,531 in the Youth Custody Service (YCS). |
| 21,926 FTE band 3-5 prison officers in post | This is no substantial change since 31 March 2020 and a slight increase of 362 (1.7%) FTE prison officers compared to 31 December 2020. |
| 4,970 FTE band 2 operational support staff in post | This corresponds to an increase of 237 (5.0%) since 31 March 2020 and a slight increase of 70 (1.4%) FTE operational support staff since 31 December 2020. |
| 3,537 FTE band 4 probation officers in post | This figure is an increase of 76 (2.2%) since 31 March 2020 and a decrease of 117 (3.2%) compared to 31 December 2020. In addition to the band 4 probation officers, there were 3,136 FTE band 3 probation services officers: an increase of 393 (14.3%) since 31 March 2020 and an increase of 461 (17.2%) since 31 December 2020. |
| Leaving rate of 9.1% amongst band 3-5 prison officers | This is a decrease of 3.1 percentage points compared to the year ending 31 March 2020. The overall leaving rate across HMPPS over the past year stood at 8.3%, which is a decrease of 2.2 percentage points compared to the year ending 31 March 2020. |
This publication provides details of staffing levels, staff inflows and outflows, sickness absence rates, and protected characteristics for the directly employed workforce of HMPPS. Information presented covers PSP, the NPS, the YCS, and HMPPS headquarters, which includes Area Services that provide direct operational support to prisons. Technical details and explanatory notes can be found in the accompanying Guide to HMPPS Workforce Statistics.
Statistician’s comment
The effect of COVID-19 during the previous year is still very much apparent in the latest figures - such as in the leaving rate for HMPPS (8.3%, compared to 10.5% for the year ending 31 March 2020), and in the non-COVID absence sickness figures (7.4 days in 2020-21 compared to 10 days for 2019-20).
However, some of the latest figures indicate the initial stages of the recovery - such as in the COVID annex which shows a drop in the number of staff absent due to COVID-19 for the last three months. Additionally there was a rise in the number of staff who joined HMPPS in the latest quarter, predominantly in the operational grades .
Points to note
Her Majesty’s Prison and Probation Service
On 1 April 2017, Her Majesty’s Prison and Probation Service (HMPPS) replaced the National Offender Management Service (NOMS), an agency of the Ministry of Justice. HMPPS is focused on supporting operational delivery and the effective running of prison and probation services across the public and private sectors. HMPPS works with a number of partners to carry out the sentences given by the courts, either in custody or the community. This publication covers the reporting period up to 31 March 2021 and therefore considers in detail quarterly staffing levels and staff inflows and outflows, for both NOMS and HMPPS, since April 2014.
For ease, the statistics in this publication will be referred to as those of the HMPPS workforce (i.e. staff working in HMPPS and with a contract of employment with HMPPS, excluding those on career breaks and those on secondment or loan outside of HMPPS but including staff on secondment or loan into HMPPS). In April 2017, the Youth Custody Service (YCS) was launched and forms another distinct arm of HMPPS. In terms of how these particular staffing figures appear in the statistics, central YCS units are categorised within HQ and Area Services whilst the Youth Custody Estate element of this new YCS category is now included separately in the publication tables. This covers staffing figures relating to Cookham Wood, Feltham, Werrington, and Wetherby Youth Offending Institutions (YOIs) as well as Medway Secure Training Centre (STC), which closed on 31 March 2020. Historically these figures would have been included within the wider Public Sector Prisons (PSP) category. Historical and latest figures for the Youth Custody Estate have been separated out to allow comparisons to be made and to establish the trends over time for these YOIs and Medway STC.
Further information on the introduction of the YCS has been set out in the accompanying Guide to Workforce Statistics. Only staff in PSP, YCS, HMPPS HQ and Area Services, as well as the National Probation Service (NPS), are directly employed by HMPPS and therefore staffing in private sector establishments, community rehabilitation companies and other contractors are excluded.
Coronavirus (COVID-19)
Figures relating to effect of the coronavirus (COVID-19) on HMPPS staff are published alongside this edition of the bulletin as a separate annex. They are experimental statistics and include information about covid related testing, sickness and deaths of HMPPS staff. It should be noted sickness absence due to COVID is not included in the core publication AWDL estimates, this is because this data is currently under review and once complete will be included in future publication AWDL reporting.
Annex on Prison Officer recruitment diversity
As noted previously, the annex with experimental statistics on Prison Officer and OSG recruitment has been moved to a six-monthly production cycle, and has not been produced this quarter. A review of this annex is currently in progress with the intention of publishing a revised annex in the future.
Annex on Probation Officer Vacancies and Trainees
As of the June 2019 publication, an experimental statistics annex has been added to this bulletin which presents figures on Probation Officers in post, their required staffing level, in addition to the number of trainee and qualified Probation Officers.
Reporting of figure differences
Full time equivalent figures are rounded to the nearest whole number, while percentages and working days lost are rounded to one decimal place. Due to this rounding, reported differences may appear not to match the apparent difference between the reported figures. For example, if a previous percentage was reported as 46.7% (rounded from 46.74%) and the new percentage 46.9% (rounded from 46.86%), then the difference reported would be 0.1 percentage points (rounded from 0.12).
Organisational Changes
-
From 20 August 2018, HMPPS exercised its right to step in and take over the running of HMP Birmingham for an initial period of six months, while the existing G4S management remained in place. This was further extended in February 2019, until HMP Birmingham transferred back into HMPPS on 1 July 2019. HMP Birmingham is therefore included in the figures within this publication as of the July to September 2019 quarter.
-
In November 2019, over 1,200 NPS FTE staff were moved into the Community and Interventions directorate (part of HMPPS HQ and Area Services). These changes are included in this bulletin as of the September to December 2019 quarter.
-
During December 2019, 274 FTE NPS staff were transferred from the privately-run CRC in Wales to HMPPS, as the new establishment NPS Wales UM Transition. Their figures are included in this bulletin as of the September to December 2019 quarter.
-
Medway Secure Training Centre closed on 31 March 2020.
-
There were some changes to the regional structure of NPS as from 1st April 2020.
Future Plans
For future publications we are considering ways in which we can improve the bulletin, and some of the issues we may look into are as follows:
- How to make the tables and presentation of the figures more user-friendly.
- Whether to and how to expand the range of information provided.
- We are now actively reviewing the Experimental Recruitment Diversity annex to determine whether it is fit for purpose, and if not, how it might be changed, or even whether to cease its production.
If you have any particular comments or views on the above, or any other aspects you would like to be considered about this bulletin, please contact us at the address given at the end of the publication.
1. Total HMPPS staff in post
51,266 full time equivalent (FTE) staff in post (as at 31 March 2021)
This is an increase of 1,251 (2.5%) FTE staff in post since 31 March 2020 and an increase of 1,081 (2.2%) since 31 December 2020. Of the staff in post, there were 34,159 in Public Sector Prisons (PSP), 10,020 staff in the National Probation Service (NPS), 5,557 FTE staff in HQ and Area Services, and 1,531 in the Youth Custody Service (YCS).
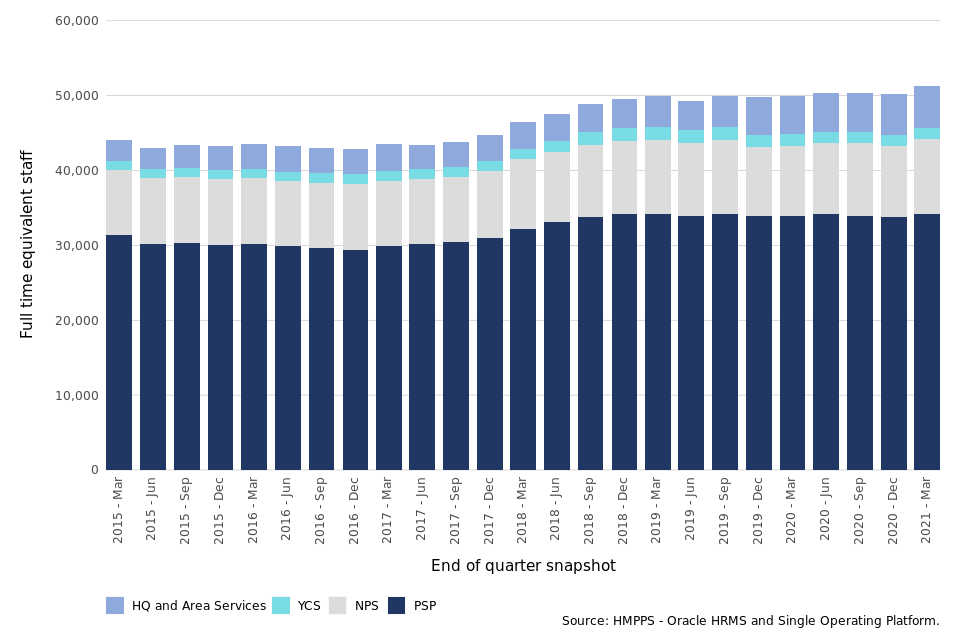
As at 31 March 2021, there were 51,266 staff in post in HMPPS on a full time equivalent (FTE) basis (Figure 1). This includes 34,159 FTE staff in PSP (making up 66.6% of all HMPPS staff), 10,020 in the NPS (19.5% of all HMPPS staff), 5,557 in HMPPS HQ and Area Services (10.8% of all HMPPS staff), and 1,531 in the YCS (3.0% of all HMPPS staff).
Compared to 31 March 2020, the overall FTE increased by 1,251 (2.5%): FTE in PSP slightly increased by 275 (0.8%), FTE in the NPS increased by 606 (6.4%), FTE in HQ and Area Services increased by 370 (7.1%), and FTE in the YCS remained the same. These changes are affected by the organisational changes described above, such as the closure of Medway Secure Training Centre in March 2020
As at 31 March 2021, there were 27,880 FTE (54.4% of HMPPS staff) operational prison service staff (including YCS staff). This is a slight increase of 253 FTE staff (0.9%) compared to 31 March 2020. Non-operational roles across PSP, YCS, and HMPPS HQ accounted for 12,140 FTE posts (23.7% of HMPPS staff), which is a slight increase of 200 FTE (1.7%) since 31 March 2020. In the NPS grades there were 11,246 FTE staff[footnote 1] (21.9% of all HMPPS staff): an increase of 798 (7.6%) since 31 March 2020.
Figure 1: Number of HMPPS staff in post on an FTE basis, 31 March 2015 to 31 March 2021 (Source: Table 1)
1.1 Length of Service
Length of service information has been calculated for HMPPS staff from the most recent hire date. Where staff have transferred in from another government department or have transferred in through HMPPS taking over a function, length of service is calculated from entry to HMPPS.
Across HMPPS overall, 28.7% of FTE staff in post had less than 3 years’ service, which was a decrease from 32.4% at 31 March 2020 and a slight decrease from 29.9% at 31 December 2020. Meanwhile, 35.9% of HMPPS FTE staff in post overall had 10 years or more of experience, representing a decrease from 38.1% at 31 March 2020 and a slight decrease from 36.8% at 31 December 2020.
It should be noted, however, that the NPS was created on 1 June 2014 and the service of NPS staff in Probation Trusts prior to the creation of the NPS is not included. Therefore, the figures relating to the length of service of NPS staff, which are included in the HMPPS overall figures, do not necessarily represent their full experience but rather the length of service from entry to HMPPS.
Excluding the NPS, 29.0% of FTE staff in post across HMPPS had less than 3 years’ service as at 31 March 2021. This is a decrease of 4.3 percentage points compared to 31 March 2020. The non-NPS staff with 10 years’ experience or more made up 44.1% of the workforce, which is a 2.3 percentage points decrease compared to 31 March 2020.
2. Band 3-5 prison officers and band 2 operational support staff
21,926 FTE band 3-5 prison officers in post (as at 31 March 2021)
This is no substantial change since 31 March 2020 and a slight increase of 362 (1.7%) FTE prison officers compared to 31 December 2020.
4,970 FTE band 2 operational support staff in post (as at 31 March 2021)
This corresponds to an increase of 237 (5.0%) since 31 March 2020 and a slight increase of 70 (1.4%) FTE operational support staff since 31 December 2020.
The key operational grades in public sector prisons are the band 3 to 5 prison officers. They consist of band 3 prison officers, band 4 officer specialists, band 4 supervising officers, and band 5 custodial managers.
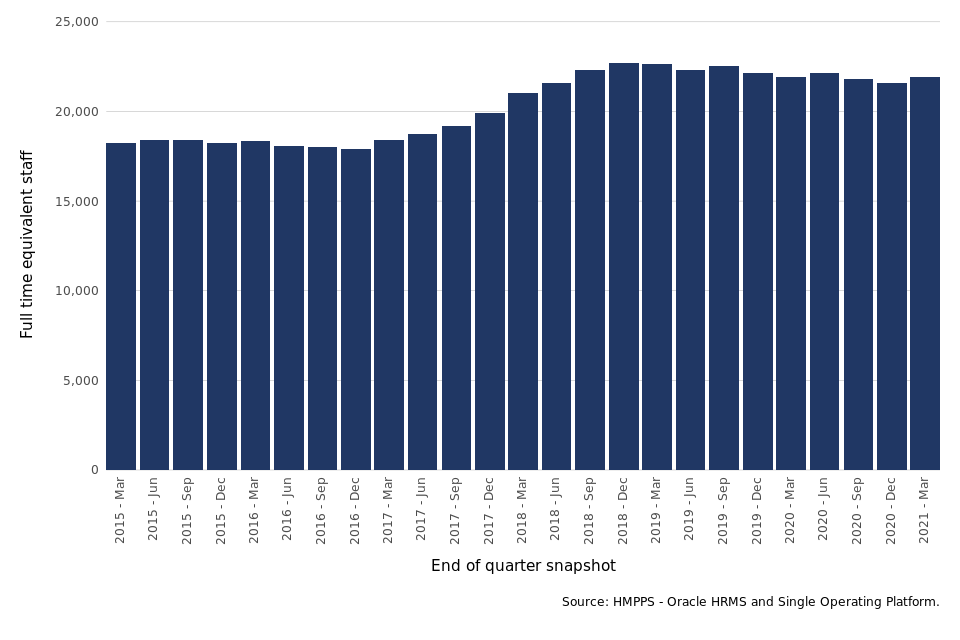
As at 31 March 2021, there were 21,926 FTE band 3 to 5 officers, which is no substantial change compared to 31 March 2020 and a slight increase of 362 (1.7%) FTE prison officers since the previous quarter (Figure 2).
The number of band 2 operational support grade (OSG) FTE staff increased by 237 (5.0%) against the previous year and slightly increased by 70 (1.4%) compared to the previous quarter, to stand at 4,970 for 31 March 2021.
Figure 2: Number of band 3-5 prison officers in post on an FTE basis, 31 March 2015 to 31 March 2021 (Source: Table 3)
The proportion of band 3-5 prison officers with less than 3 years’ service at 31 March 2021 fell to 32.3% compared to 39.7% as at 31 March 2020. The proportion of officers in post with 10 years or more of experience decreased by 2.9 percentage points from 43.7% at 31 March 2020 to 40.7% at 31 March 2021. This corresponds to 8,930 FTE staff with 10 years or more of experience at 31 March 2021, which is a fall of 647 FTE, or 6.8% since 31 March 2020.
The proportion of band 2 OSG FTE staff with less than 3 years’ service slightly increased from 36.3% at 31 March 2020 to 38.2% at 31 March 2021, and the proportion of those with 10 years or more of experience decreased from 44.8% at 31 March 2020 to 40.4% at 31 March 2021.
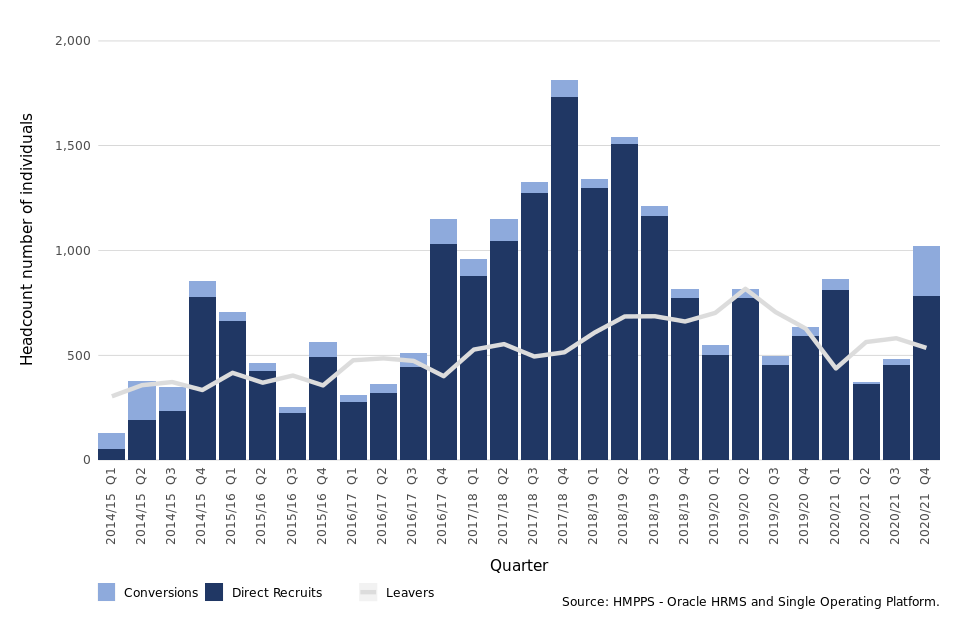
Figure 3 shows a quarterly trend of band 3 to 5 appointments and leavers since 2014/15. Over the year to 31 March 2021, 2,738 band 3 to 5 officers were appointed (consisting of direct new recruits and existing staff who converted to a band 3 officer grade), an increase of 239 (9.6%) compared to 2,499 in the previous year. Looking at the quarterly figures, the headcount of new band 3 to 5 officer appointments increased by 542 (112.9%) from 480 between October and December 2020 to 1,022 between January and March 2021 (Table 17).
The headcount of band 3 to 5 prison officers who left HMPPS in the year ending 31 March 2021 was 2,116, which is a decrease of 736 (25.8%) compared to the year ending 31 March 2020. Examining reasons for leaving, 58.5% of prison officers who left in the year ending 31 March 2021 resigned from their roles (down from 64.7% in the year ending 31 March 2020). Of the other prison officers who left HMPPS, 16.4% were dismissed and 10.1% retired in the year ending 31 March 2021: up from 14.3% and down from 8.7%, respectively, compared to the previous year.
Figure 3: Newly appointed band 3 to 5 prison officers and band 3 to 5 prison officer leavers, April 2014 to 31 March 2021 (Source: Table 17)
The number of band 2 OSG staff who joined HMPPS in the year ending 31 March 2021 was 1,135: an increase of 349 (44.4%) compared to the previous year ending 31 March 2020. There was an increase of 239 (26.7%) since the year ending 31 December 2020. The headcount number of band 2 OSG staff who left HMPPS was 612, which is a decrease of 15 (2.4%) compared to the year ending 31 March 2020 and an increase of 18 (3.0%) compared to the year ending 31 December 2020.
Joiners and leavers are not the only movements into and out of the band 3 to 5 officer grouping. There are also typically differences in the proportion of new joiners and older officers who work part time as well as movements between grades. For these reasons, the change in FTE does not directly reflect the difference between the number of joiners and leavers. Changes such as staff switching from full time to part time have the effect of reducing the FTE of officers available as they progress through their career.
3. Probation practitioners and senior probation officers
3,537 FTE band 4 probation officers in post (as at 31 March 2021)
This figure is an increase of 76 (2.2%) since 31 March 2020 and a decrease of 117 (3.2%) FTE probation officers compared to 31 December 2020. In addition to the band 4 probation officers, there were 3,136 FTE band 3 probation services officers: an increase of 393 (14.3%) since 31 March 2020 and an increase of 461 (17.2%) since 31 December 2020.
Key grades in the NPS include band 3 probation services officers, band 4 probation officers (collectively known as probation practitioners), as well as band 5 senior probation officers. Staff who are training to be a probation officer work as a probation services officer during their training, so a proportion of the probation services officers in post will be working towards the professional probation officer qualification.
As of the June 2019 publication, an experimental statistics annex has been added to this bulletin which presents figures on Probation Officers in post, their required staffing level, in addition to the number of trainee and qualified Probation Officers.
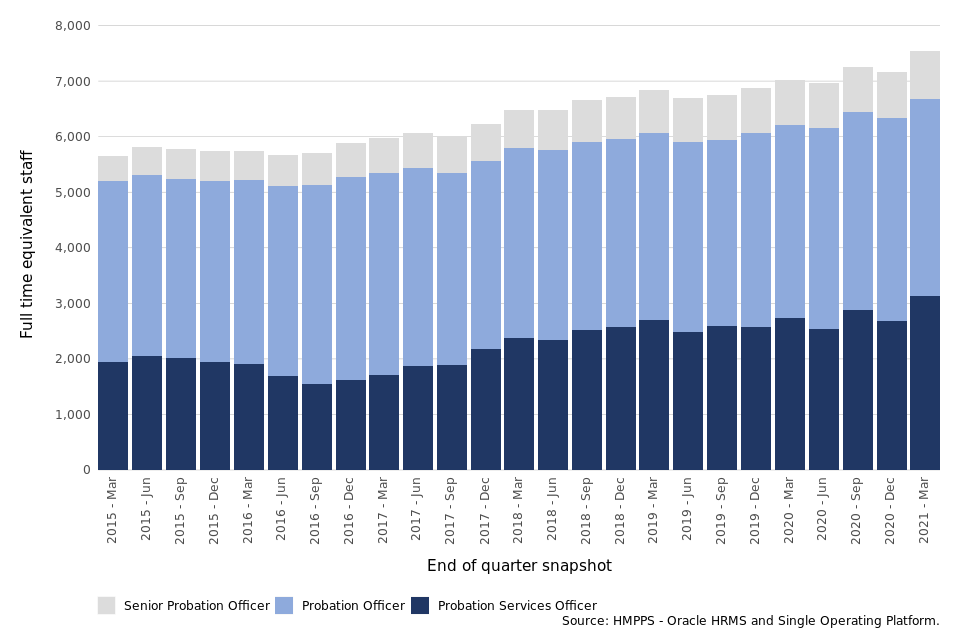
As at 31 March 2021 there were 3,136 FTE band 3 probation services officers in post, an increase of 393 (14.3%) over the past year and an increase of 461 (17.2%) over the quarter; 3,537 FTE band 4 probation officers, representing an increase of 76 (2.2%) over the past year and a decrease of 117 (3.2%) compared to the previous quarter; and 874 FTE band 5 senior probation officers, showing an increase of 63 (7.8%) over the previous year and an increase of 35 (4.2%) since the last quarter (Figure 4).
Figure 4: Number of probation officers, probation services officers and senior probation officers in post on an FTE basis, 31 March 2015 to 31 March 2021 (Source: Table 3)
In the past year, 829 probation services officers were appointed, some of whom will be training to become qualified probation officers. This is an increase of 390 (88.8%) compared to the year ending 31 March 2020 and an increase of 206 (33.1%) compared to the number appointed in the year ending 31 December 2020, most likely reflecting the PQiP recruitment drive ahead of Probation unification during 2021. This recruitment drive aimed to recruit 1,000 probation officers in total for 2020/21, and in the 12 months to March 2021, 1,007 trainees started training, consisting of both external and internal candidates (please refer to the Probation recruitment annex for more details). In the past year, 208 probation services officers left the service. This is a decrease of 30 (12.6%) compared to the year ending 31 March 2020 and a decrease of 6 (2.8%) compared to the number who left in the year ending 31 December 2020.
4. Joiners and Leavers
Leaving rate of 9.1% amongst band 3-5 prison officers (for the year ending 31 March 2021)
This is a decrease of 3.1 percentage points compared to the year ending 31 March 2020. The overall leaving rate across HMPPS over the past year stood at 8.3%, which is a decrease of 2.2 percentage points compared to the year ending 31 March 2020.
Over the past year, 5,803 staff joined HMPPS, which is an increase of 597 (11.5%) compared to the year ending 31 March 2020. These joiners consisted of 3,946 across PSP, 160 in the YCS, 1,203 in the NPS, and 494 in HMPPS HQ and Area Services. Compared to the year ending 31 March 2020 these numbers of joiners represent an increase of 3.1% for PSP, an increase of 55.3% for YCS, an increase of 24.1% for NPS, and an increase of 62.0% for HMPPS HQ and Area Services.
There were 4,530 leavers in the year ending 31 March 2021, a decrease of 1,101 (19.6%) compared to the year ending 31 March 2020. This includes 3,407 leavers from PSP (a decrease of 19.6%), 124 from YCS (a decrease of 38.6%), 649 from the NPS (a decrease of 23.6%), and 350 from HMPPS HQ and Area Services (an increase of 2.6%).
4.1 Leaving Rates[footnote 2]
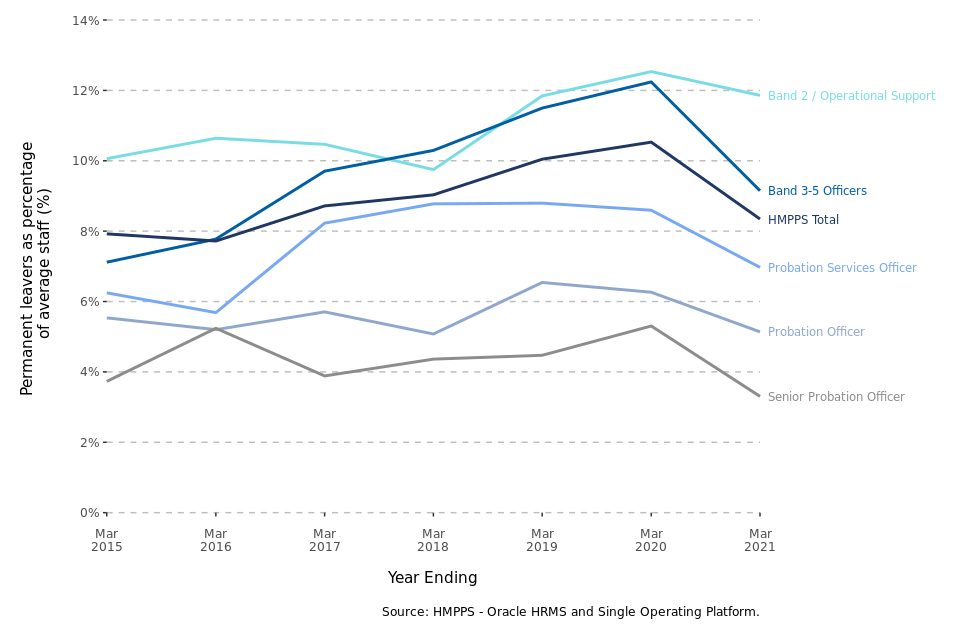
The overall HMPPS leaving rate for the year to 31 March 2021 was 8.3%, compared to 10.5% for the year to 31 March 2020 (Figure 5).The increased uncertainty in the employment market following the COVID-19 pandemic has most likely been one of the primary factors for the drop in the number of resignations during most of the year, thus impacting on the overall reduced leaving and resignation rates seen for the year. Specifically for band 3 to 5 prison officers, the leaving rate of 9.1% in the year ending 31 March 2021 represented a decrease of 3.1 percentage points since the year ending 31 March 2020. The leaving rate for band 2 OSG staff was 11.9% in the year ending 31 March 2021, which is a slight decrease of 0.7 percentage points compared to the year ending 31 March 2020.
The leaving rate for staff at the NPS overall in the year ending 31 March 2021 was 6.2%, which is a decrease of 1.7 percentage points since the year ending 31 March 2020. In the operational grades within the NPS, the leaving rate was highest amongst probation services officers at 7.0%: a slight decrease of 1.6 percentage points from the year ending 31 March 2020. Leaving rates for probation officers and senior probation officers stood at 5.1% (a slight decrease of 1.1 percentage points) and 3.3% (a slight decrease of 2.0 percentage points), respectively, compared to the year to 31 March 2020.
Figure 5: Annual leaving rates of permanent staff in key operational grades (excluding VEDSR), from the 12 months to 31 March 2015 to the 12 months to 31 March 2021 (Source: Table 11)
4.2 Resignation Rates[footnote 3]
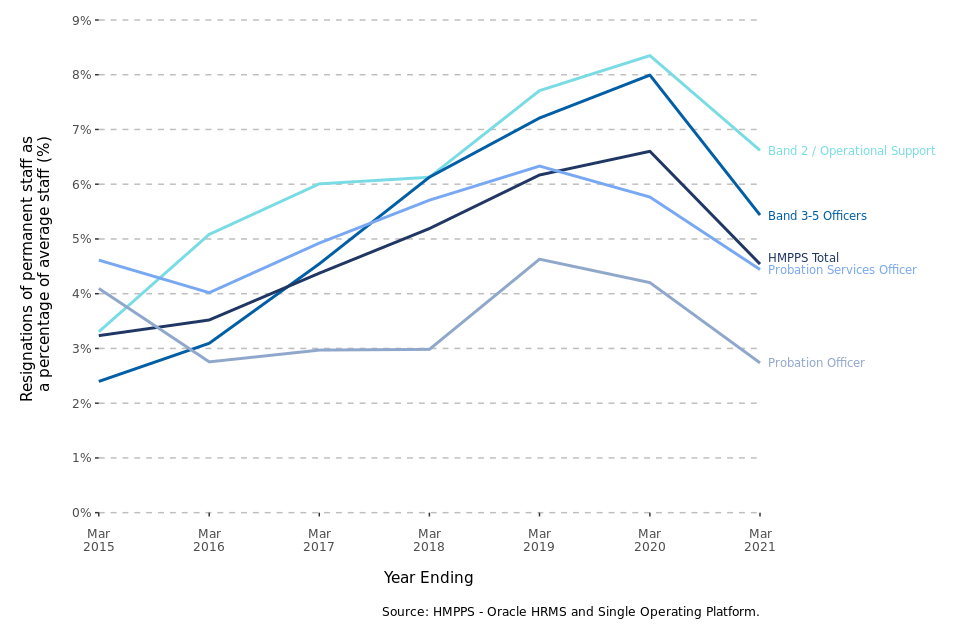
The overall HMPPS resignation rate for the year to 31 March 2021 was 4.5%, compared to 6.6% for the year to 31 March 2020 (Figure 6). Specifically for band 3-5 officers, the resignation rate was 5.4% in the year ending 31 March 2021, which is a decrease of 2.6 percentage points since the year ending 31 March 2020. The resignation rate for OSG staff was 6.6% for the year ending 31 March 2021, which is a decrease of 1.7 percentage points since the year ending 31 March 2020.
For NPS overall, the resignation rate was 3.3% for the year ending 31 March 2021. This represents a decrease of 1.8 percentage points compared to the year ending 31 March 2020. Amongst the operational grades within the NPS, probation services officers had the highest resignation rate at 4.4%, a slight decrease of 1.3 percentage points since the year ending 31 March 2020. Resignation rates for probation officers stood at 2.7% (a slight decrease of 1.5 percentage points since the year ending 31 March 2020).
Figure 6: Annual resignation rates of permanent staff in key operational grades, from the 12 months to 31 March 2015 to the 12 months to 31 March 2021 (Source: Table 12)
5. Sickness absence
HMPPS staff lost an average of 7.4 working days to sickness absence in the year ending 31 March 2021
This represents a decrease of 2.5 average working days lost (AWDL) compared to the year ending 31 March 2020. However, it should be noted that days lost to COVID-19 related sickness are not included in these figures, and that COVID-19 would likely have had an impact on other sickness reasons.
These sickness figures do not contain any COVID-19 related absence data. Please see the annex with experimental statistics on COVID-19 and HMPPS staff, which includes information about staff absent due to COVID on given days.
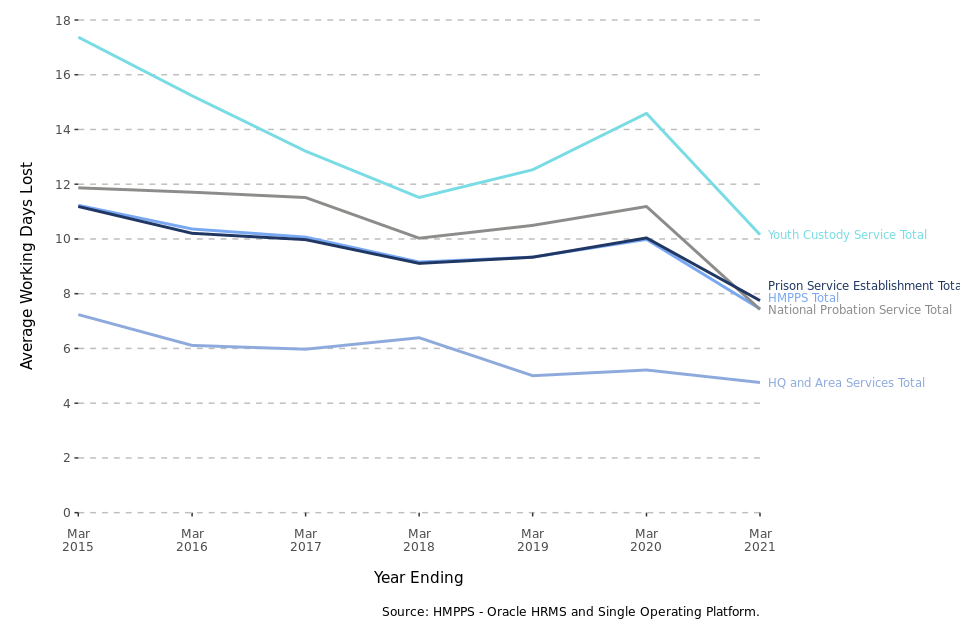
In the year ending 31 March 2021, HMPPS staff lost an average of 7.4 working days to sickness absence. This is a decrease from 10.0 average working days lost for the year ending 31 March 2020.
YCS staff had the highest sickness absence rate at 10.2 AWDL, followed by PSP (7.7 AWDL), NPS (7.4 AWDL), and HQ and Area Services (4.8 AWDL) (Figure 7). Compared to the year ending 31 March 2020, these represent a decrease of 4.4 days for YCS, a decrease of 2.3 days for PSP, a decrease of 3.8 days for NPS, and a decrease of 0.5 days for HQ and Area Services staff.
The rate for HMPPS overall has varied between 7.4 and 11.2 AWDL in the years since 2014/15.
Figure 7: Average working days lost to sickness absence, 12 months to 31 March 2015 to 12 months to 31 March 2021 (Source: Table 18)
The most common category of sickness absence in terms of days lost was mental and behavioural disorders, corresponding to 42.7% of absences in the past year. This category was most prevalent for probation officers, where 58.6% of working days lost were attributed to mental and behavioural disorders.
The category that accounted for the second largest proportion of working days lost was musculoskeletal system (22.7%). Together the top two categories accounted for 65.4% of all working days lost.
6. Equality and Diversity
Data on the protected characteristics of ethnicity, disability, sexual orientation, and religion/belief are collected from self-declared, non-compulsory fields. Consequently, only figures for which declaration rates have reached a threshold of 60% or above have been reported in the following section.
For staff in post as at 31 March 2021 the main representation rates were as follows; 50.0% of staff were female, 10.9% were BAME, 14.2% disabled, 6.5% were LGB and 8.1% were Non Christian
For new staff joining in the 12 months to 31 March 2021 the main representation rates were as follows; 55.6% of staff were female, 9.1% disabled, 8.8% were LGB and 8.1% were Non Christian.
For staff leaving in the 12 months to 31 March 2021 the main representation rates were as follows; 46.9% of staff were female, 9.8% were BAME and 15.8% disabled.
6.1 Age
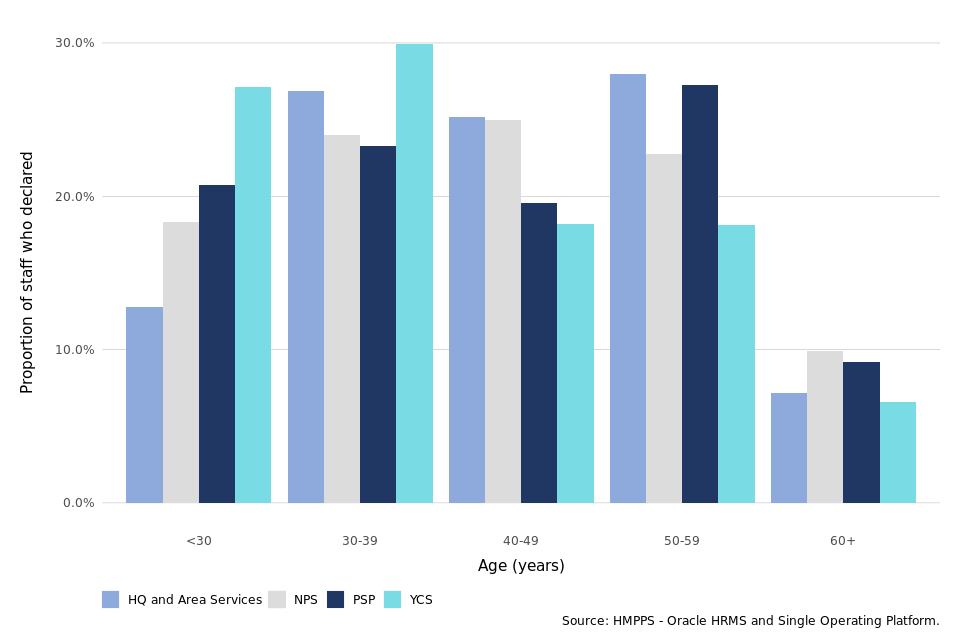
The largest individual age group across all of HMPPS at 31 March 2021 was 50-59 year olds with 14,206 staff (26.2%). The number of staff aged under 30 increased by 291 in the 12 months to 31 March 2021 compared to the previous year and made up 19.6% of the HMPPS workforce. HQ and Area Services had the oldest workforce, consisting of 60.3% of staff who were aged 40 or over. This is compared to 57.6% among NPS staff, 56.0% among PSP staff, and 42.9% among YCS staff.
Those aged under 30 make up the highest proportion of joiners (50.8%) overall, and those aged under 30 make up the highest proportion of leavers (29.8%) overall.
Figure 8: Age of HMPPS staff, as at 31 March 2021 (Source: Table 5)
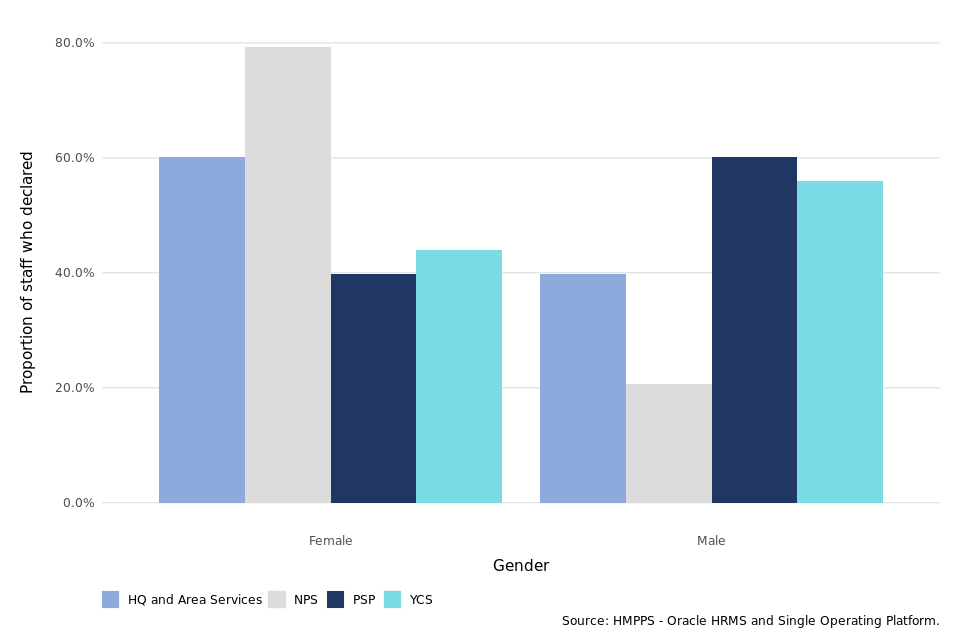
6.2 Gender
As at 31 March 2021, 50.0% of HMPPS staff overall were female, which is a slight increase compared to 49.0% the previous year. Female representation was highest within the NPS at 79.4%, compared to 60.2% in HQ and Area Services, 44.1% in the YCS, and 39.8% in PSP.
Across all of HMPPS, over the 12 months to 31 March 2021, 55.6% of joiners and 46.9% of leavers were female.
Figure 9: Gender of HMPPS staff, as at 31 March 2021 (Source: Table 5)
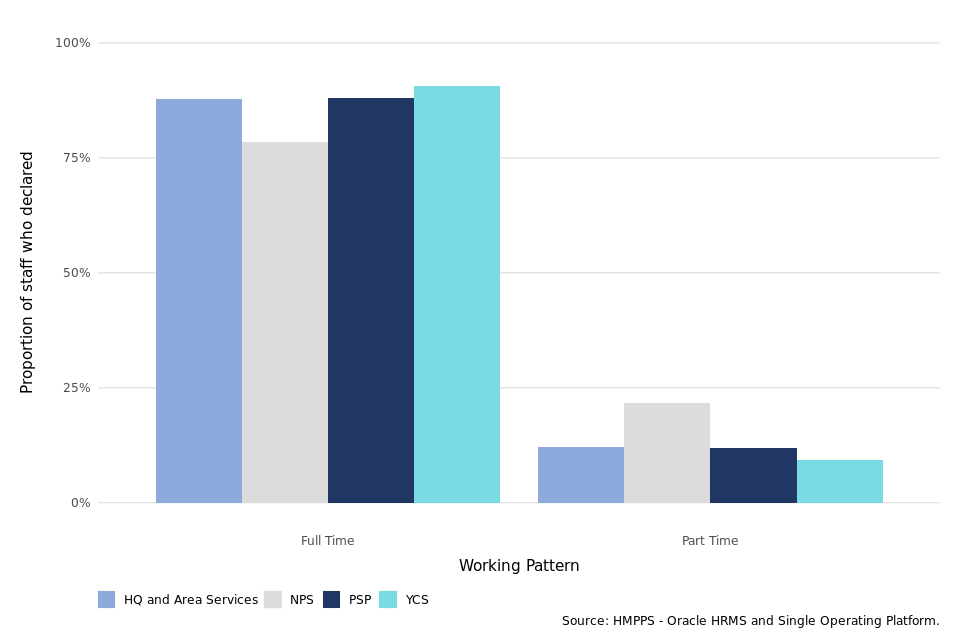
6.3 Full time/part time status
Full time/part time is a status that may fluctuate across an individual’s career. Part time as a grouping covers a wide range of working patterns and working hours. Within HMPPS overall, 13.9% of the workforce were identified as working part time, representing no substantial change compared to the previous year. Working on a part time basis is more common amongst staff in the NPS. As at 31 March 2021, 21.6% of NPS staff were working part time, compared to 12.1% of staff in HQ and Area Services, 12.0% of staff in PSP, and 9.3% of staff in YCS.
Only 5.8% of joiners identified as working part time, which is to be expected given this period usually marks the start of an individual’s career, whilst 17.6% of leavers were recognised as having part time status.
Figure 10: Working pattern of HMPPS staff, as at 31 March 2021 (Source: Table 5)
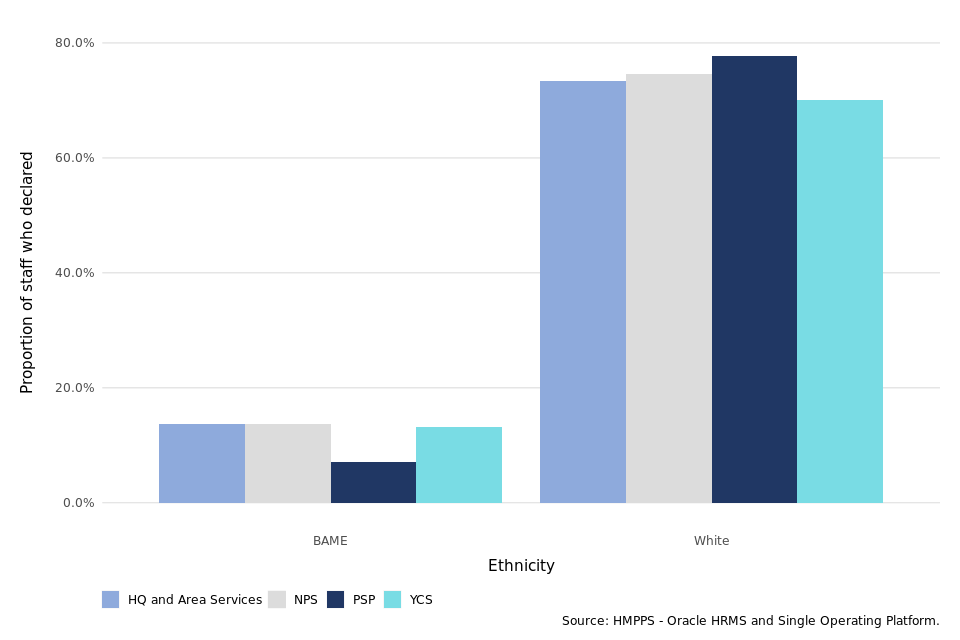
6.4 Ethnicity
As at 31 March 2021, 10.9% of HMPPS staff who had declared their ethnicity were from Black, Asian, and Minority Ethnic (BAME) backgrounds, which is a slight increase of 0.5 percentage points compared to the previous year. PSP had the lowest representation rate with 8.4% of staff who declared their ethnicity being BAME (no substantial change since 31 March 2020), compared to 15.6% of staff in NPS (a slight increase of 0.6 percentage points since 31 March 2020), 15.7% of staff in HQ and Area Services (a slight increase of 0.7 percentage points since 31 March 2020), and 15.9% of staff in YCS (no substantial change since 31 March 2020).
In the 12 months to 31 March 2021, 9.8% of leavers across all of HMPPS who had declared their ethnicity were from BAME backgrounds.
Figure 11: Ethnicity of HMPPS staff, as at 31 March 2021 (Source: Table 5)
6.5 Other Protected Characteristics
During 2019, most of the declaration rates for disability, religion/belief, and sexual orientation for HMPPS overall, PSP, YCS, HQ & Area Services, and NPS were for the first time above the 60% threshold for reporting.
As at 31 March 2021, 14.2% of HMPPS staff who had declared their disability status were disabled. PSP had the lowest representation rate with 11.9% of staff who declared their disability status being disabled, compared to 11.9% of staff in YCS, 14.0% of staff in HQ and Area Services, and 20.9% of staff in NPS. In the 12 months to 31 March 2021, 9.1% of joiners and 15.8% of leavers across all of HMPPS who had declared their disability status were disabled.
As at 31 March 2021, LGB staff represented 6.5% of HMPPS staff who had declared their sexual orientation. NPS had the lowest representation rate with 5.6% of staff who declared their sexual orientation identifying as LGB, compared to 5.9% of staff in HQ and Area Services, 6.9% of staff in PSP, and 7.4% of staff in YCS. In the 12 months to 31 March 2021, 8.8% of joiners and 6.7% of leavers across all of HMPPS who had declared their sexual orientation were LGB.
As at 31 March 2021, 8.1% of HMPPS staff who had declared their religion or belief followed another (non-Christian) religion. PSP had the lowest representation rate with 7.0% of staff following a non-Christian religion, compared to 9.6% of staff in NPS, 9.9% of staff in HQ and Area Services, and 13.2% of staff in YCS. In the 12 months to 31 March 2021, 8.1% of joiners and 8.2% of leavers across all of HMPPS who had declared their religion were non-Christian.
No data are currently presented or available for the other protected characteristics of Marriage and Civil Partnership, Pregnancy and Maternity.
Data are not collected for Gender Reassignment as those in receipt of gender recognition certificates are recorded as their legal gender, and are not identified as being transgender in accordance with the Gender Recognition Act 2004 and the Equality Act 2010.
Further Information
Accompanying files
As well as this bulletin, the following products are published as part of this release:
-
A technical guide providing details of the HMPPS workforce structure as well as how the data are collected and processed. Information on the revisions policy and disclosure relevant to HMPPS staffing data is also included.
-
A set of summary tables for the latest quarter and year as well as over time.
-
A supplementary annex presenting experimental statistics on Probation Officers in post, their required staffing level, and the number of trainee and qualified Probation Officers.
-
A supplementary annex on the effect of the coronavirus (COVID-19) on HMPPS staff. They are experimental statistics and include information about covid related testing, sickness and deaths of HMPPS staff.
Official statistics
The statistics in this bulletin are classified as official statistics. The Statistics and Registration Service Act 2007 defines ‘official statistics’ as all those statistical outputs produced by the UK Statistics Authority’s executive office (the Office for National Statistics), by central Government departments and agencies, by the devolved administrations in Northern Ireland, Scotland, and Wales, and by other Crown bodies (over 200 bodies in total). The statistics in this bulletin comply with all aspects of the Code of Practice for Official Statistics. The Code encourages and supports producers of statistics to maintain their independence and to ensure adequate resourcing for statistical production. It helps producers and users of statistics by setting out the necessary principles and practices to produce statistics that are trustworthy, high quality and of public value.
Experimental Statistics
The statistics in the Probation Officer annex and the annex on the effect of the coronavirus (COVID-19) on HMPPS staff are experimental statistics. Experimental statistics are a subset of newly developed or innovative official statistics undergoing evaluation. They are developed under the guidance of the Head of Profession for Statistics (HoP) and published to involve users and stakeholders in the assessment of their suitability and quality at an early stage. Therefore, we would like to receive feedback as to how useful they are, whether a different analysis would be preferable, or any other comments about them. If you wish to send any views you may have about these experimental statistics, please use the contact details below.
Contact
Press enquiries should be directed to the Ministry of Justice press office:
Tel: 020 3334 3536
Email: newsdesk@justice.gsi.gov.uk
Other enquiries about these statistics should be directed to:
Wincen Lowe
Data and Evidence as a Service
Ministry of Justice
10 South Colonnade
London
E14 4PH
Email: statistics.enquiries@justice.gov.uk
Next update: 19 August 2021
URL: www.gov.uk/government/collections/national-offender-management-service-workforce-statistics
© Crown copyright
Produced by the Ministry of Justice
Alternative formats are available on request from statistics.enquiries@justice.gov.uk
-
This includes staff in NPS grades working in other parts of HMPPS. ↩
-
Percentage of staff with a permanent contract of employment who left HMPPS, including individuals who have retired early, but excluding staff who left due to voluntary early departure schemes and redundancy (VEDSR). ↩
-
Percentage of staff with a permanent contract of employment who resigned from HMPPS. ↩