Main findings: further education and skills inspections and outcomes as at 31 August 2021
Updated 3 March 2022
Applies to England

© Crown copyright 2022
This publication is licensed under the terms of the Open Government Licence v3.0 except where otherwise stated. To view this licence, visit nationalarchives.gov.uk/doc/open-government-licence/version/3 or write to the Information Policy Team, The National Archives, Kew, London TW9 4DU, or email: psi@nationalarchives.gov.uk.
Where we have identified any third party copyright information you will need to obtain permission from the copyright holders concerned.
This publication is available at https://www.gov.uk/government/statistics/further-education-and-skills-inspections-and-outcomes-as-at-31-august-2021/main-findings-further-education-and-skills-inspections-and-outcomes-as-at-31-august-2021
This is the main findings report for the further education and skills inspections and outcomes as at 31 August 2021 release. The following are also available:
- underlying data, tables and charts
- methodology
- pre-release access list
Introduction
This release contains:
- provisional data for the most recent inspections and outcomes as at 31 August 2021
- provisional data for inspections and monitoring visits carried out between 1 September 2020 and 31 August 2021
The number of providers publicly funded to deliver further education, training and/or apprenticeships has increased by 76% between 31 August 2017 and 31 August 2021. This is mainly as a result of the apprenticeship funding reforms introduced in 2018.
The proportion of providers judged good or outstanding as at 31 August 2021 was 83%, an increase of 2 percentage points since 31 August 2020.
Of the providers that had a judgement made on their apprenticeship provision, 81% were judged good or outstanding at their full inspection or were judged to be making at least reasonable progress at their new provider monitoring visit (NPMV).
Impact of COVID-19 (coronavirus)
During the 2020/21 reporting year (1 September 2020 to 31 August 2021), full inspections were only able to take place during the last 3 months, between June and August.
In the months when routine inspections were suspended due to the pandemic, we carried out 253 interim visits and 135 progress monitoring visits (see management information – further education and skills – as at 31 August 2021).
We did not carry out any full inspections of prisons or young offender institutions between 1 September 2020 and 31 August 2021. However, as part of our phased return to inspection, we carried out interim remote visits and progress monitoring visits alongside HM Inspectorate of Prisons (HMIP). By the 30 September 2021, HMIP had published 17 of the interim remote visits and 5 of the progress monitoring visits. At the progress monitoring visits, we judged 3 prisons to be making reasonable progress and 2 insufficient progress.
Provider numbers
The number of providers publicly funded to deliver further education, training and/or apprenticeships has increased by 76% between 31 August 2017 and 31 August 2021. This is mainly as a result of the apprenticeship funding reforms introduced in 2018.
Between 31 August 2020 and 31 August 2021, an additional 307 providers became publicly funded and started delivering education, training and/or apprenticeships. Over the same period, we stopped reporting on 126 providers because they either merged, ceased to be funded or stopped delivering. On 31 August 2021, there were 2,053 further education and skills providers publicly funded and delivering education, training and/or apprenticeships recorded on Ofsted’s systems. This is 181 more than on 31 August 2020 and 885 more than on 31 August 2017.
The additional 307 providers include 273 independent learning providers (including employer providers) and 26 higher education institutions. All but 25 of the independent learning providers are delivering apprenticeships. All of the additional higher education institutions are delivering level 6 and 7 apprenticeships, which Ofsted became responsible for inspecting on 1 April 2021.
Of the 126 providers that we no longer report on, 118 were independent learning providers (including employer providers). Of these, 44 providers (37%) started and stopped receiving funding and delivering education, training and/or apprenticeships before Ofsted could carry out any form of inspection. Of the 26 providers that left after receiving an NPMV, we had judged just over half (14) to be making insufficient progress in at least one theme.
The number of general further education colleges that we report on has continued to decline. This is mainly due to established colleges merging to form new entities. Since 1 September 2020, we have 3 new entities to report on, each a result of 2 established colleges merging together. In addition, 2 National Colleges have closed. As at 31 August 2021, there were 163 general further education colleges recorded on Ofsted’s systems, 5 less than as at 31 August 2020.
The percentage of further education and skills providers not yet inspected or visited has increased by 2 percentage points since 31 August 2020. This is due to the increase in the number of providers and routine inspections being suspended for 3 months of the year (see Figure 1).
Figure 1: Number and proportion of further education and skills providers inspected or visited, over time
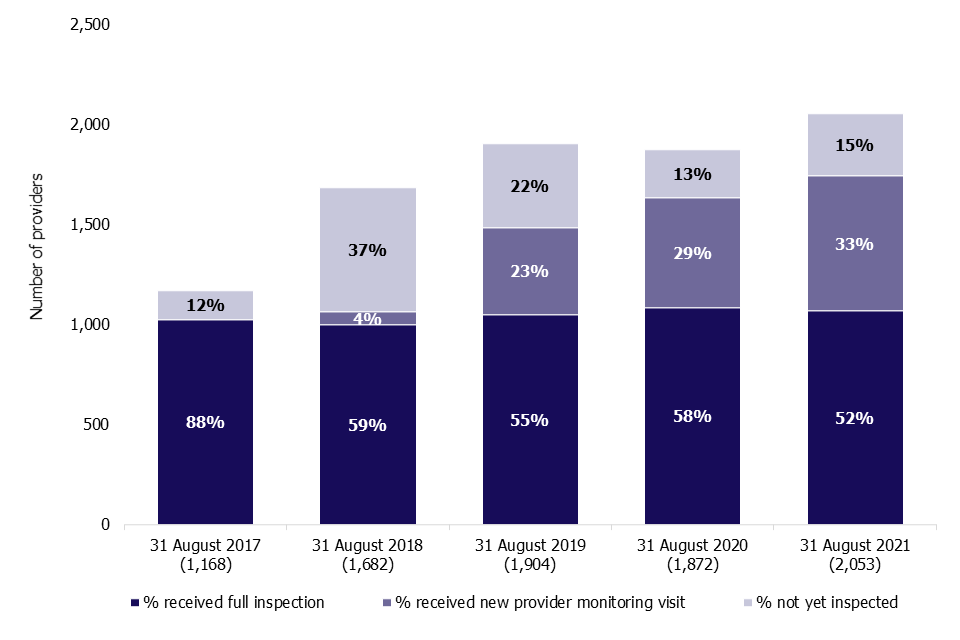
Number of providers in brackets.
Percentages are rounded and may not add to 100.
View data in an accessible table format.
In-year inspection volumes and outcomes
NPMVs accounted for almost three quarters of inspections (excluding interim and progress monitoring visits) carried out between 1 September 2020 and 31 August 2021.
In-year inspection volumes
In between the national lockdowns, we continued with our NPMVs, as these were the providers that we knew least about the quality of their provision and were therefore deemed to be the highest priority. We were able to return to full inspections of new providers from June 2021.
Between 1 September 2020 and 31 August 2021, we carried out a total of 239 NPMVs. This included 32 additional NPMVs to providers that were judged to be making insufficient progress against one or more themes at their previous NPMV and were due a full inspection. This was in place of a full inspection while routine inspection was suspended. This allowed us to reassess the providers in a timely and proportionate way and in the interests of learners. We carried out these 32 additional NPMVs between October and December 2020. The Education and Skills Funding Agency was able to take into account the outcome of the additional NPMVs when making intervention decisions. Since March 2021, we have carried out a further 207 NPMVs. This includes 8 safeguarding follow-up visits after an insufficient judgement for safeguarding was made at an NPMV.
We carried out 44 full inspections between 1 June 2021 and 31 August 2021. All of these were to independent learning providers (including employer providers) that had not previously been inspected.
In-year full inspection outcomes
Of the 44 further education and skills providers inspected in 2020/21, 4 were judged outstanding for overall effectiveness, 26 were judged good, 12 were judged requires improvement and 2 were judged inadequate.
Figure 2: Further education and skills providers’ full inspection outcomes by overall effectiveness, 2020/21
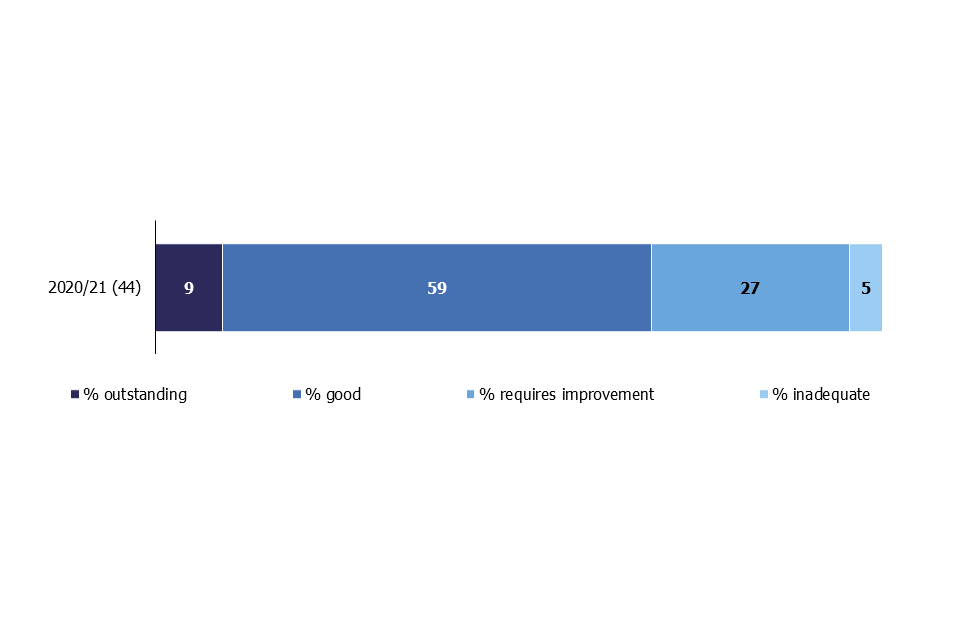
Number of inspections in brackets.
View data in an accessible table format.
In-year NPMV outcomes
Around three quarters of providers were judged to be making at least reasonable progress in all themes at their NPMV in 2020/21. This is unchanged from last year.
Of the 231 NPMVs we carried out between 1 September 2020 and 31 August 2021, just over three quarters (76%) of providers were judged to be making at least reasonable progress in all themes. This is unchanged from 2019/20. We judged 19% to be making insufficient progress in at least one theme and 5% to be making insufficient progress in all themes.
At the 8 follow-up safeguarding visits, 2 providers were judged to still be making insufficient progress in safeguarding.
Figure 3: NPMV outcomes, over time
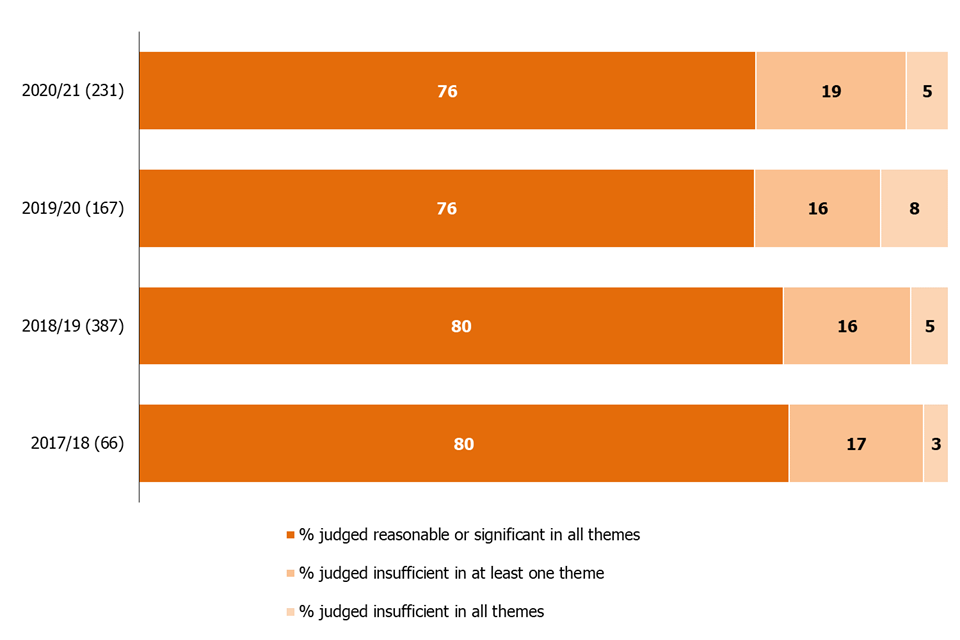
Number of NPMVs in brackets.
Based on monitoring visits carried out by 31 August each year.
Excludes follow-up safeguarding visits.
Percentages are rounded and may not add to 100.
View data in an accessible table format.
Most recent inspection outcomes
The proportion of providers judged good or outstanding at their most recent inspection has increased by 2 percentage points since 31 August 2020.
On 31 August 2021, 52% of the 2,053 further education and skills providers had received a full inspection. Of these, 83% were judged to be good or outstanding at their most recent inspection, an increase of 2 percentage points from 31 August 2020. This increase is mainly as a result of providers judged requires improvement or inadequate no longer being in scope for inspection. Usually, this is because either the provider has lost its funding to deliver public education, training and/or apprenticeships or has closed.
Figure 4: Overall effectiveness of further education and skills providers at their most recent inspection, over time
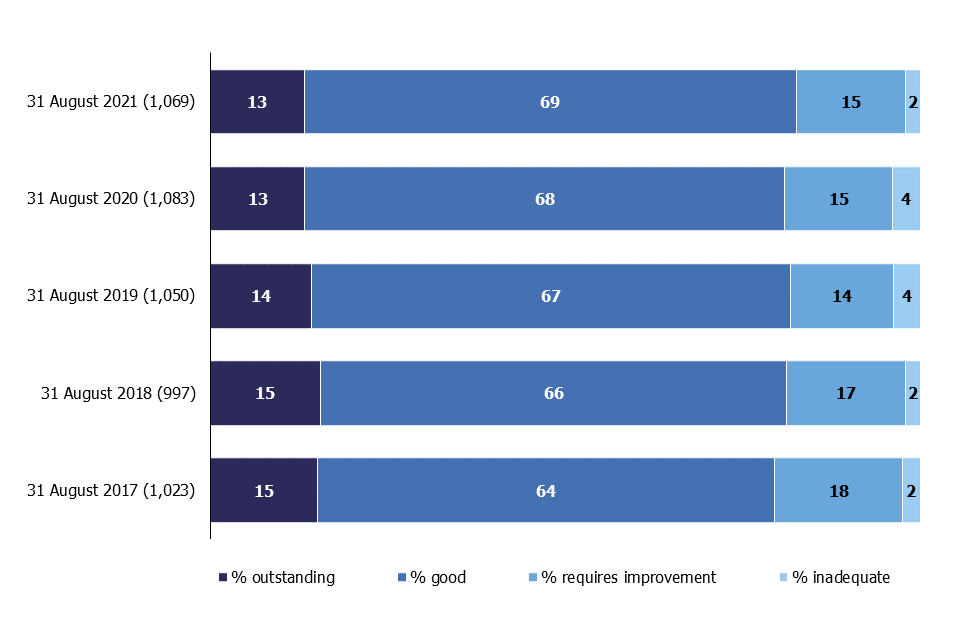
Number of providers in brackets.
Percentages are rounded and may not add to 100.
View data in an accessible table format.
Quality of apprenticeship provision
On 31 August 2021, there were 1,598 providers funded and delivering apprenticeships in Ofsted’s systems. Of these, 1,175 (74%) had a judgement made on the quality of their apprenticeship provision at the time of their full inspection or NPMV.
Figure 5: Number of providers delivering apprenticeships on 31 August 2021, by type of inspection
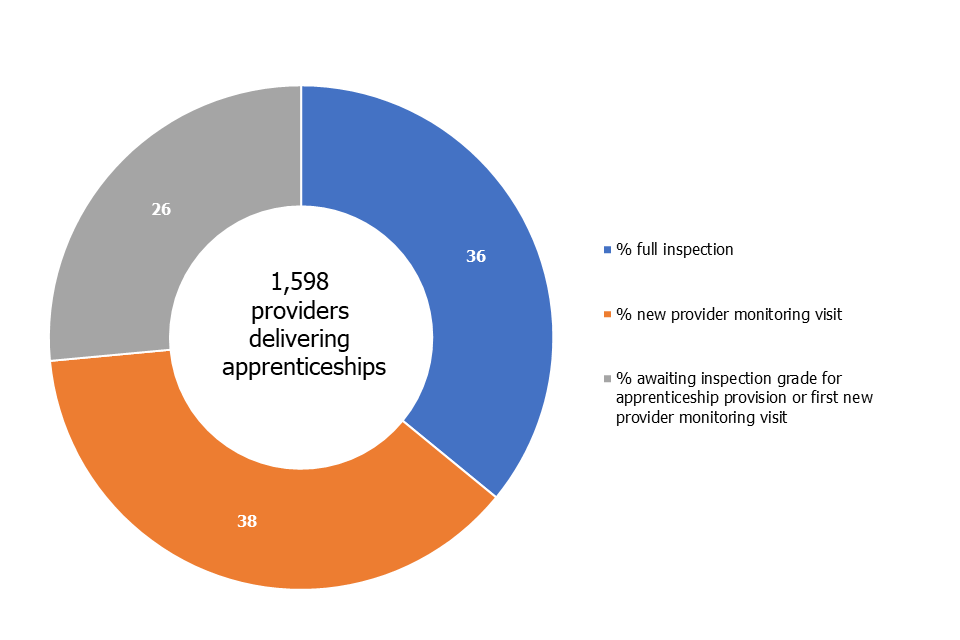
View data in an accessible table format.
Of the 1,175 providers that had a judgement made on their apprenticeship provision, 81% were judged good or outstanding at their full inspection or were judged to be making at least reasonable progress at their NPMV. This is a 2 percentage point increase from the previous year.
Figure 6: Quality of apprenticeship provision, over time
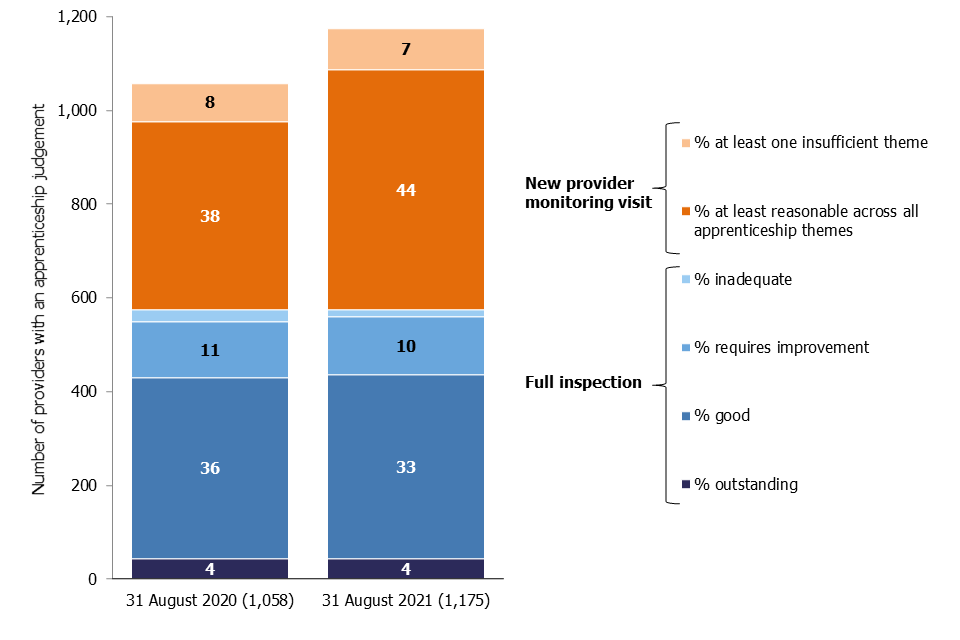
Number of providers in brackets.
View data in an accessible table format.
Notes
The quality report for these official statistics contains an explanation of the methodology used and the relevant inspection frameworks, along with other useful information.
Glossary
Definitions of terms are within the statistical glossary.
Further information
Contact for comments or feedback
If you have any comments or feedback on this publication, you should contact Richard Jones on 03000 130 608 or Richard.Jones@ofsted.gov.uk.
Acknowledgements
Thanks to the following for their contribution to this statistical release: Angela Serjeant, John Hadler, Emily Green, Kyle Drury and Alex Peace.
Annex: data tables for figures
This section contains the underlying data in an accessible table format for all figures.
Data for Figure 1: Number and proportion of further education and skills providers inspected or visited, over time
| Date as at | Total number of providers | % Not yet inspected | % Received new provider monitoring visit | % Received full inspection |
|---|---|---|---|---|
| 31 August 2021 | 2053 | 15 | 33 | 52 |
| 31 August 2020 | 1872 | 13 | 29 | 58 |
| 31 August 2019 | 1904 | 22 | 23 | 55 |
| 31 August 2018 | 1682 | 37 | 4 | 59 |
| 31 August 2017 | 1168 | 12 | 0 | 88 |
See Figure 1.
Data for Figure 2: Further education and skills providers’ full inspection outcomes by overall effectiveness, 2020 to 2021
| Reporting year | Total number of full inspection outcomes | % Outstanding | % Good | % Requires improvement | % Inadequate |
|---|---|---|---|---|---|
| 2020 to 2021 | 44 | 9 | 59 | 27 | 5 |
See Figure 2.
Data for Figure 3: NPMV outcomes, over time
| Reporting year | Total number of NPMVs | % Reasonable or significant in all themes | % Insufficient in at least one theme | % Insufficient in all themes |
|---|---|---|---|---|
| 2020 to 2021 | 231 | 76 | 19 | 5 |
| 2019 to 2020 | 167 | 76 | 16 | 8 |
| 2018 to 2019 | 387 | 80 | 16 | 5 |
| 2017 to 2018 | 66 | 80 | 17 | 3 |
See Figure 3.
Data for Figure 4: Overall effectiveness of further education and skills providers at their most recent inspection, over time
| Date as at | Total number of providers with an inspection judgement | % Outstanding | % Good | % Requires improvement | % Inadequate |
|---|---|---|---|---|---|
| 31 August 2021 | 1069 | 13 | 69 | 15 | 2 |
| 31 August 2020 | 1083 | 13 | 68 | 15 | 4 |
| 31 August 2019 | 1050 | 14 | 67 | 14 | 4 |
| 31 August 2018 | 997 | 15 | 66 | 17 | 2 |
| 31 August 2017 | 1023 | 15 | 64 | 18 | 2 |
See Figure 4.
Data for Figure 5: Number of providers delivering apprenticeships on 31 August 2021, by type of inspection
| Total number of providers delivering apprenticeships on 31 August 2021 | % Full inspection | % New provider monitoring visit | % Awaiting inspection grade for apprenticeship provision or first new provider monitoring visit |
|---|---|---|---|
| 1598 | 36 | 38 | 26 |
See Figure 5.
Data for Figure 6: Quality of apprenticeship provision, over time
| Date as at | Total number of providers with an apprenticeship judgement | Full inspection % outstanding | Full inspection % good | Full inspection % requires improvement | Full inspection % inadequate | New provider monitoring visit % at least reasonable across all apprenticeship themes | New provider monitoring visit % at least one insufficient theme |
|---|---|---|---|---|---|---|---|
| 31 August 2021 | 1175 | 4 | 33 | 10 | 1 | 44 | 7 |
| 31 August 2020 | 1058 | 4 | 36 | 11 | 2 | 38 | 8 |
See Figure 6.