Further education and skills inspections and outcomes as at 28 February 2021
Updated 27 July 2021
Applies to England

© Crown copyright 2021
This publication is licensed under the terms of the Open Government Licence v3.0 except where otherwise stated. To view this licence, visit nationalarchives.gov.uk/doc/open-government-licence/version/3 or write to the Information Policy Team, The National Archives, Kew, London TW9 4DU, or email: psi@nationalarchives.gov.uk.
Where we have identified any third party copyright information you will need to obtain permission from the copyright holders concerned.
This publication is available at https://www.gov.uk/government/statistics/further-education-and-skills-inspections-and-outcomes-as-at-28-february-2021/further-education-and-skills-inspections-and-outcomes-as-at-28-february-2021
This is the main findings report for the further education and skills inspections and outcomes as at 28 February 2021 release. The following are also available:
- underlying data, tables and charts
- methodology
- pre-release access list
Introduction
This release contains:
- provisional data for the most recent inspections and outcomes as at 28 February 2021
- provisional data for inspections and monitoring visits carried out between 1 September 2020 and 28 February 2021
- revised data for most recent inspections and outcomes as at 31 August 2020 and 31 August 2019
There continues to be fluctuation in the providers that make up the further education and skills provider base. Since 31 August 2020, we have stopped reporting on 112 providers and started reporting on an additional 116 providers.
The proportion of providers not yet inspected or visited as at 28 February 2021 was 17%. This is an increase of 4 percentage points since 31 August 2020 (see Figure 1).
The proportion of providers judged good or outstanding as at 28 February 2021 was 83%, an increase of 2 percentage points since 31 August 2020.
Impact of COVID-19 (coronavirus) on in-year inspection activity
All routine inspections were suspended in March 2020 due to COVID-19. As part of our phased return to routine inspection, we carried out 253 interim visits to further education and skills providers between October and December 2020. We have published briefing notes, commentaries from Her Majesty’s Chief Inspector (HMCI) and data about providers that we visited or communicated with during this interim phase.
Between January and March 2021, we carried out progress monitoring visits. As at 28 February, we had carried out 86 progress monitoring visits where reports were published by 31 March 2021. We published data on these progress monitoring visits in our management information – further education and skills – as at 31 March 2021.
We have not carried out any full inspections of prisons or young offender institutions between 1 September 2020 and 28 February 2021, but we have started to carry out interim visits as part of our phased return to inspection. We will report further on these inspections in our next official statistics publication.
New provider monitoring visits
As part of our phased return to routine inspections, we carried out additional new provider monitoring visits (NPMVs) to providers that were judged to be making insufficient progress against one or more themes at their previous NPMV and were due a full inspection. This was in place of a full inspection while routine inspection was suspended. This allowed us to re-assess the providers in a timely and proportionate way and in the interests of learners. We carried out 32 of these additional NPMVs between October and December 2020. The Education and Skills Funding Agency was able to take into account the outcome of the additional NPMVs when making intervention decisions.
Of these 32 NPMVs, 9 were to providers that were judged insufficient in all themes at their first NPMV. None of these providers were judged insufficient in all themes at their additional NPMV, but 2 were judged insufficient in at least one theme. The other 23 visits were to providers that were judged insufficient in at least one theme at their first NPMV. Of these, just under half (10) were again judged insufficient in at least one theme. The other 13 providers were judged to be reasonable or significant in all themes.
Table 1: Comparison of outcomes at first and additional NPMV1
| Outcome at first NPMV | Number of additional NPMV | Outcome at additional NPMV – Insufficient in all themes judged | Outcome at additional NPMV – Insufficient in at least one theme judged | Outcome at additional NPMV – Reasonable or significant in all themes judged |
|---|---|---|---|---|
| Insufficient in all themes judged | 9 | 0 | 2 | 7 |
| Insufficient in at least one theme judged | 23 | 0 | 10 | 13 |
1. Does not include follow-up safeguarding visits.
Provider numbers and most recent inspection outcomes
Provider numbers
There continues to be fluctuation in the providers that make up the further education and skills provider base.
Between 31 August 2020 and 28 February 2021, an additional 116 providers became publicly funded and started delivering education, training and/or apprenticeships. Over the same period, we stopped reporting on 112 providers because they either merged, ceased to be funded or stopped delivering. This means that, although the overall number of further education and skills providers has remained stable, there continues to be fluctuation in the provider base. On 28 February 2021, there were 1,876 further education and skills providers publicly funded and delivering education, training and/or apprenticeships recorded on Ofsted’s systems. This is 4 more than on 31 August 2020.
We are expecting further changes to the provider base due to the impact of COVID-19. Providers will remain in our statistics until we have received confirmation through the individual learning record return that all learners or apprentices have either been transferred to a new provider or completed their programme.
Of the additional 116 providers now on Ofsted’s systems, 109 are independent learning providers (including employer providers) and 4 are higher education institutions, all of which are delivering apprenticeship provision.
Similarly, of the 112 providers that we no longer report on, 105 were independent learning providers (including employer providers) and 2 were higher education providers that had been delivering apprenticeship provision. Of the 112, 40 providers (36%) started and stopped receiving funding and delivering education, training or apprenticeships before Ofsted could carry out any form of inspection. Of the 22 providers that left after receiving an NPMV, we had judged just over half (12) to be making insufficient progress in at least one theme.
The number of general further education colleges that we report on has continued to decline, which was mainly due to established colleges merging to form new entities. Since 1 September 2020, we have 3 new entities to report on, each a result of 2 established colleges merging together. In addition, one National College has closed. As at 28 February 2021, there were 164 general further education colleges recorded on Ofsted’s systems, 4 less than as at 31 August 2020.
The number of 16 to 19 academies that we report on has continued to increase while the number of sixth-form colleges has continued to decrease. Since 1 September 2020, 2 new 16 to 19 free schools opened and 2 sixth-form colleges converted to become 16 to 19 academies. As at 28 February 2021, there were 62 16 to 19 academies and 48 sixth-form colleges.
The percentage of further education and skills providers not yet inspected or visited has increased by 4 percentage points since 31 August 2020. This is due to both the suspension of routine inspection activity in March 2020 due to COVID-19 and an additional 116 providers entering Ofsted’s systems. As at 28 February 2021, 55% of further education and skills providers had received an inspection, 28% had received an NPMV (but no full inspection) and 17% had not yet been inspected or visited (see Figure 1).
Figure 1: Number and proportion of further education and skills providers inspected or visited, over time
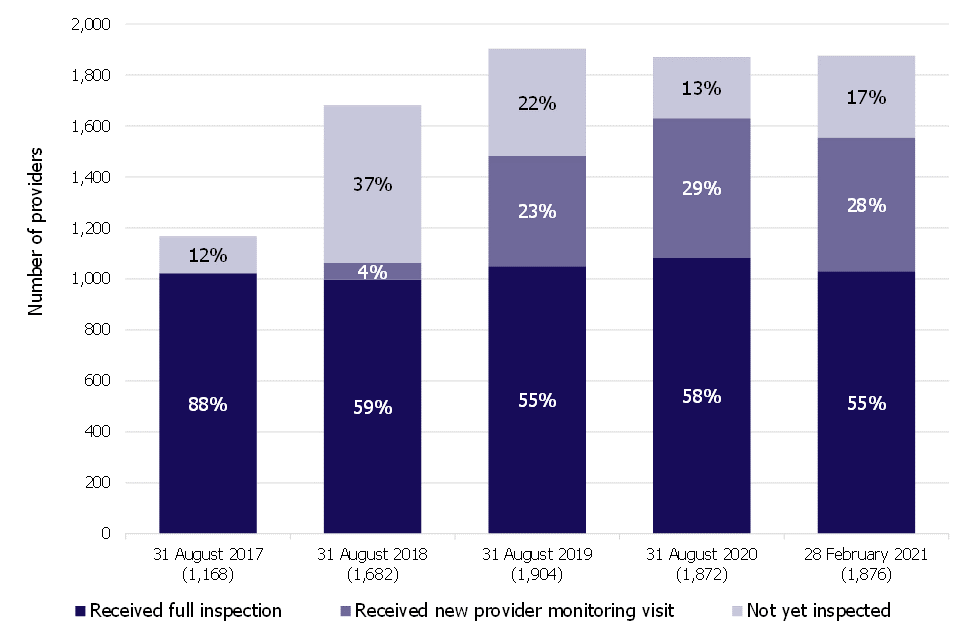
Number of providers in brackets.
Percentages are rounded and may not add to 100.
View data in an accessible table format.
Most recent inspection outcomes
The proportion of providers judged good or outstanding at their most recent inspection has increased by 2 percentage points since 31 August 2020.
Between 1 September 2020 and 28 February 2021, there were no changes to any provider’s overall effectiveness judgement and no providers received their first full inspection. However, changes to the provider base led to the overall proportion of providers judged good or outstanding for overall effectiveness to increase by 2 percentage points compared with 31 August 2020.
We had carried out a full inspection of 50 of the 112 providers that we no longer report on. Of these 50 providers, 19 were judged inadequate and 12 were judged requires improvement. Less than half (38%) were judged good or outstanding, which is 43 percentage points lower than the overall proportion of all further education and skills providers judged good or outstanding (81%) as at 31 August 2020. As a result, the proportion of providers judged good or outstanding at their most recent inspection as at 28 February 2021 increased to 83%.
Figure 2: Overall effectiveness of further education and skills providers at their most recent inspection, over time
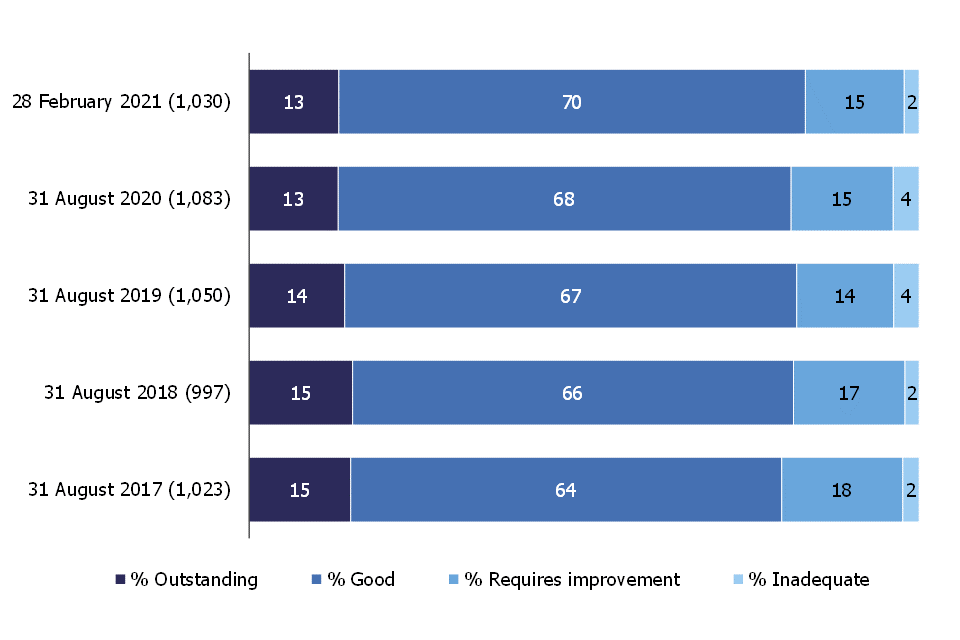
Number of providers in brackets.
Percentages are rounded and may not add to 100.
View data in an accessible table format.
Of the 50 providers that we had inspected and no longer report on, 44 were independent learning providers (including employer providers). Of these 44, less than half (36%) were judged good or outstanding for overall effectiveness at their most recent inspection. As a result, the overall proportion of independent learning providers judged good or outstanding at their most recent inspection has increased by 4 percentage points from 77% as at 31 August 2020 to 81% as at 28 February 2021.
Figure 3: Proportion of independent learning providers (including employer providers) judged good or outstanding for overall effectiveness at their most recent inspection, over time
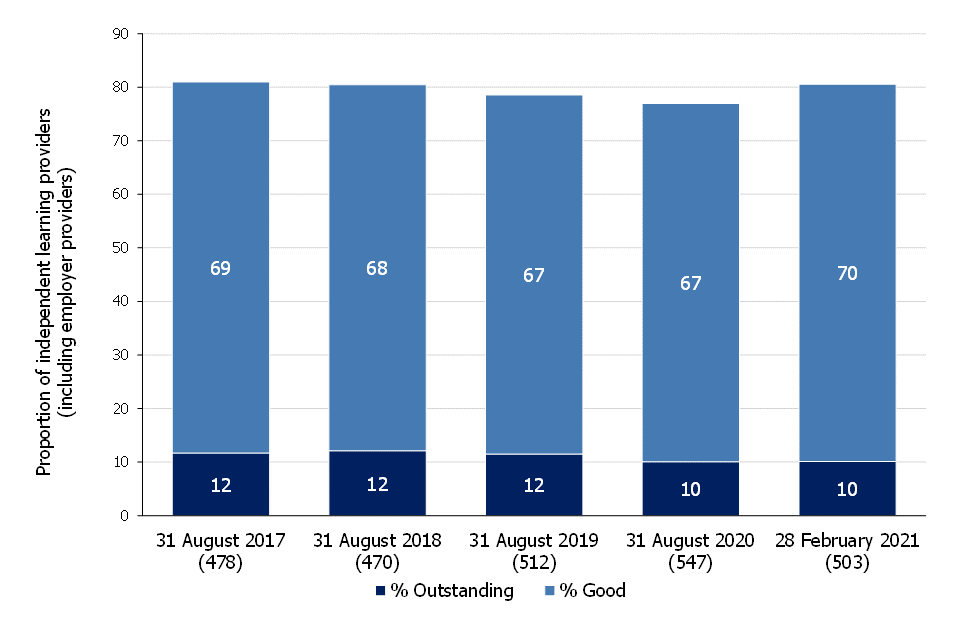
Number of providers in brackets.
Percentages are rounded and may not add to 100.
View data in an accessible table format.
Revisions to previous releases
Alongside these official statistics, we have published revised provider-level datasets for 31 August 2019 and 31 August 2020. This is because we had incorrectly recorded a dance and drama college as no longer delivering on our systems. We have now updated our systems to reflect that the provider is publicly funded and delivering. These changes do not affect the overall messages of the main findings or the tables and charts as previously reported.
We publish revisions to data in this publication in line with Ofsted’s revisions policy for official statistics.
Notes
The quality report for these official statistics contains an explanation of the methodology used and the relevant inspection frameworks, along with other useful information.
In November 2020, we published a consultation on changes to the publication of statistics on further education and skills inspections and outcomes. In our response to the consultation, we agreed to take forward our proposal to do a data cleanse to remove historical inspection data for providers that had a prolonged break in funding. We also agreed to publish a transparency dataset with our next official statistics release. The document ‘Further education and skills removed inspection data for providers with prolonged break in funding’ contains inspection history for those providers that were part of that data cleanse.
Glossary
Definitions of terms are within the statistical glossary.
Further information
Contact for comments or feedback
If you have any comments or feedback on this publication, you should contact Stuart Lloyd on 03000 131 169 or Stuart.Lloyd@ofsted.gov.uk.
Acknowledgements
Thanks to the following for their contribution to this statistical release: Angela Serjeant, John Hadler, Emily Green and Kyle Drury.
Annex: data tables for figures
This section contains the underlying data in an accessible table format for all figures.
Data for Figure 1: Number and proportion of further education and skills providers inspected or visited, over time
| Date as at | Total number of providers | % Not yet inspected | % Received new provider monitoring visit | % Received full inspection |
|---|---|---|---|---|
| 28-Feb-21 | 1876 | 17 | 28 | 55 |
| 31-Aug-20 | 1872 | 13 | 29 | 58 |
| 31-Aug-19 | 1904 | 22 | 23 | 55 |
| 31-Aug-18 | 1682 | 37 | 4 | 59 |
| 31-Aug-17 | 1168 | 12 | 0 | 88 |
See Figure 1.
Data for Figure 2: Overall effectiveness of further education and skills providers at their most recent inspection, over time
| Date as at | Total number of providers with an inspection judgement | % Outstanding | % Good | % Requires improvement | % Inadequate |
|---|---|---|---|---|---|
| 28-Feb-21 | 1030 | 13 | 70 | 15 | 2 |
| 31-Aug-20 | 1083 | 13 | 68 | 15 | 4 |
| 31-Aug-19 | 1050 | 14 | 67 | 14 | 4 |
| 31-Aug-18 | 997 | 15 | 66 | 17 | 2 |
| 31-Aug-17 | 1023 | 15 | 64 | 18 | 2 |
See Figure 2.
Data for Figure 3: Proportion of independent learning providers (including employer providers) judged good or outstanding for overall effectiveness at their most recent inspection, over time
| Date as at | Total number of independent learning providers (including employer providers) with an inspection judgement | % Outstanding | % Good |
|---|---|---|---|
| 28-Feb-21 | 503 | 10 | 70 |
| 31-Aug-20 | 547 | 10 | 67 |
| 31-Aug-19 | 512 | 12 | 67 |
| 31-Aug-18 | 470 | 12 | 68 |
| 31-Aug-17 | 478 | 12 | 69 |
See Figure 3.