Family Court Statistics Quarterly: October to December 2021
Updated 8 April 2022

© Crown copyright 2022
This publication is licensed under the terms of the Open Government Licence v3.0 except where otherwise stated. To view this licence, visit nationalarchives.gov.uk/doc/open-government-licence/version/3 or write to the Information Policy Team, The National Archives, Kew, London TW9 4DU, or email: psi@nationalarchives.gov.uk.
Where we have identified any third party copyright information you will need to obtain permission from the copyright holders concerned.
This publication is available at https://www.gov.uk/government/statistics/family-court-statistics-quarterly-october-to-december-2021/family-court-statistics-quarterly-october-to-december-2021
1. Main Points[footnote 1]
| Decrease in the number of cases started in the Family Courts | 58,762 new cases started in Family courts in October to December 2021, down 17% on the same quarter in 2020. This was due to decreases in all case types: matrimonial (25%), adoption (18%), financial remedy (13%), private law (12%), public law (7%) and domestic violence (5%) cases. Annually, there were 265,308 new cases started in Family courts throughout 2021, similar to 2020. |
| On average, care proceedings took longer with fewer disposals within 26 weeks. | The average time for a care or supervision case to reach first disposal was 47 weeks in October to December 2021 , up 5 weeks compared to the same quarter in 2020. 23% of cases were disposed of within 26 weeks - down 4 percentage points compared to the same period in 2020. The average time to first disposal throughout 2021 was 45 weeks, up 6 weeks from 2020. 23% of cases were disposed of within 26 weeks, down 8 percentage points compared to 2020. |
| Decrease in the average time for divorce proceedings | The mean average time from petition to decree nisi was 25 weeks, and decree absolute was 53 weeks - down 5 weeks and 2 weeks respectively when compared to the equivalent quarter in 2020. The median time to decree nisi and decree absolute was 11 and 28 weeks respectively. Throughout 2021 the mean time from petition to decree nisi was 25 weeks and 52 weeks to decree absolute, down 2 weeks and up 1 week compared to 2020. |
| Decrease in the number of divorce petitions, while decree absolutes increase. | There were 22,683 divorce petitions filed in October to December 2021, down 26% on the equivalent quarter in 2020. There were 25,820 decree absolutes granted in October to December 2021, an increase of 2% from the same period last year. Annually, there were 107,724 divorce petitions filed and 113,920 decree absolutes granted throughout 2021, down 5% and up 10% respectively compared to 2020. |
| Decrease in both domestic violence remedy applications and orders made. | The number of domestic violence remedy order applications decreased by 4% compared to the equivalent quarter in 2020, while the number of orders made decreased by 12% over the same period. There were 30,900 applications and 38,528 orders made throughout 2021, similar to 2020 and down 3% respectively. |
| Decrease in the number of both adoption applications and orders. | In October to December 2021 there were 1,054 adoption applications, down 11% on the equivalent quarter in 2020. Similarly, the number of adoption orders issued decreased by 13% to 970. Annually, there were 4,248 applications and 4,417 orders for adoption in 2021, similar to 2020 and up 15% respectively. |
| Increase in deprivation of liberty applications and orders made. | There were 1,687 applications relating to deprivation of liberty in October to December 2021, up 24% on the equivalent quarter in 2020. Orders were similar to the same period last year. There were 6,286 applications and 3,793 orders relating to deprivation of liberty throughout 2021, up 27% and 8% respectively. |
| Increase in the proportion of applications for probate grants and probate grants issued made digitally | In October to December 2021, there were 50,972 applications for probate grants. 49,739 probate grants were issued in the same period. 81% of these applications and 83% of these grants issued were made digitally, compared to 47% and 40% respectively in the same quarter in 2020. Annually there were 226,495 applications for probate grants and 220,040 probate grants issued in 2021, up 2% and 5% respectively from 2020. |
This publication presents statistics on activity in the family courts of England and Wales and provides figures for the latest quarter (October to December 2021). Also, the bulletin provides additional commentary on annual changes between 2020 and 2021. For further information and technical details please refer to the accompanying Guide to Family Court Statistics.
For feedback related to the content of this publication, please let us know at familycourt.statistics@justice.gov.uk
2. Statistician’s comment
Volumes of new cases starting across most Family Justice areas have been relatively stable during 2021, following recovery from the impact of Covid-19 towards the end of 2020 and early 2021, despite a seasonal dip in the last quarter of 2021. Closed cases have increased in several areas, in particular for domestic violence remedy cases, following the record levels of applications seen earlier in the pandemic.
New matrimonial cases saw the largest drop in volume at the end of 2021 – this may be driven by the new divorce law that is coming into effect from April 2022. People wishing to divorce will no longer be required to specify grounds for divorce, including being separated for several years, and it may be considered beneficial to wait until that is possible rather than start proceedings before then.
As commented on in previous editions, timeliness measures are still showing the impact of the reduced capacity during lockdown. Care and supervision proceedings continue to see an increase in the average time to a first definitive disposal. Although it’s worth noting that divorce cases saw a slight reduction in duration towards the end of 2021.
As timeliness averages are measured from the first application in a case, data for the next few quarters are likely to continue to include some cases issued before or during the early stages of the pandemic. Measures implemented during the pandemic, such as Nightingale courts and the increase in hearings by remote means, will have benefitted later cases and as such should begin to impact on timeliness measures in the next few quarters.
3. Overview of the Family Justice System
Decreases in both the number of cases started and cases disposed in Family Courts
In October to December 2021, 58,762 new cases started in family courts, down 17% on the equivalent quarter in 2020. This was due to decreases in all case types: matrimonial (25%), adoption (18%), financial remedy (13%), private law (12%), public law (7%) and domestic violence (5%) cases.
There were 59,166 case disposals in October to December 2021, down 3% on the equivalent quarter of 2020. This was due to decreases in most case types: adoption (17%), financial remedy (13%), public law (9%) and private law (4%) cases. However, there was an increase in domestic violence (6%) and matrimonial (2%) case disposals. (Table 1)
Figure 1: Cases started and disposed, by case type, January to March 2011 to October to December 2021 (Source: Table 1)
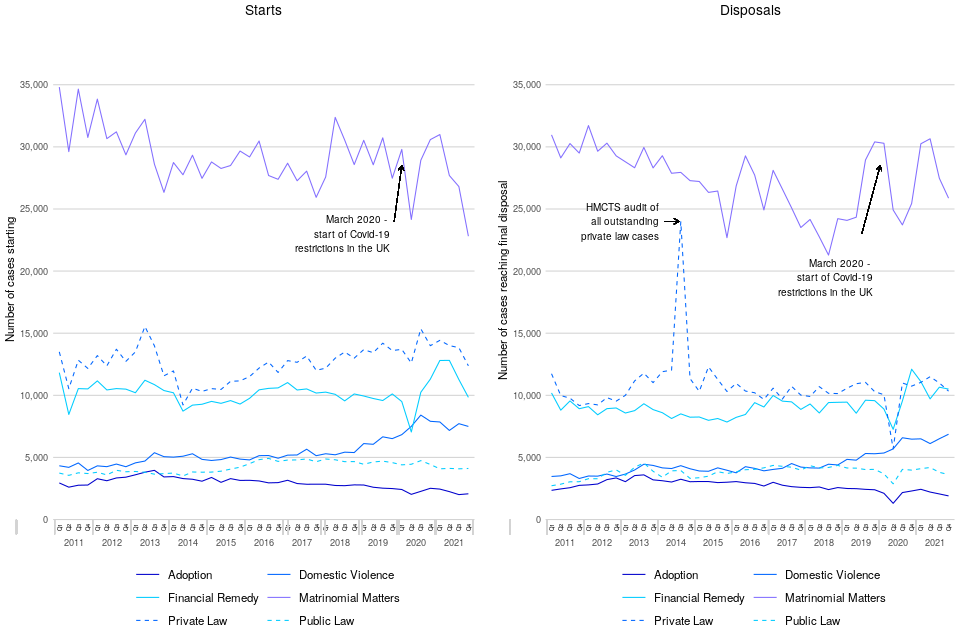
In October to December 2021, 39% of new cases within family courts related to matrimonial matters, down from the equivalent quarter of 2020 (43%).
During 2021, there were 265,308 new cases started in Family courts, similar to 2020. This was due to decreases in most case types: public law (9%), matrimonial (5%), adoption (5%), private law (2%) and domestic violence (1%) cases. However, there was an increase in financial remedy (23%) cases.By contrast, there was an increase in the number of cases disposed in 2021, up 11% from 2020 to 250,653 in total. This was due to increases in all case types: private law (17%), financial remedy (11%), matrimonial (9%), adoption (9%), domestic violence (8%) and public law (8%) cases.
Timeliness by Case Type
Average time to first disposal varies by case type – public law cases generally take the longest and in 2011, on average, they took nearly a year to reach a first disposal (49 weeks). From 2011, the average fell steadily and by 2016, almost halved to reach 26 weeks.
However, it increased in 2017 to 27 weeks. For October to December 2021 the average was 46 weeks, up from 40 weeks during the same period in 2020 (Table 10).
The average time for divorce and annulment cases to reach first disposal was down 5 weeks compared to the equivalent quarter in 2020. Private law cases took longer, with the average time to first disposal in October to December 2021 taking 28 weeks, up 6 weeks compared to the same period in 2020.
Across all of 2021, the average time for divorce and annulment cases to reach first disposal was down 2 weeks from 2020, to 25 weeks. This comes as an increasing proportion of divorce cases are dealt with digitally. By contrast, private law cases saw an increase between 2020 and 2021 of 7 weeks, taking the average to 26 weeks. Furthermore, in 2021 the average time for public law cases to first disposal was 43 weeks, up from 37 weeks in 2020.
Public and private law cases – number of parties, and High Court cases
The vast majority of private law cases involve one applicant and one respondent only (Table 6). However, for public law cases whilst nearly all cases have only one applicant, 74% involve two or more respondents.
A very small proportion of public (3%) and private (1%) law cases started were indicated as being a High Court case during October to December 2021, consistent with the long-term trend (Table 7).
HMCTS monthly management information
The statistics in this publication focus on the period between October to December 2021; however, monthly management information (MI) has been published by HMCTS that covers up to January 2022. https://www.gov.uk/government/statistical-data-sets/hmcts-management-information-january-2022. This MI is subject to the data quality issues associated with extracting data from large live administrative case management systems. Late reporting of cases and regular updating of case details, which can lead to the figures being updated to manage the case - more recent figures may therefore be subject to larger revisions and should be treated with greater care and considered provisional.
4. Children Act - Public Law
Decrease in the number of public law case starts and cases disposed
There were 4,111 public law cases starting in October to December 2021, down 7% compared to the equivalent quarter in 2020. Cases disposed were down 9% to 3,618 (Table 2).
Average time for care proceedings continues upward trend
The average time for a care and supervision case to reach first disposal was 47 weeks in October to December 2021, up 5 weeks from the same quarter in 2020 and the highest average since 2012. 23% of these care proceedings were disposed of within the 26-week limit introduced in the Children and Families Act 2014, down 4 percentage points from the same period last year (Table 8).[footnote 2]
There were 6,933 individual children involved in new public law applications in October to December 2021, down 6% on the same quarter in the previous year, while the number of applications made decreased by 9%. The number of public law disposal events decreased by 21% over the same period.
Looking at annual trends, there were 16,394 public law cases started in 2021, down 9% from 2020, whilst the number of cases disposed increased by 8% over the same period to 15,703. Applications were down 9% from 2020, with 17,340 in total involving 27,077 individual children.
The average time for a care or supervision case to reach first disposal was 45 weeks in 2021, up 6 weeks from 2020. 23% of these care proceedings were disposed of within the 26-week limit - down 8 percentage points compared to 2020.
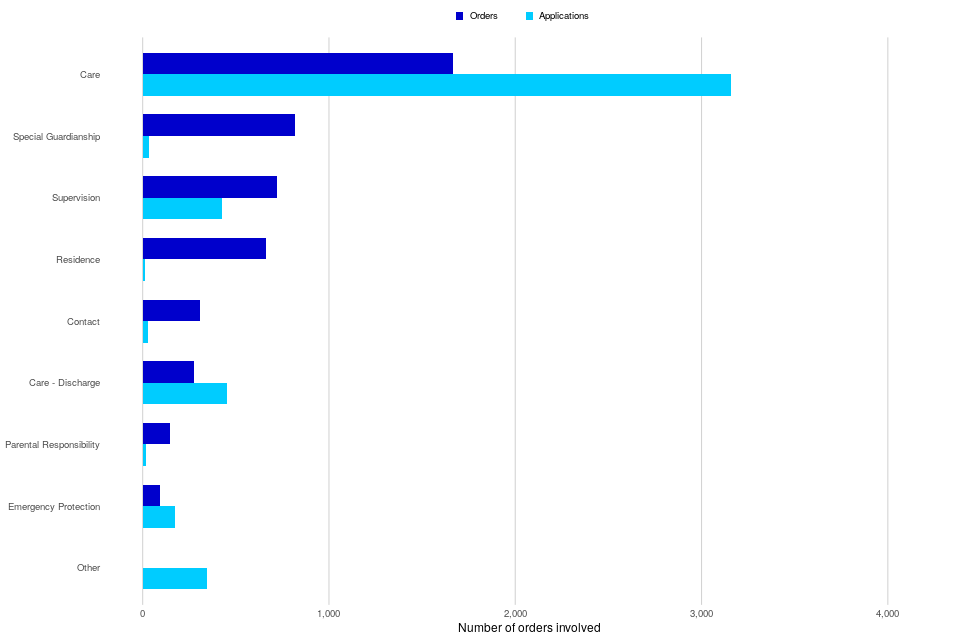
Figure 2 shows the most common types of public law orders applied for and made in October to December 2021, illustrating the different pattern between the types of orders applied for and the orders that are given, i.e. an application for one type can result in an order of a different type being made.
Figure 2: Public law applications and orders made, showing the number of orders involved for each order type, October to December 2021 (Source: Tables 3-4)
5. Children Act - Private Law
Decrease in the number of private law case starts and cases disposed
The number of private law cases[footnote 3] started decreased by 12% (to 12,374) in October to December 2021 compared to the equivalent quarter in 2020. The number of applications made decreased by 10% over the same period.
The number of private law cases disposed of during October to December 2021 was down 4% on the equivalent quarter in 2020, with the number of court disposal events down by 10% (Table 2).
There were 12,934 new private law applications made in October to December 2021, down 10% on the equivalent quarter in 2020, with 19,237 individual children involved in these applications.
The number of private law court disposal events in October to December 2021 was 18,003, down 10% on the equivalent quarter in 2020.
Annually, there were 54,638 private law cases started in 2021, down 2% from 2020, whilst the number of cases disposed increased by 17% over the same period to 43,873. In 2021 there was a 2% decrease in private law applications compared to 2020, in contrast to the general upward trend following the steep drop in 2014.
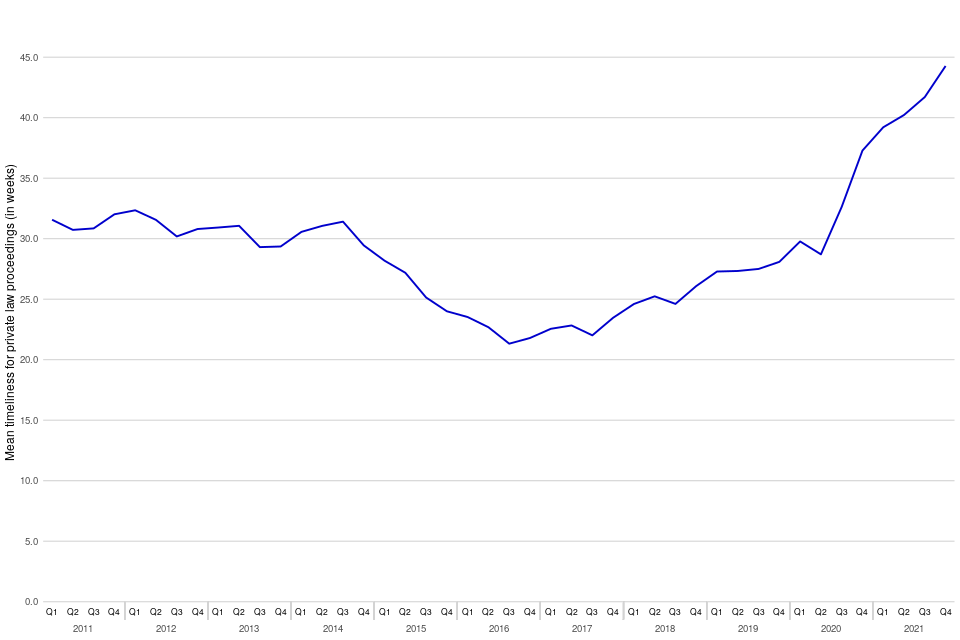
Timeliness of Private law cases
In October to December 2021, it took on average 44 weeks for private law cases to reach a final order, i.e. case closure, up 7 weeks from the same period in 2020. This continues the upward trend seen since the middle of 2016, where the number of new cases overtook the number of disposals (Table 9).
Overall, it took 41 weeks on average for private law cases to reach final order during 2021, compared to 32 weeks in 2020.
Figure 3: Private law timeliness from case start date to final order in the family court, January to March 2011 to October to December 2021 (Source: Table 9)
6. Legal Representation
Cases with legal representation take longer on average
In general, cases where either both parties or the respondent only had legal representation took longer to be disposed of than those cases where only the applicant was represented or where both parties were without legal representation (Table 10).
Legal representation in Private law cases
The removal of legal aid for many private law cases in April 2013 resulted in a change in the pattern of legal representation over time[footnote 4],[footnote 5]. In October to December 2021, the proportion of disposals where neither the applicant nor respondent had legal representation was 38%, increasing by 24 percentage points since January to March 2013, and up 1 percentage point from October to December 2020.
Correspondingly, the proportion of cases where both parties had legal representation went from 41% in January to March 2013 to 21% in October to December 2021, down 1 percentage point compared to the same period in 2020 (Figure 4).
For 2021 as a whole, neither the applicant nor the respondent were represented in 37% of cases, whilst both had legal representation in 21% of cases. Both proportions are unchanged from 2020.
Figure 4: Proportion of private law disposals by type of legal representation of the parties, January to March 2012 to October to December 2021 (Source: Table 10)
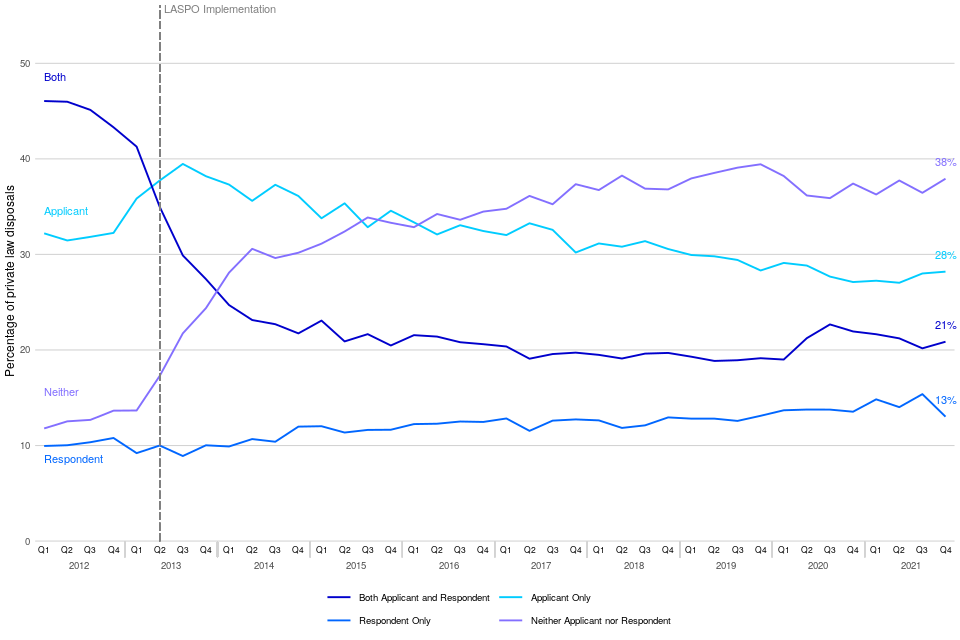
The change seen in the pattern of legal representation is also demonstrated in private law cases with at least one hearing where the proportion of parties with legal representation stood at 59% in 2012 compared to 34% in 2021.
The proportion of parties with legal representation in cases with at least one hearing varies by case type and range from around 72% for public law cases to 3% for adoption cases, with figures subject to change as new cases progress (Table 11). Across the whole of 2021 the proportions were similar to the final quarter, with a range from around 76% for public law to 3% for adoption.
7. Divorce
Decrease in the number of divorce petitions whilst number of absolutes increases
Divorce petitions were down by 26% in October to December 2021 compared to the same period in the previous year. Decree absolutes granted were up by 2% in October to December 2021 compared to the same period in 2020.
Average time for proceedings decreased
Average time from petition to decree nisi decreased to 25 weeks in October to December 2021, from 30 weeks in the same quarter of 2020 (Table 12).
There were 22,683 divorce petitions made during October to December 2021, down 26% from the same quarter in 2020. There were 25,820 decree absolutes granted in October to December 2021, up by 2% compared to the same quarter in 2020 (Table 12).
Annually, petitions were down 5% in 2021 compared to 2020 and decree absolutes were up by 10%.
Timeliness of divorce cases
For those granted decree nisi in October to December 2021, the mean average time from the date of petition was 25 weeks, down 5 weeks from the same period in 2020. The mean average time from petition to decree absolute was 53 weeks, down 2 weeks from the equivalent quarter in 2020.
Between 2020 and 2021, the average time from petition to decree nisi decreased by 2 weeks to 25 weeks, whilst the average time to decree absolute increased by 1 week to 52 weeks.
The mean timeliness figures can be inflated when historical cases reach decree nisi or decree absolute. These historical cases have less effect on the median timeliness, which may act as a better indicator for the length of current divorce proceedings. In October to December 2021, the median time to decree nisi was 11 weeks and 28 weeks to decree absolute.
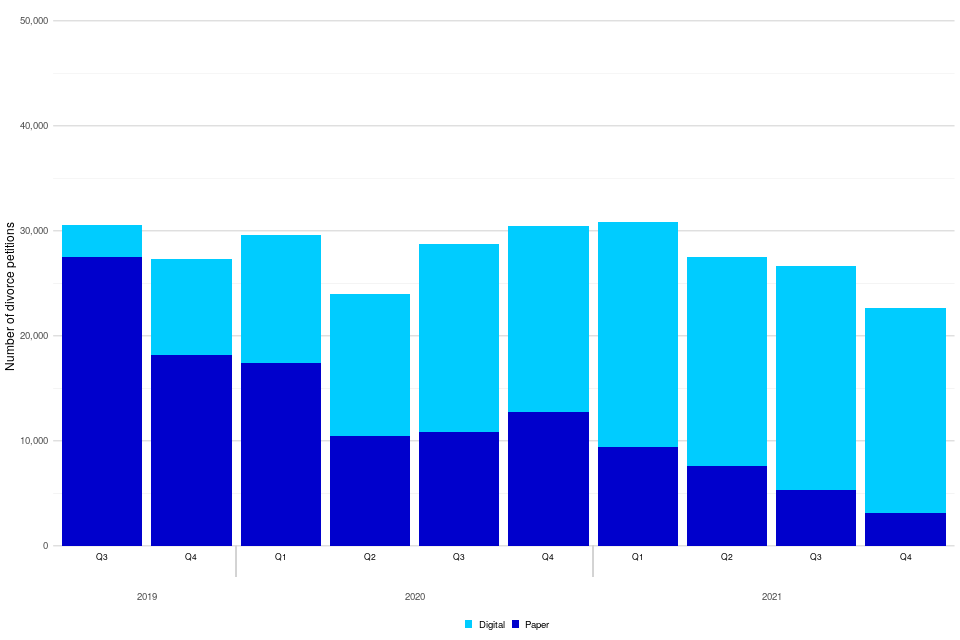
Digital divorce cases
For digital divorce cases (i.e. those dealt with the Courts and Tribunals Service Centres that are digital at all stages), there were 19,527 petitions made during October to December 2021 (86% of the total, up from 58% in the same period of 2020). The average time to decree nisi for October to December 2021 was 13 weeks, and 23 weeks from petition to decree absolute.
In 2021, digital divorce cases made up 76% of petitions compared to 54% in 2020. Digital divorce cases also accounted for 67% of decree nisis and 56% of decree absolutes, from 45% and 36% the year before. The average time to decree nisi for digital cases in 2021 was 12 weeks, 13 weeks quicker than the average for all cases. For digital cases, the average time to decree absolute was 22 weeks, 30 weeks quicker than the average for all cases.
Figure 5: Divorce petitions made between Q1 2019 to Q4 2021, by case type (Source: Table 12)
30% of divorce petitions made between Q1 2011 to Q4 2021 reached decree nisi in the first quarter after the petition was made, with a further 37% reaching this stage within the second quarter. Over half the petitions reached a decree absolute within three quarters after petition (3% in the first quarter, 31% within 1 to 2 quarters and 20% within 2 to 3 quarters) (Table 14).
8. Financial Remedy
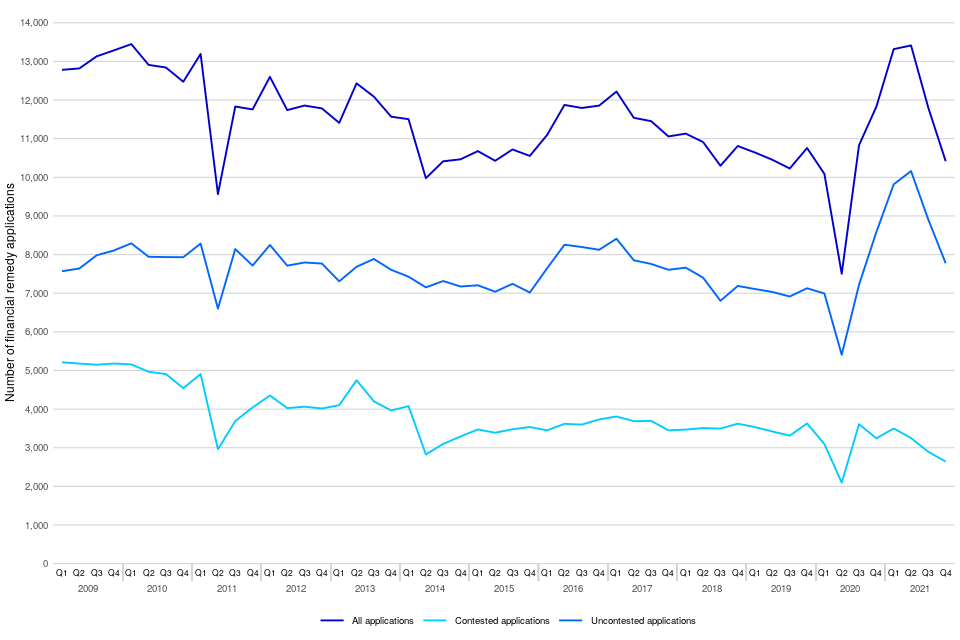
Decrease seen in financial remedy applications and disposals events
In October to December 2021, the number of financial remedy applications was down 12% and the number of disposal events was down 15% compared to the same period in 2020 (Table 15).
There were 10,417 financial remedy applications made in October to December 2021, down 12% from the same period in 2020, while there were 11,545 financial remedy disposals events, down 15%. During this period, 75% of applications were uncontested and 25% were contested.
Across 2021 as a whole, there were 48,946 financial remedy applications, up 22% from 2020. Similarly, the number of financial remedy disposals was up 1% to 46,992.
Figure 6: Applications for financial remedy orders, January to March 2009 to October to December 2021 (Source: Table 15)
9. Domestic Violence Remedy Orders
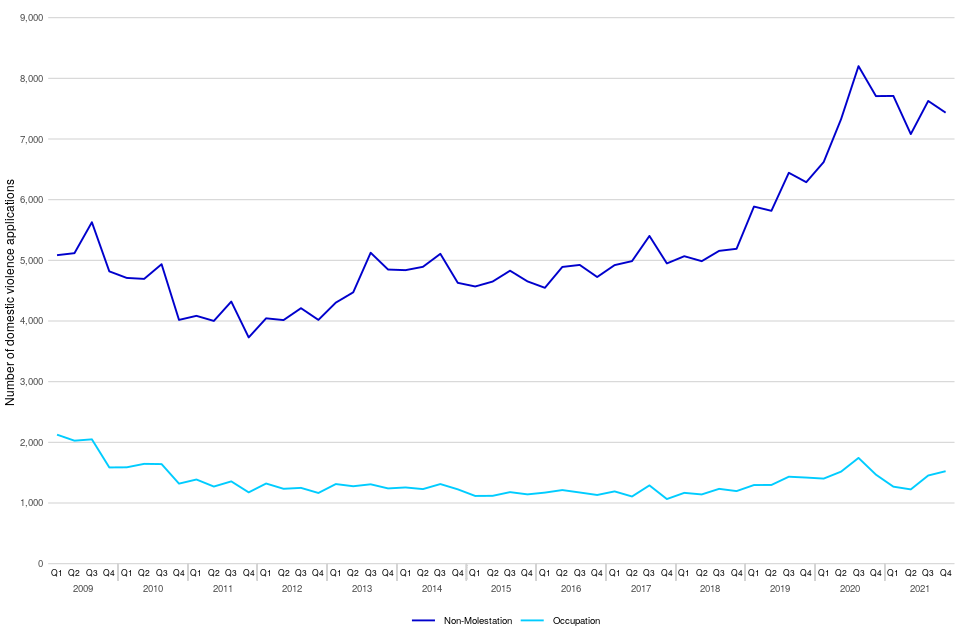
Decrease in both the number of domestic violence remedy applications and orders made
In October to December 2021, there was a 4% decrease in applications made compared to the equivalent quarter in 2020. The number of orders made decreased by 12% over the same period (Table 16).
In October to December 2021, there were 7,695 domestic violence remedy applications, down by 4% on the same quarter in 2020, requesting a total of 8,958 orders (multiple orders can be applied for in a single application). Most of the orders applied for were non-molestation orders (83%) compared to occupation orders (17%); these proportions have remained relatively consistent in recent years. Applications for non-molestation orders in October to December 2021 were down, by 4% whereas applications for occupation orders were up, by 4% respectively, compared to the same period in 2020.
There were 9,227 domestic violence orders made in October to December 2021, down 12% from the same period last year. 94% were non-molestation orders and 6% were occupation orders, with non-molestation orders down by 12% and occupation orders down by 11% compared to the equivalent quarter in 2020.
In 2021, 30,900 applications were made for domestic violence remedies, similar to 2020, requesting a total of 35,322 orders. There were 38,528 orders made, down 3% on the previous year. Non-molestation orders formed 85% of orders applied for and 94% of orders made, whilst occupation orders comprised 15% and 6% of the totals respectively.
Figure 7: Domestic violence remedy orders applied for, January to March 2009 to October to December 2021 (Source: Table 16)
10. Forced Marriage Protection Orders and Female Genital Mutilation Protection Orders
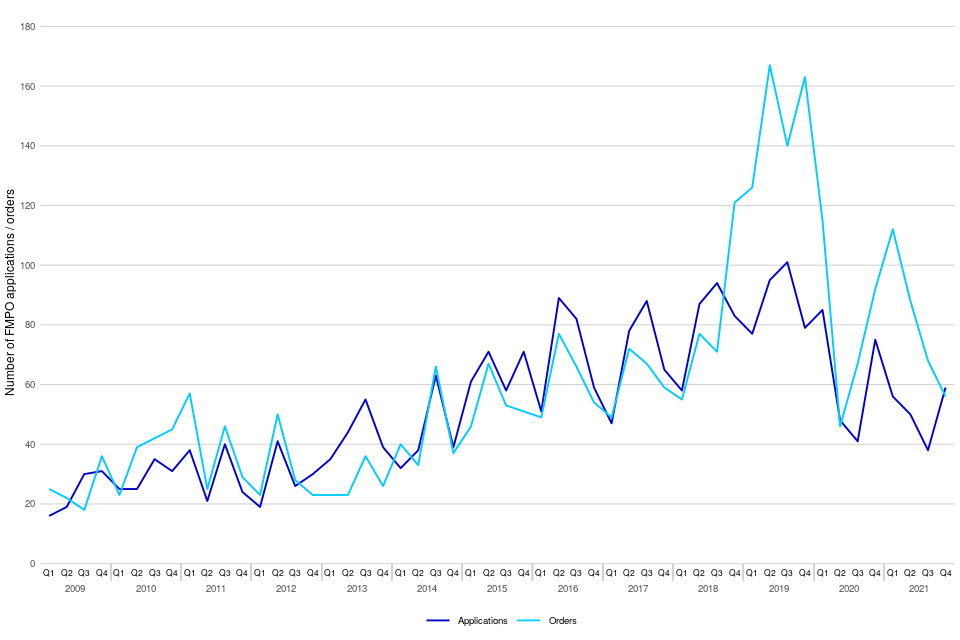
Long term upward trend in the number of forced marriage protection orders and female genital mutilation protection orders, with more recent declines (Table 17 and 18).
The number of applications and orders made for forced marriage protection orders (FMPOs) is very small. Consequently, numbers fluctuate each quarter but overall there was a long term upward trend from their introduction in November 2008 until the end of 2019.
However, this seems to have reversed during 2020. In October to December 2021, there were 59 applications, of which 63% of applications were for people aged 17 and under. Over the same period, there were 56 orders made, down 39% since the same period from the previous year.
In 2021, 203 applications were made for FMPOs, down 18% compared to 2020. There were 324 orders made, up 1% on the previous year.
Historically the numbers of orders made outweigh the number of applications. Often there are multiple orders granted per case, where one application covers more than one person, and an order is granted for each person covered in the application. Extensions and increased provision of previous orders can also be granted as new orders, without the need for a new application to be submitted.
Figure 8: Applications and orders made for Forced Marriage Protection Orders, January to March 2009 to October to December 2021 (Source: Table 17)
As with FMPOs, the number of applications and orders made for female genital mutilation protection orders (FGMPOs) is very small, with only 6 applications and 7 orders made respectively in October to December 2021 (Table 18). In total, there have been 516 applications and 737 orders made up to end of December 2021, since their introduction in July 2015.
11. Adoptions
Decrease in the number of adoption applications and orders
During October to December 2021, there were 1,054 adoption applications made, down 11% from the equivalent quarter in 2020. Over the same period, the number of adoption orders issued also decreased by 13% to 970 (Tables 19 and 20).
During 2021 there were 4,248 adoption order applications made, similar to 2020. There were 4,417 adoption orders issued in 2021, up 15% compared to 2020.
There were 2,084 applications under the Adoption and Children Act 2002, including placement orders during October to December 2021, down 18% on the same quarter in the previous year. Total disposals decreased by 18% to 1,920 over the same period. There were 8,817 applications under the Adoption and Children Act 2002 in 2021, down 5% from 2020 and continuing the downward trend seen in applications made since 2013
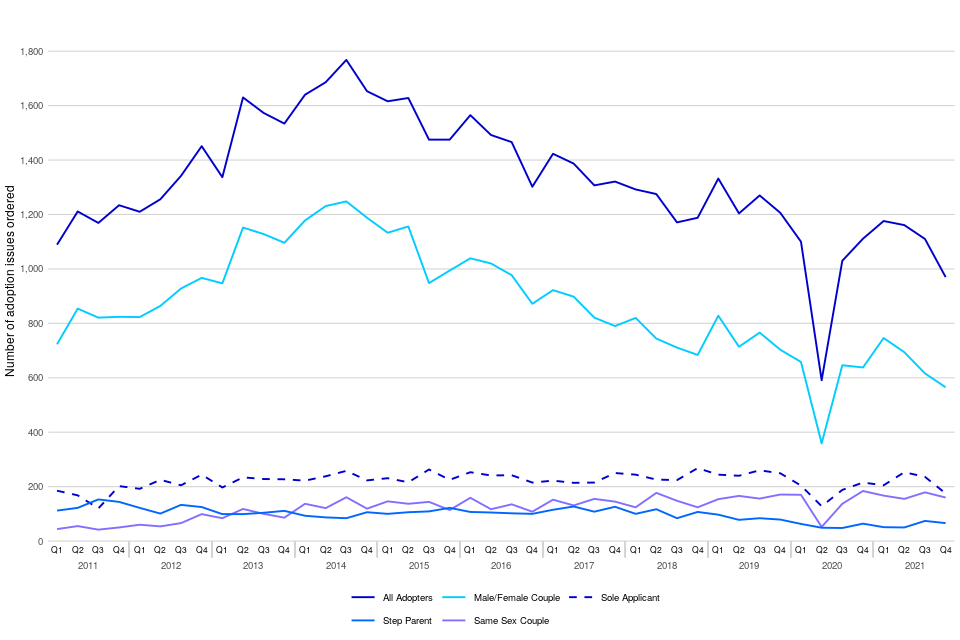
The chart below shows the trend of adoption orders by the type of adopter. This shows that during October to December 2021, 58% of all adoption orders were issued to mixed-sex couples, 18% to sole applicants, 16% to same-sex couples and 7% to step-parents.
Figure 9: Adoption orders issued, by adopter, January to March 2011 to October to December 2021 (Source: Table 20)
12. Mental Capacity Act - Court of Protection
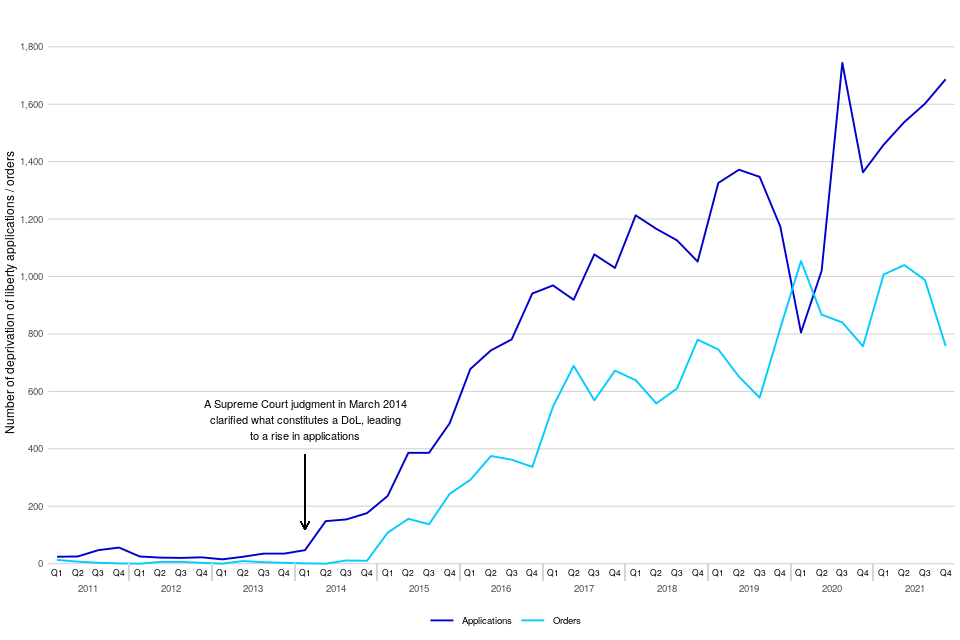
Increase in both applications and orders made in relation to deprivation of liberty
There were 1,687 applications relating to deprivation of liberty made in the most recent quarter, which is an increase of 24% on the number made in the same quarter in 2020. Orders made for deprivation of liberty were similar over the same period (758 orders).
An increase in applications whilst orders decrease under the Mental Capacity Act 2005 (MCA)
There were 9,027 applications made in October to December 2021, up by 18%. During the same period there were 11,566 orders made, down by 14%.
Since the Supreme Court clarified the definition of deprivation of liberty in 2014, there has been a significant increase in the number of applications.There were 109 in 2013 which has increased to a high of 6,286 in 2021. The total number of applications in 2021 was up 27% on the 4,932 deprivation of liberty applications in 2020. Similarly, deprivation of liberty orders also saw an increase compared to the previous year, up 8% to 3,793.
Figure 10: Deprivation of Liberty applications and orders, January to March 2008 to October to December 2021 (Source: Table 22)
In October to December 2021, there were 9,027 applications made under the Mental Capacity Act 2005 (MCA), up by 18% on the equivalent quarter in 2020 (7,677 applications). Of those, 39% related to applications for appointment of a property and affairs deputy (Table 21).
In comparison, there were 11,566 orders made under the Mental Capacity Act 2005 (MCA), down by 14% on the same quarter in 2020. Of those, 41% related to applications by an existing deputy or registered attorney (Table 22).
Applications by an existing deputy or registered attorney represented the highest proportion of orders made under the Mental Capacity Act (MCA) during 2021, totalling 41% of the 47,862 made throughout the year. The total number of orders made in 2021 was down 7% compared to 2020.
13. Mental Capacity Act - Office of the Public Guardian
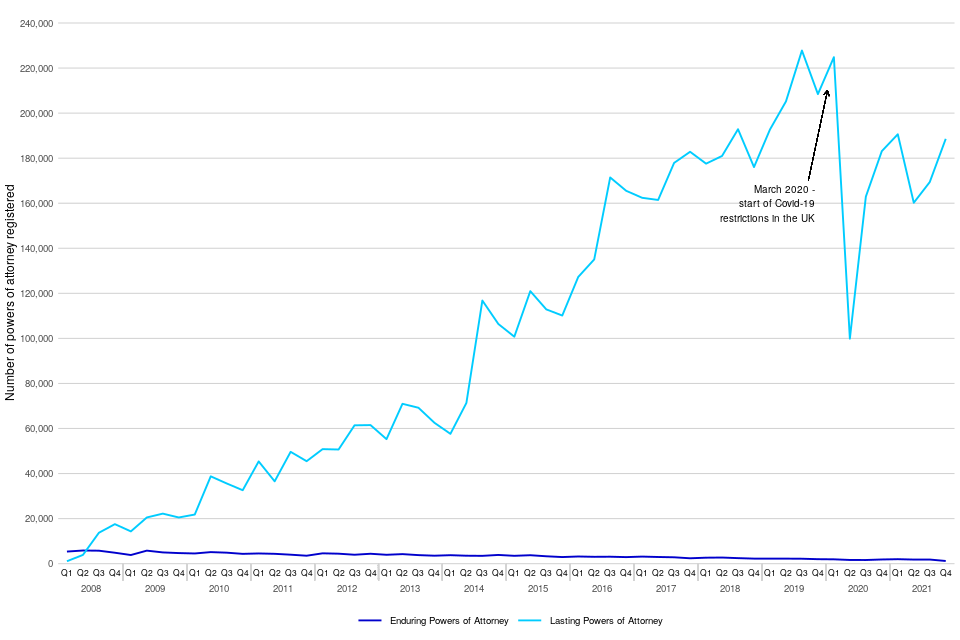
Continuing increasing trend in Lasting Powers of Attorney (LPAs)
In October to December 2021, there were 188,590 LPAs registered, up 3% compared to the equivalent quarter in 2020 (Table 23).
In total there were 189,774 Powers of Attorney (POAs) registered in October to December 2021, up 3% from the same quarter in 2020 (Table 23). Lasting Power of Attorney (LPAs) made up 99% of POAs registered in October to December 2021, with Enduring Powers of Attorney (EPAs) making up the other 1%. There were 1,184 EPAs registered in October to December 2021, down 36% on the equivalent quarter in 2020.
Annually, there were 708,824 LPAs registered in 2021, up 6% compared to the previous year. There were 6,796 EPAs in 2021, down 3% on 2020. In total, there were 715,620 Powers of Attorney in 2021, up 6% from the year before
The sharp increase in LPAs seen during 2015 and 2016 was largely due to increased publicity and the new online forms introduced in July 2015 making it simpler and faster to apply.
Figure 11: Powers of attorney registered, January to March 2008 to October to December 2021 (Source: Table 23)
14. Probate Service
Increase in both the proportion of digital applications for probate grants and probate grants issued digitally
In October to December 2021, there were 50,972 applications for probate grants. 49,739 probate grants were issued in the same period. 81% of these applications and 83% of these grants issued were made digitally, compared to 47% and 40% respectively in the same quarter in 2020 (Table 24).
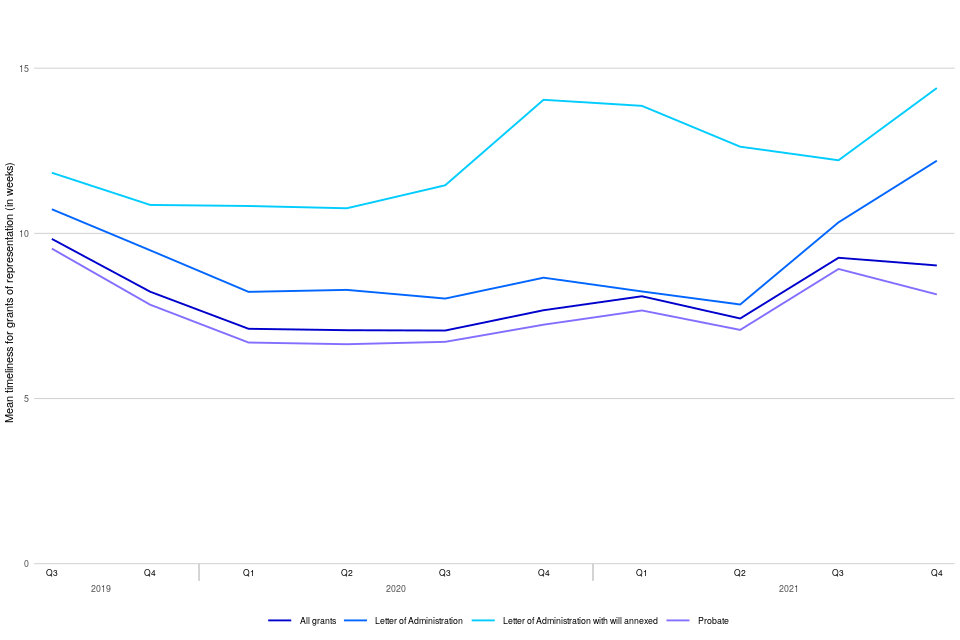
Probate grants issued more quickly than other grants of representation
Probate grants took approximately 8 weeks to be issued after the application was submitted during October to December 2021. Letters of administration with a will and without a will took around 14 and 12 weeks respectively (Table 25).
There were 63,414 applications made for grants of representation in October to December 2021. 50,972 (80%) of these were for probate grants, of which 81% were made digitally (Table 24).
Probate grants also make up the majority (81%) of all grants issued. In October to December 2021, 65% of the grants issued were applied for by legal professionals and 35% were personal applications (Table 24). For the 49,739 probate grants issued in the same period, 83% were issued digitally.
During 2021, there were 283,352 applications made for grants of representation, up 4% on 2020. There was a total of 273,422 grants of representation issued, up 7% on 2020. Probate grants made up 80% of all the grants of representation issued in 2021.
Annually, there were 266,495 applications for probate grants and 220,040 probate grants issued in 2021 up 2% and 5% respectively from 2020.
Timeliness of probate grants
The average time from application submission to grant issue for probate grants was 8 weeks (median average 5 weeks) overall. Averages for letters of administration with a will and without a will were 14 and 12 weeks respectively for October to December 2021 (Table 25).
Timeliness of grants issued can be affected if the case has been ‘stopped’ for any reason (which can occur when there’s a dispute about either who can apply for probate or issues with a will or proposed will, or if an error is identified and a request for further information made). Probate grants that were stopped during October to December 2021 took 17 weeks on average to be issued, compared to 5 weeks for those that were not stopped.
When looking at the time from document receipt (i.e. when payment has been made and the application and all accompanying documents are ready for examination) to grant issue, this is around 1 week quicker than the average time from application submission for probate grants.
Figure 12: Average (mean) time for grants of representation issued from application submission by the Probate Service, July to September 2019 to October to December 2021 (Source: Table 25)[footnote 6]
When a probate case is contested, the Chancery Division of the High Court deals with the matter. In 2021 there were 104 contested probate cases, up from 68 cases in 2020.
15. Further information
The data presented in this publication are from live administrative databases. Therefore, previously published data is liable to be updated in the latest bulletin, following any further data cleaning or the incorporation of additional cases not available in the extracts used to produce previous bulletins.
Accompanying files
As well as this bulletin, the following products are published as part of this release:
-
A technical guide providing further information on how the data is collected and processed, as well as information on the revisions policy and legislation relevant to family court and background on the functioning of the family justice system
-
A set of overview tables and CSV files, covering each section of this bulletin
National Statistics status
National Statistics status means that official statistics meet the highest standards of trustworthiness, quality and public value.
All official statistics should comply with all aspects of the Code of Practice for Official Statistics. They are awarded National Statistics status following an assessment by the Authority’s regulatory arm. The Authority considers whether the statistics meet the highest standards of Code compliance, including the value they add to public decisions and debate.
It is the Ministry of Justice’s responsibility to maintain compliance with the standards expected for National Statistics. If we become concerned about whether these statistics are still meeting the appropriate standards, we will discuss any concerns with the Authority promptly. National Statistics status can be removed at any point when the highest standards are not maintained, and reinstated when standards are restored.
Contact
Press enquiries should be directed to the Ministry of Justice press office:
Tel: 0203 334 3536 Email: newsdesk@justice.gsi.gov.uk
Other enquiries about these statistics should be directed to the Data and Evidence as a Service division of the Ministry of Justice:
Carly Gray, Head of Access to Justice Data and Statistics, using the following email address familycourt.statistics@justice.gov.uk
Next update: 30 June 2022
URL: https://www.gov.uk/government/collections/family-court-statistics-quarterly
© Crown copyright Produced by the Ministry of Justice
Alternative formats are available on request from ESD@justice.gov.uk
-
To note, the arrows that indicate the direction of travel refer to the quarterly trends. Annual trends are shaded grey ↩
-
See the accompanying technical guide for more information. ↩
-
The Children and Family Court Advisory and Support Service (Cafcass) also publishes (England only) data on the number of private law cases. A comparison of Cafcass and MoJ data and further information can be found in the accompanying guide. ↩
-
Please see the accompanying guide for further details. ↩
-
Removal of Legal Aid was a result of the Legal Aid, Sentencing & Punishment of Offenders Act 2012 (LASPO). ↩
-
Due to quality issues in the transition between data systems, the breakdown by type of grants of representation for Q2 2019 were rounded estimates only, with the average distribution across 2016 to 2018 applied to the known total. These estimates then feed into the total for 2019. ↩