Family Court Statistics Quarterly: October to December 2020
Published 25 March 2021

© Crown copyright 2021
This publication is licensed under the terms of the Open Government Licence v3.0 except where otherwise stated. To view this licence, visit nationalarchives.gov.uk/doc/open-government-licence/version/3 or write to the Information Policy Team, The National Archives, Kew, London TW9 4DU, or email: psi@nationalarchives.gov.uk.
Where we have identified any third party copyright information you will need to obtain permission from the copyright holders concerned.
This publication is available at https://www.gov.uk/government/statistics/family-court-statistics-quarterly-october-to-december-2020/family-court-statistics-quarterly-october-to-december-2020
1. Main Points[footnote 1]
| Increase in the number of cases started in the Family Courts | 68,634 new cases started in Family courts in October to December 2020, up 6% on the same quarter in 2019. This was due to increases in most case types: domestic violence (21%), financial remedy (8%), matrimonial (5%) and private law (3%) cases. However, there was a decrease in public law (3%) case starts. Annually, there were 264,091 new cases started in Family courts throughout 2020, similar to 2019. |
| On average, care proceedings took longer with fewer disposals within 26 weeks. | The average time for a care or supervision case to reach first disposal was 41 weeks in October to December 2020 , up 8 weeks from the same quarter in 2019. 27% of cases were disposed of within 26 weeks - down 13 percentage points compared to the same period in 2019 . The average time to first disposal throughout 2020 was 38 weeks, up 5 weeks from 2019. 31% of cases were disposed of within 26 weeks, down 10 percentage points from 2019. |
| Increase in the average time for divorce proceedings | The mean average time from petition to decree nisi was 30 weeks, and decree absolute was 56 weeks - up 2 weeks and 4 weeks respectively when compared to the equivalent quarter in 2019. The median time to decree nisi and decree absolute was 20 and 39 weeks respectively. Throughout 2020 the mean time from petition to decree nisi was 28 weeks and 53 weeks to decree absolute, each down 3 weeks respectively. |
| Increase in the number of divorce petitions, while decree absolutes decrease. | There were 28,672 divorce petitions filed in October to December 2020, up 5% on the equivalent quarter in 2019. There were 23,810 decree absolutes granted in October to December 2020, a decrease of 24% from the same period last year. Annually, there were 111,996 divorce petitions filed and 97,068 decree absolutes granted throughout 2020, down 4% and 11% respectively from 2019. |
| Increase in both domestic violence remedy applications and orders made. | The number of domestic violence remedy order applications increased by 19% compared to the equivalent quarter in 2019, while the number of orders made increased by 20% over the same period. There were 35,984 applications and 39,427 orders made throughout 2020, up 20% and up 17% respectively from 2019. |
| Decrease in the number of both adoption applications and orders. | In October to December 2020 there were 1,180 adoption applications, down 4% on the equivalent quarter in 2019. Similarly, the number of adoption orders issued decreased by 8% to 1,106. Annually, there were 4,229 applications and 3,826 orders for adoption in 2020, down 15% and 24% respectively from 2019. |
| Increase in the deprivation of liberty applications and decrease in the orders made. | There were 1,363 applications relating to deprivation of liberty in October to December 2020, up 16% on the equivalent quarter in 2019. Orders decreased by 8% in the latest quarter compared to the same period last year. There were 4,932 applications and 3,518 orders relating to deprivation of liberty throughout 2020, down 5% and up 26% respectively. |
| Increase in the proportion of applications for probate grants and probate grants issued made digitally | In October to December 2020, there were 55,135 applications for probate grants. 54,476 probate grants were issued in the same period. 46% of these applications and 40% of these grants issued were made digitally, compared to 19% and 20% respectively in the same quarter in 2019. |
This publication presents statistics on activity in the family courts of England and Wales and provides figures for the latest quarter (October to December 2020). Also, the bulletin provides additional commentary on annual changes between 2019 and 2020. This quarter’s Family Court Statistics publication does not include a digital/paper split for divorce volumes and timeliness (table 12) due to issues identified with a key data item recorded following migration to a new operations system. In line with the Code of Practice for Statistics, the Chief Statistician and Head of Profession has decided to withdraw the affected time series this quarter until the investigations are complete and revised data can be compiled and quality assured.
For further information and technical details please refer to the accompanying Guide to Family Court Statistics.
For feedback related to the content of this publication, please let us know at familycourt.statistics@justice.gov.uk
2. Statistician’s comment
The impact of Covid-19 continues to be seen across family court activity this quarter, with noticeable recovery as work levels return to pre-lockdown levels (seen in the number of new cases started and disposed across most areas since the first lockdown period). The negative impacts on timeliness measures continue, with work progressing to address the impact to the family justice system.
Domestic violence remedy levels remain high, with substantial increases in both new cases starting and cases with a final disposal – up 21% and 38% respectively compared to quarter 4 2019. Also, care proceedings now take the longest time since mid-2013.
It may be some time until improvements as a result of recovery measures taken begin to show, particularly relating to timeliness measures as outstanding cases are dealt with. Nightingale courts continue to be used to help cope with demand and help the court system to run as effectively and safely as possible during the coronavirus outbreak.
While these statistics are believed to be of interest to the public, please note that the reduced volumes of disposed cases in several areas mean that the data is unlikely to be representative of general trends in family justice. Caution should therefore be used when interpreting and applying these figures.
3. Overview of the Family Justice System
Increase in the number of cases started in Family Courts and decrease in the number of cases disposed
In October to December 2020, 68,634 new cases started in family courts, up 6% on the equivalent quarter in 2019. This was due to increases in most case types: domestic violence (21%), financial remedy (8%), matrimonial (5%) and private law (3%) cases. However, there was a decrease in public law (3%) case starts.
There were 59,286 case disposals in October to December 2020, down 6% on the equivalent quarter of 2019. This was due to decreases in matrimonial (24%), adoption (10%) and public law (1%) cases. However, there was an increase in domestic violence (38%), financial remedy (18%) and private law (4%) case disposals. (Table 1)
Figure 1: Cases started and disposed, by case type, January to March 2011 to October to December 2020 (Source: Table 1)
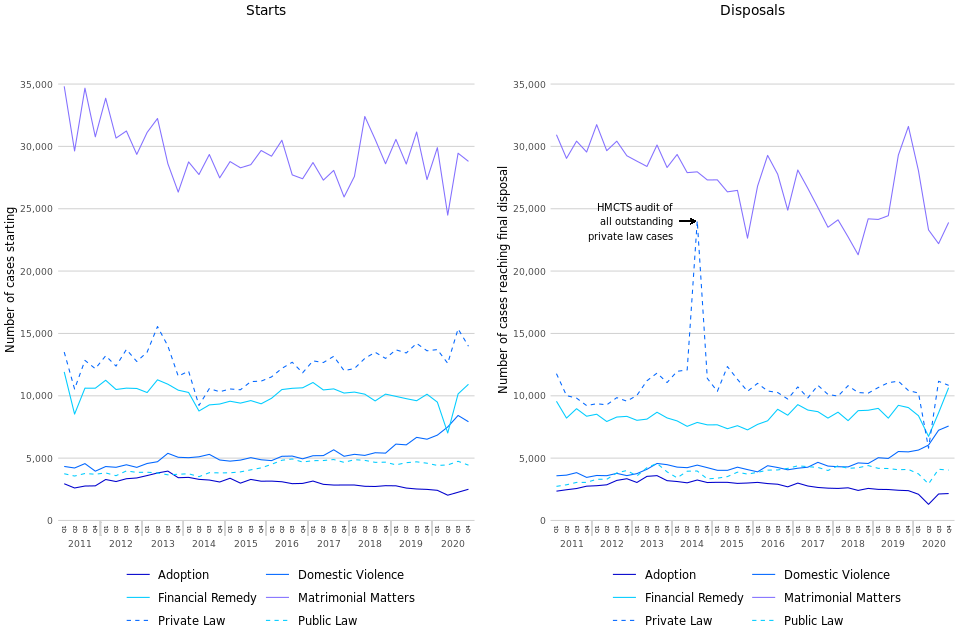
Figure 1: Cases started and disposed, by case type, January to March 2011 to October to December 2020 (Source: Table 1)
In October to December 2020, 42% of new cases within family courts related to matrimonial matters, the same proportion as the equivalent quarter of 2019.
During 2020, there were 264,091 new cases started in Family courts, similar to 2019. This was due to decreases in most case types: adoption (11%), financial remedy (5%), matrimonial (4%) and public law (2%) cases. However, there was an increase in domestic violence (21%) and private law (1%) cases.
There was a larger decrease in the number of cases disposed in 2020, down 7% from 2019 to 219,213 in total. This was due to decreases in most case types: adoption (22%), private law (12%), matrimonial (11%), public law (10%) and financial remedy (3%) cases. However, there was an increase in domestic violence (26%) cases.
Timeliness by Case Type
Average time to first disposal varies by case type – public law cases generally take the longest and in 2011, on average, they took nearly a year to reach a first disposal (49 weeks). From 2011, the average fell steadily and by 2016, almost halved to reach 26 weeks.
However, it increased in 2017 to 27 weeks. For October to December 2020 the average was 40 weeks, up from 33 weeks during the same period in 2019 (Table 10).
The average time for divorce and annulment cases to reach first disposal was up 2 weeks compared to the equivalent quarter in 2019. Private law cases also took longer, with the average time to first disposal in October to December 2020 taking 22 weeks, up 6 weeks compared to the same period in 2019.
Across all of 2020, the average time for divorce and annulment cases to reach first disposal was down 3 weeks from 2019, to 28 weeks. This comes as an increasing proportion of divorce cases are dealt with digitally (but note that the digital/paper split is not presented in this edition while we investigate some data issues). By contrast, private law cases saw an increase between 2019 and 2020 of 3 weeks, taking the average to 19 weeks. Furthermore, in 2020 the average time for public law cases to first disposal was 37 weeks, up from 32 weeks in 2019.
Public and private law cases – number of parties, and High Court cases
The vast majority of private law cases involve one applicant and one respondent only (Table 6). However, for public law cases whilst nearly all cases have only one applicant, 74% involve two or more respondents.
A very small proportion of public (2%) and private (1%) law cases started were indicated as being a High Court case during October to December 2020, consistent with the long-term trend (Table 7).
3.1 HMCTS weekly management information during coronavirus, January 2021 – summary
The statistics in this publication focus on the period between October to December 2020; however, weekly management information (MI) has been published by HMCTS up to the week ending 24th January 2021 https://www.gov.uk/government/statistical-data-sets/hmcts-weekly-management-information-during-coronavirus-march-2020-to-january-2021-2020. This MI is subject to the data quality issues associated with extracting data from large live administrative case management systems. Late reporting of cases and regular updating of case details, which can lead to the figures being updated to manage the case - more recent weekly figures are therefore subject to larger revisions and should be treated with greater care and considered provisional.
Taking an average over the three weeks ending 24th January in order to assess the most recent impact of the lockdown period, the MI shows that there were 24% fewer public law receipts throughout the period when compared to the pre-covid-19 baseline (based on an average across the six months September 2019 to February 2020). Public law disposals remained similar to the pre-covid-19 baseline. Private law receipts were 10% lower than the baseline, whilst disposals were higher in January.
Receipts for divorce remain higher than the pre-covid baseline on average for January; after a decrease in December, related disposals are now substantially above the baseline (with an average of 38% more decree nisis than the baseline).
The number of probate applications received has returned above the baseline for January, after a decrease towards the end of 2020, and the number of grants issued is now also above the baseline.
4. Children Act - Public Law
Decrease in the number of public law case starts and cases disposed
There were 4,437 public law cases starting in October to December 2020, down 3% compared to the equivalent quarter in 2019. Cases disposed were down 1% to 4,040 (Table 2).
Average time for care proceedings continues upward trend
The average time for a care and supervision case to reach first disposal was 41 weeks in October to December 2020, up 8 weeks from the same quarter in 2019 and the highest average since mid-2013. 27% of these care proceedings were disposed of within the 26-week limit introduced in the Children and Families Act 2014, down 13 percentage points from the same period last year (Table 8).[footnote 2]
There were 7,394 individual children involved in new public law applications in October to December 2020, down 4% on the same quarter in the previous year, while the number of application events decreased by 4%. The number of public law disposal events decreased by 7% over the same period.
Looking at annual trends, there were 18,051 public law cases started in 2020, down 2% from 2019, whilst the number of cases disposed decreased by 10% over the same period to 14,816. Applications were down 2% from 2019, with 19,099 in total involving 29,674 individual children.
The average time for a care or supervision case to reach first disposal was 38 weeks in 2020, up 5 weeks from 2019. 31% of these care proceedings were disposed of within the 26-week limit - down 10 percentage points compared to 2019.
Figure 2 shows the most common types of public law orders applied for and made in October to December 2020, illustrating the different pattern between the types of orders applied for and the orders that are given, i.e. an application for one type can result in an order of a different type being made.
Figure 2: Public law applications and orders made, showing the number of children involved in each order type, October to December 2020 (Source: Tables 3-4)
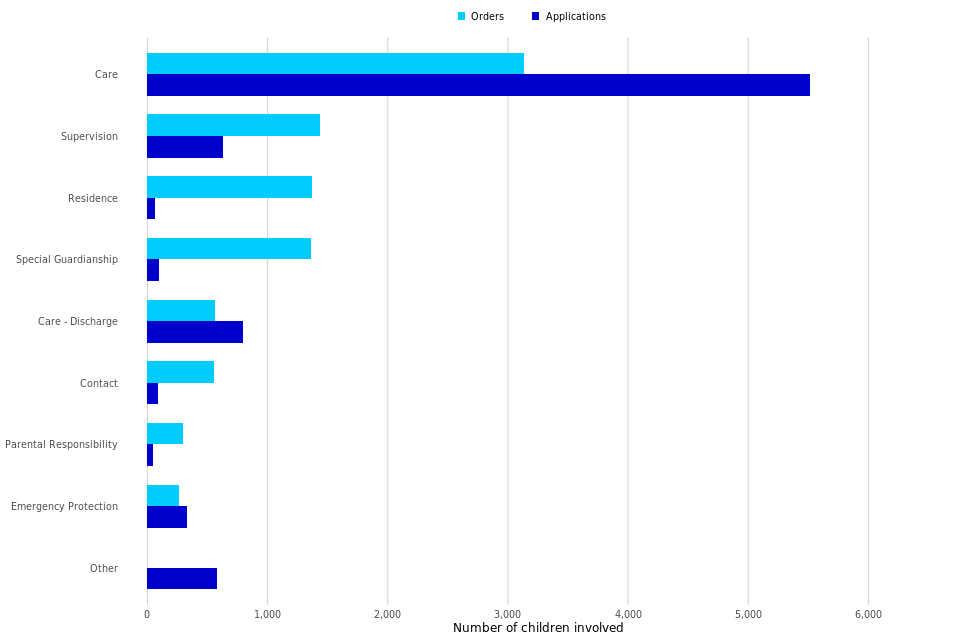
Figure 2: Public law applications and orders made, showing the number of children involved in each order type, October to December 2020 (Source: Tables 3-4)
5. Children Act - Private Law
Increase in the number of private law case starts and cases disposed
The number of private law cases[footnote 3] started increased by 3% (to 13,973) in October to December 2020 compared to the equivalent quarter in 2019. The number of application events increased by 3% over the same period.
The number of private law cases disposed of during October to December 2020 was up 4% on the equivalent quarter in 2019, with the number of court disposal events down by 10% (Table 2).
There were 14,425 new private law application events in October to December 2020, up 3% on the equivalent quarter in 2019, with 21,523 individual children involved in these application events.
The number of private law court disposal events in October to December 2020 was 19,226, down 10% on the equivalent quarter in 2019.
Annually, there were 55,645 private law cases started in 2020, up 1% from 2019, whilst the number of cases disposed decreased by 12% over the same period to 38,016. In 2020 there was a 2% increase in private law applications compared to 2019, continuing the upward trend seen since the steep drop in 2014.
Timeliness of Private law cases
In October to December 2020, it took on average 39 weeks for private law cases to reach a final order, i.e. case closure, up 11 weeks from the same period in 2019. This continues the upward trend seen since the middle of 2016, where the number of new cases overtook the number of disposals (Table 9).
Overall, it took 33 weeks on average for private law cases to reach final order during 2020, compared to 28 weeks in 2019.
Figure 3: Private law timeliness from case start date to final order in the family court, January to March 2011 to October to December 2020 (Source: Table 9)
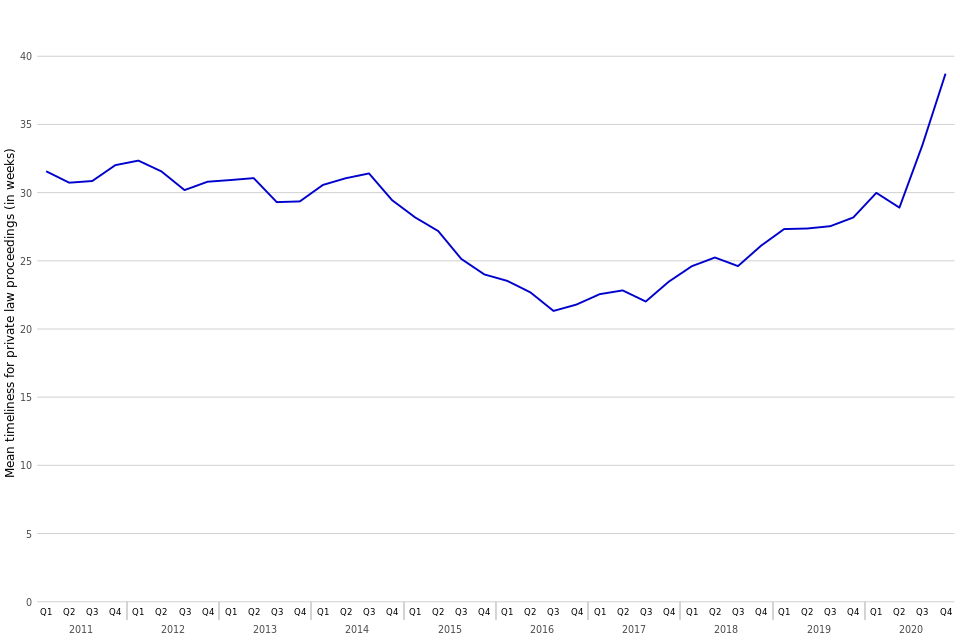
Figure 3: Private law timeliness from case start date to final order in the family court, January to March 2011 to October to December 2020 (Source: Table 9)
6. Legal Representation
Cases with legal representation take longer on average
In general, cases where either both parties or the respondent only had legal representation took longer to be disposed of than those cases where only the applicant was represented or where both parties were without legal representation (Table 10).
Legal representation in private law cases
The removal of legal aid for many private law cases in April 2013 resulted in a change in the pattern of legal representation over time[footnote 4],[footnote 5]. In October to December 2020, the proportion of disposals where neither the applicant nor respondent had legal representation was 38%, increasing by 24 percentage points since January to March 2013, and down 1 percentage point from October to December 2019.
Correspondingly, the proportion of cases where both parties had legal representation went from 41% in January to March 2013 to 21% in October to December 2020, up 1 percentage point compared to the same period in 2019 (Figure 4).
For 2020 as a whole, neither the applicant nor the respondent were represented in 38% of cases, whilst both had legal representation in 25% of cases. These were up and down 2 percentage points respectively compared to 2019.
Figure 4: Proportion of private law disposals by type of legal representation of the parties, January to March 2012 to October to December 2020 (Source: Table 10)
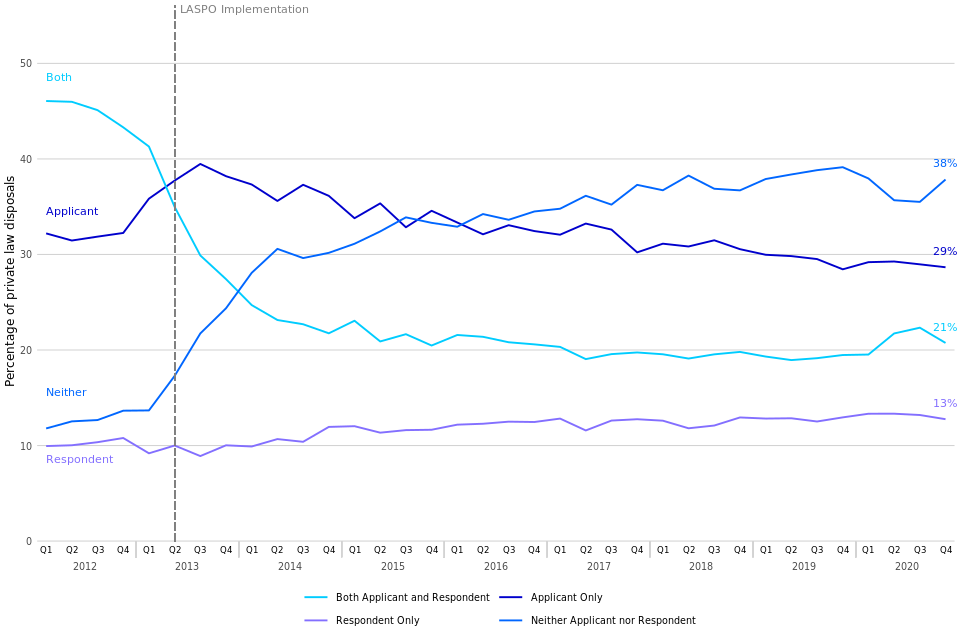
Figure 4: Proportion of private law disposals by type of legal representation of the parties, January to March 2012 to October to December 2020 (Source: Table 10)
The change seen in the pattern of legal representation is also demonstrated in private law cases with at least one hearing where the proportion of parties with legal representation stood at 59% in 2012 compared to 35% in 2020.
The proportion of parties with legal representation in cases with at least one hearing varies by case type and range from around 78% for financial remedy cases to 1% for adoption cases, with figures subject to change as new cases progress (Table 11). Across the whole of 2020 the proportions were similar to the final quarter, with a range from around 77% for financial remedy and public law to 3% for adoption.
7. Divorce
Increase in the number of divorce petitions while number of decree absolutes decreases
Divorce petitions were up by 5% in October to December 2020 compared to the same period in the previous year. Decree absolutes granted were down 24% in October to December 2020 compared to the same period in the previous year.
Average time for proceedings increased
Average time from petition to decree nisi increased to 30 weeks in October to December 2020, from 28 weeks in the same quarter of 2019 (Table 12).
There were 28,672 divorce petitions made during October to December 2020, up 5% from the same quarter in 2019. There were 23,810 decree absolutes granted in October to December 2020, down 24% compared to the same quarter in 2019 (Table 12).
Annually, petitions were down 4% in 2020 compared to 2019 and decree absolutes were down by 11%.
Timeliness of divorce cases
For those granted decree nisi in October to December 2020, the mean average time from the date of petition was 30 weeks, up 2 weeks from the same period in 2019. The mean average time from petition to decree absolute was 56 weeks, up 4 weeks from the equivalent quarter in 2019.
Between 2019 and 2020, the average time from petition to decree nisi decreased by 3 weeks to 28 weeks, whilst the average time to decree absolute decreased by 3 weeks to 53 weeks. The increasing share of divorce cases processed digitally is likely to reduce the average time of divorce proceedings (but note that the digital/paper split is not presented in this edition while we investigate some data issues).
The mean timeliness figures can be inflated when historical cases reach decree nisi or decree absolute. These historical cases have less effect on the median timeliness, which may act as a better indicator for the length of current divorce proceedings. In October to December 2020, the median time to decree nisi was 20 weeks and 39 weeks to decree absolute.
Figure 5: Percentage of divorce cases started between Q1 2011 to Q4 2020 reaching decree nisi or decree absolute, by the number of quarters since petition (Source: Table 14)
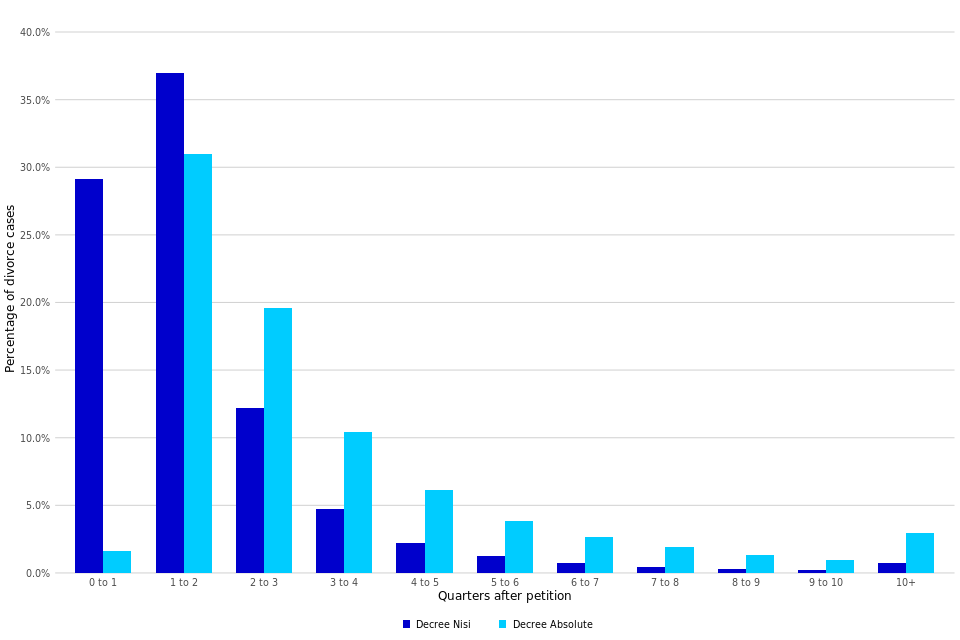
Figure 5: Percentage of divorce cases started between Q1 2011 to Q4 2020 reaching decree nisi or decree absolute, by the number of quarters since petition (Source: Table 14)
29% of divorce petitions made between Q1 2011 to Q4 2020 reached decree nisi in the first quarter after the petition was made, with a further 37% reaching this stage within the second quarter. Over half the petitions reached a decree absolute within three quarters after petition (2% in the first quarter, 31% within 1 to 2 quarters and 20% within 2 to 3 quarters) (Table 14).
8. Financial Remedy
Increase seen in financial remedy applications and disposals events
In October to December 2020, the number of financial remedy applications was up 6% and disposal events were up 12% compared to the same period in 2019 (Table 15).
There were 11,413 financial remedy applications made in October to December 2020, up 6% from the same period in 2019, while there were 12,406 financial remedy disposals events, up 12%. During this period, 73% of applications were uncontested and 27% were contested.
Across 2020 as a whole, there were 39,597 financial remedy applications, down 6% from 2019. Similarly, the number of financial remedy disposals was down 5% to 41,438.
Figure 6: Applications for financial remedy orders, January to March 2009 to October to December 2020 (Source: Table 15)
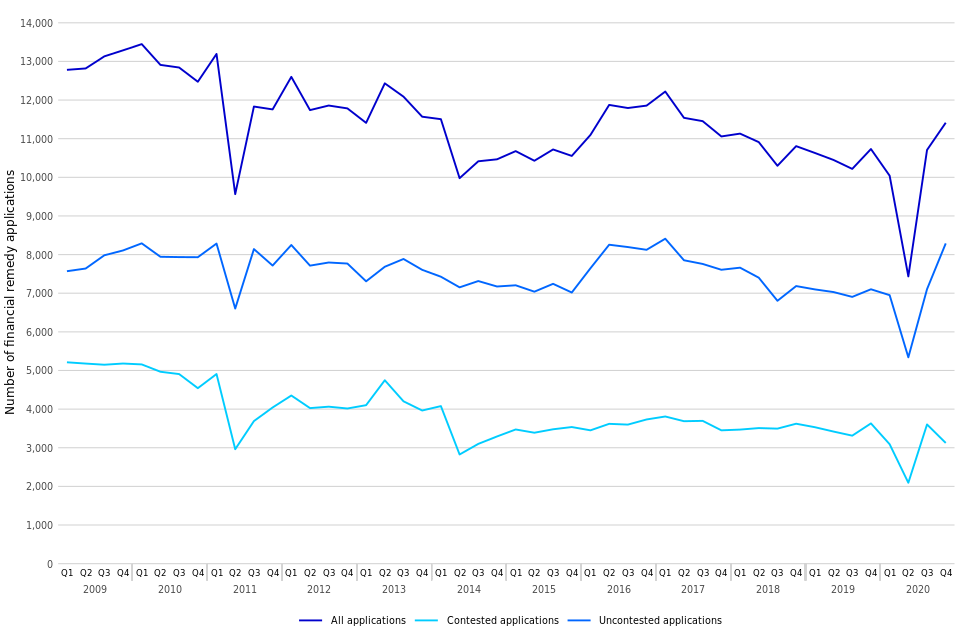
Figure 6: Applications for financial remedy orders, January to March 2009 to October to December 2020 (Source: Table 15)
9. Domestic Violence Remedy Orders
Increase in the number of domestic violence remedy order applications and orders made
In October to December 2020, the number of applications increased by 19% compared to the equivalent quarter in 2019 whilst the number of orders made increased by 20% over the same period (Table 16).
In October to December 2020, there were 9,173 applications made for a domestic violence remedy order, up 19% on the same quarter in 2019. Most of the applications were for non-molestation orders (84%) compared to occupation orders (16%); these proportions have remained relatively consistent in recent years. Applications for non-molestation orders in October to December 2020 were up 23% compared to the same period in 2019, while occupation orders applications increased by 3%.
There were 10,405 domestic violence orders made in October to December 2020, up 20% from the same period last year. 94% were non-molestation orders and 6% were occupation orders, with non-molestation orders up by 22% and occupation orders down by 5% compared to the equivalent quarter in 2019.
Across the year as a whole, there were record numbers of both domestic violence applications and orders. In 2020, 35,984 applications were made for domestic violence remedies, up 20% compared to 2019. There were 39,427 orders made, up 17% on the previous year. Non-molestation orders formed 83% of applications and 94% of orders, whilst occupation orders comprised 17% and 6% of the totals respectively.
The lockdown situation as a result of the covid-19 pandemic brought warnings about an increase in domestic violence, with victims having less opportunity to leave abusive partners. Longer term, police forces have been using a power to release alleged perpetrators without bail conditions, referred to as ‘released under investigation’, since 2017. This is a possible driving factor behind the rise in domestic violence remedy cases, as victims seek protective orders through the courts. The publicity regarding the Domestic Abuse Bill (draft published January 2019 and currently being examined in the House of Lords) may have also impacted levels.
Figure 7: Applications for domestic violence remedy orders, January to March 2009 to October to December 2020 (Source: Table 16)
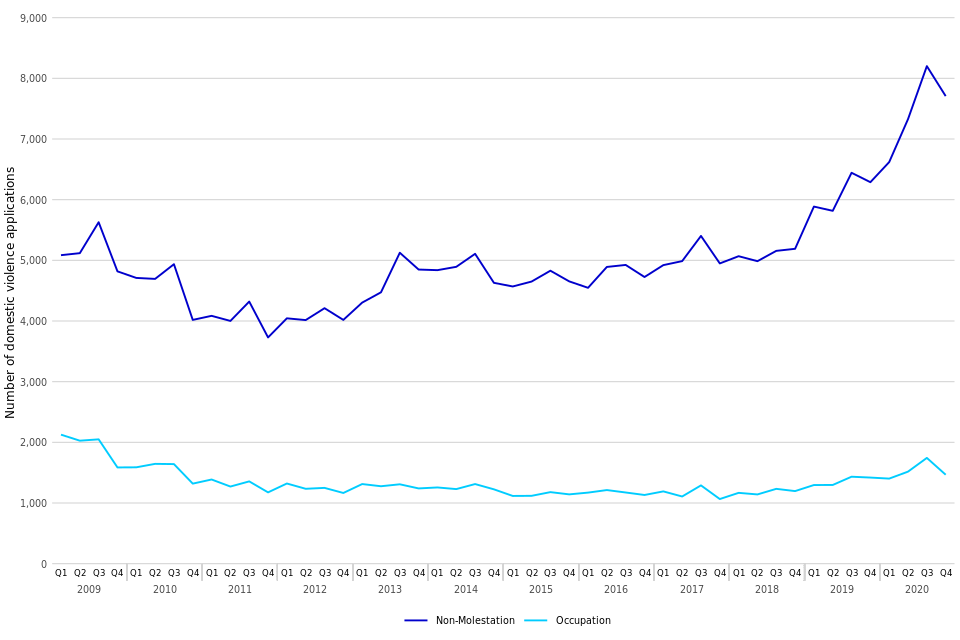
Figure 7: Applications for domestic violence remedy orders, January to March 2009 to October to December 2020 (Source: Table 16)
10. Forced Marriage Protection Orders and Female Genital Mutilation Protection Orders
General upward trend in the number of forced marriage protection orders and female genital mutilation protection orders, with more recent declines (Table 17 and 18).
The number of applications and orders made for forced marriage protection orders (FMPOs) is very small. Consequently, numbers fluctuate each quarter - overall there has been a general upward trend from their introduction in November 2008, with more recent volatility.
In October to December 2020, there were 75 applications, of which 77% of applications were for people aged 17 and under. Over the same period, there were 85 orders made, down 48% since the same period from the previous year.
In 2020, 239 applications were made for FMPOs, down 32% compared to 2019. There were 294 orders made, down 51% on the previous year.
Historically the numbers of orders made outweigh the number of applications. Often there are multiple orders granted per case, where one application covers more than one person, and an order is granted for each person covered in the application. Extensions and increased provision of previous orders can also be granted as new orders, without the need for a new application to be submitted.
Figure 8: Applications and orders made for Forced Marriage Protection Orders, January to March 2009 to October to December 2020 (Source: Table 17)
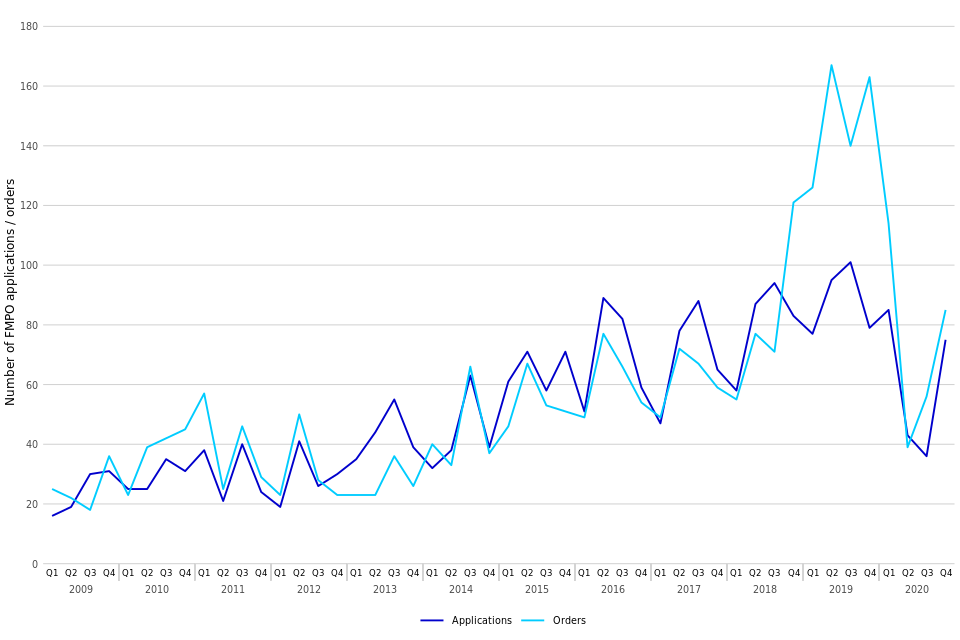
Figure 8: Applications and orders made for Forced Marriage Protection Orders, January to March 2009 to October to December 2020 (Source: Table 17)
As with FMPOs, the number of applications and orders made for female genital mutilation protection orders (FGMPOs) is very small, with only 14 applications and 32 orders made respectively in October to December 2020 (Table 18). In total, there have been 480 applications and 676 orders made up to end of December 2020, since their introduction in July 2015.
11. Adoptions
Decrease in the number of adoption applications and orders
During October to December 2020, there were 1,180 adoption applications made, down 4% from the equivalent quarter in 2020. Over the same period, the number of adoption orders issued also decreased by 8% to 1,106 (Tables 19 and 20).
During 2020 there were 4,229 adoption order appplications made, down 15% from 2019. This continues the downward trend seen in applications made since 2014. There were 3,826 adoption orders issued in 2020, down 24% comapred to 2019.
There were 2,518 applications under the Adoption and Children Act 2002, including placement orders during October to December 2020, similar to the same quarter in the previous year. Total disposals decreased by 9% to 2,197 over the same period. There were 9,282 applications under the Adoption and Children Act 2002 in 2020, down 11% from 2019 and continuing the downward trend seen in applications made since 2013
The chart below shows the trend of adoption orders by the type of adopter. This shows that during October to December 2020, 57% of all adoption orders were issued to mixed-sex couples, 19% to sole applicants, 17% to same-sex couples and 6% to step-parents.
Figure 9: Adoption orders issued, by adopter, January to March 2011 to October to December 2020 (Source: Table 20)
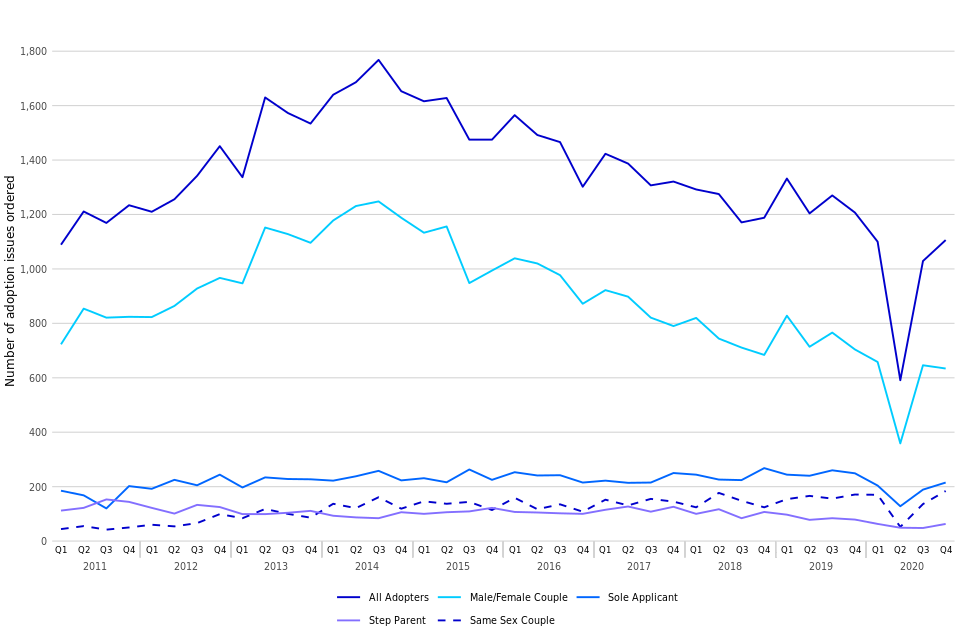
Figure 9: Adoption orders issued, by adopter, January to March 2011 to October to December 2020 (Source: Table 20)
12. Mental Capacity Act - Court of Protection
Increase in applications with a decrease in orders made in relation to deprivation of liberty
There were 1,363 applications relating to deprivation of liberty made in the most recent quarter, which is an increase of 16% on the number made in the same quarter in 2019. However, there was a decrease by 8% in the orders made for deprivation of liberty over the same period from 820 to 757.
A decrease in applications whilst orders increase under the Mental Capacity Act 2005 (MCA)
There were 7,677 applications made in October to December 2020, down by 6%. During the same period there were 13,437 orders made, up by 3%.
Since the Supreme Court clarified the definition of deprivation of liberty in 2014, there has been a significant increase in the number of applications. There were 109 in 2013 which increased to a high of 5,219 in 2019. The total number of applications in 2020 was down 5% on the 2019 total. In contrast, deprivation of liberty orders saw an increase of 26% compared to the previous year, with 3,518 orders made during the 2020.
Figure 10: Deprivation of Liberty applications and orders, January to March 2008 to October to December 2020 (Source: Table 22)
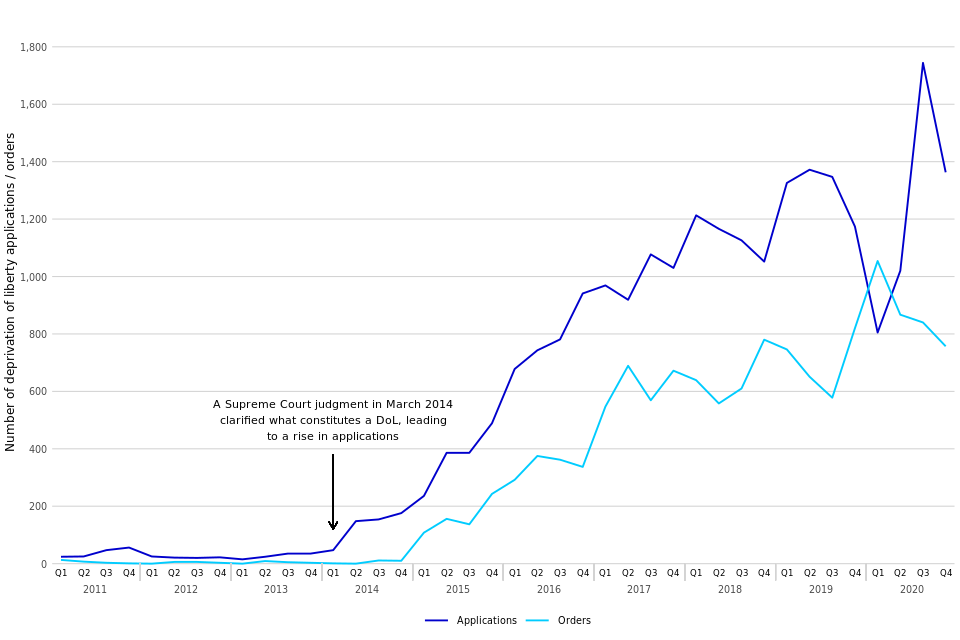
Figure 10: Deprivation of Liberty applications and orders, January to March 2008 to October to December 2020 (Source: Table 22)
In October to December 2020, there were 7,677 applications made under the Mental Capacity Act 2005 (MCA), down by 6% on the equivalent quarter in 2019 (8,158 applications). Of those, 41% related to applications for appointment of a property and affairs deputy (Table 21).
In comparison, there were 13,437 orders made under the Mental Capacity Act 2005 (MCA), up by 3% on the same quarter in 2019. Of those, 39% related to applications by an existing deputy or registered attorney (Table 22).
Applications by an existing deputy or registered attorney represented the highest proportion of orders made under the Mental Capacity Act (MCA) during 2020, totalling 38% of the 51,674 made throughout the year. The total number of orders made in 2020 was up 6% compared to 2019.
13. Mental Capacity Act - Office of the Public Guardian
Decrease in Lasting Powers of Attorney (LPAs) received
In October to December 2020, there were 191,414 LPAs received, down 14% compared to the equivalent quarter in 2019 (Table 23).
In total there were 193,392 Powers of Attorney (POAs) received in October to December 2020, down 14% from the same quarter in 2019 (Table 23). Lasting Power of Attorney (LPAs) made up 99% of POAs received in October to December 2020, with Enduring Powers of Attorney (EPAs) making up the other 1%. There were 1,978 EPAs in October to December 2020, similar to the equivalent quarter in 2019.
Annually, there were 736,493 LPAs received in 2020, down 18% compared to the previous year. There were 7,585 EPAs in 2020, down 17% on 2019. In total, there were 744,078 Powers of Attorney in 2020, down 18% from the year before
The sharp increase in LPAs seen during 2015 and 2016 was largely due to increased publicity and the new online forms introduced in July 2015 making it simpler and faster to apply.
Figure 11: Powers of attorney received, January to March 2008 to October to December 2020 (Source: Table 23)
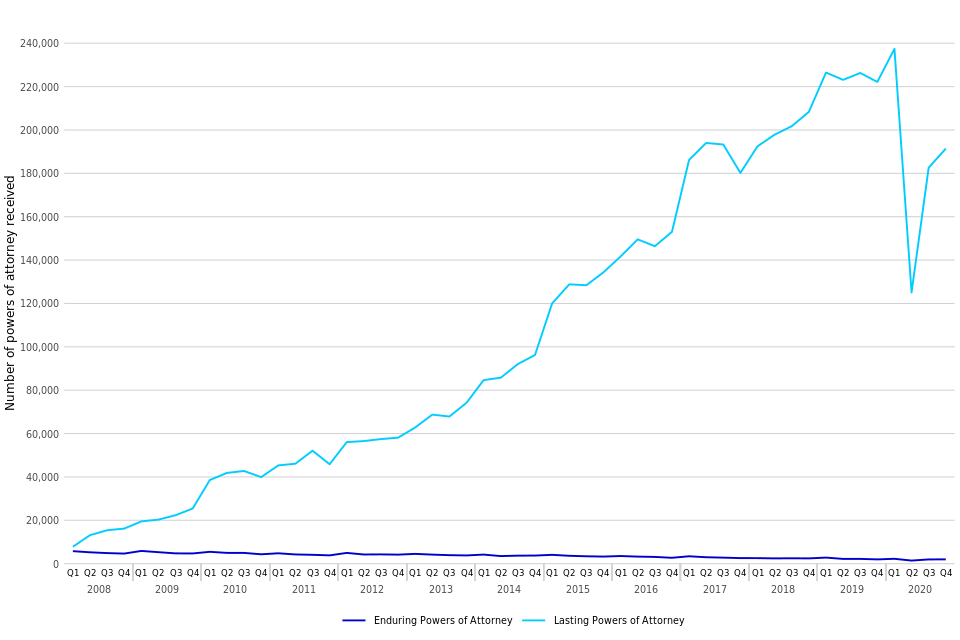
Figure 11: Powers of attorney received, January to March 2008 to October to December 2020 (Source: Table 23)
14. Probate Service
Increase in both the proportion of applications for probate grants and probate grants issued made digitally
In October to December 2020, there were 55,135 applications for probate grants. 54,476 probate grants were issued in the same period. 46% of these applications and 40% of these grants issued were made digitally, compared to 19% and 20% respectively in the same quarter in 2019 (Table 24).
Probate grants are issued more quickly than other grants of representation
Probate grants took approximately 7 weeks to be issued after the application was submitted during October to December 2020. Letters of administration with a will and without a will took around 14 and 9 weeks respectively (Table 26).
There were 67,697 applications made for grants of representation in October to December 2020. 55,135 (81%) of these were for probate grants, of which 46% were made digitally (Table 24).
Probate grants also make up the majority (83%) of all grants issued. In October to December 2020, 62% of the grants issued were applied for by legal professionals and 38% were personal applications (Table 24). For the 54,476 probate grants issued in the same period, 40% were issued digitally.
During 2020, there were 273,258 applications made for grants of representation, up 1% on 2019. There was a total of 256,619 grants of representation issued, up 8% on 2019. Probate grants made up 82% of all the grants of representation issued in 2020.
The average time from application submission to grant issue for probate grants was 7 weeks (median average 5 weeks) overall. Averages for letters of administration with a will and without a will were 14 and 9 weeks respectively for October to December 2020 (Table 26).
Timeliness of grants issued can be affected if the case has been ‘stopped’ for any reason (which can occur when there’s a dispute about either who can apply for probate or issues with a will or proposed will, or if an error is identified and a request for further information is made). Probate grants that were stopped during October to December 2020 took 12 weeks on average to be issued, compared to under 5 weeks for those that were not stopped.
When looking at the time from document receipt (i.e. when all accompanying documents and payment have been confirmed with the application) to grant issue, the time taken is around 1 week quicker than the average time from application submission for probate grants.
Figure 12: Average (mean) time for grants of representation issued from application submission by the Probate Service, July to September 2019 to 2020 to October to December 2020 (Source: Table 26)
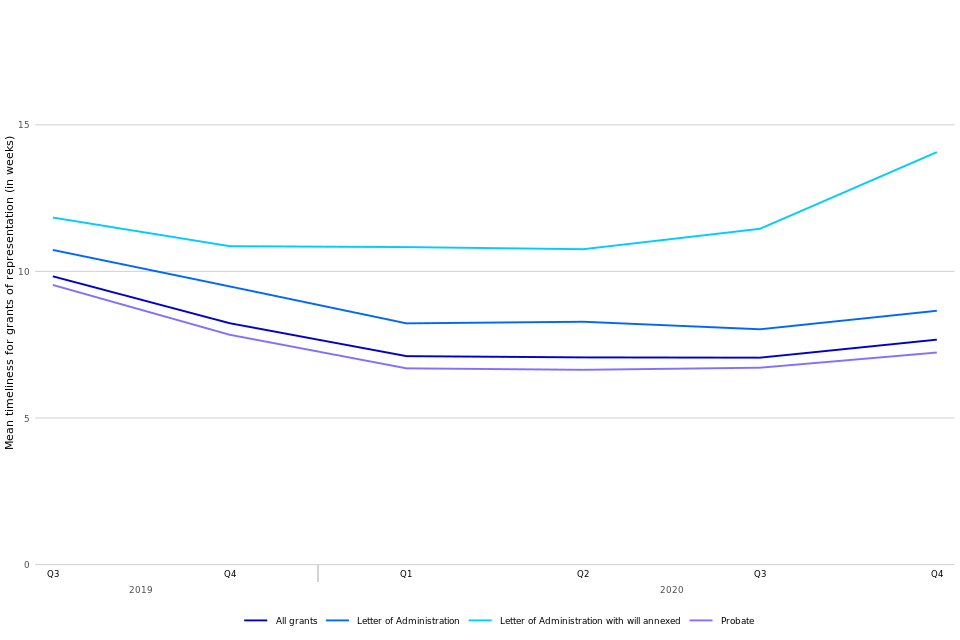
Figure 12: Average (mean) time for grants of representation issued from application submission by the Probate Service, July to September 2019 to October to December 2020 (Source: Table 26)
When a probate case is contested, the Chancery Division of the High Court deals with the matter. In 2020 there were 68 contested probate cases, unchanged from 2019.
15. Further information
The data presented in this publication are from live administrative databases. Therefore, previously published data is liable to be updated in the latest bulletin, following any further data cleaning or the incorporation of additional cases not available in the extracts used to produce previous bulletins.
Accompanying files
As well as this bulletin, the following products are published as part of this release:
-
A technical guide providing further information on how the data is collected and processed, as well as information on the revisions policy and legislation relevant to family court and background on the functioning of the family justice system
-
A set of overview tables and CSV files, covering each section of this bulletin
National Statistics status
National Statistics status means that official statistics meet the highest standards of trustworthiness, quality and public value.
All official statistics should comply with all aspects of the Code of Practice for Official Statistics. They are awarded National Statistics status following an assessment by the Authority’s regulatory arm. The Authority considers whether the statistics meet the highest standards of Code compliance, including the value they add to public decisions and debate.
It is the Ministry of Justice’s responsibility to maintain compliance with the standards expected for National Statistics. If we become concerned about whether these statistics are still meeting the appropriate standards, we will discuss any concerns with the Authority promptly. National Statistics status can be removed at any point when the highest standards are not maintained, and reinstated when standards are restored.
Contact
Press enquiries should be directed to the Ministry of Justice press office:
Tel: 0203 334 3536 Email: newsdesk@justice.gsi.gov.uk
Other enquiries about these statistics should be directed to the Data and Evidence as a Service division of the Ministry of Justice:
Carly Gray, Head of Access to Justice Data and Statistics
Email: ESD@justice.gov.uk
Next update: 24 June 2021
URL: https://www.gov.uk/government/collections/family-court-statistics-quarterly
© Crown copyright Produced by the Ministry of Justice
Alternative formats are available on request from ESD@justice.gov.uk
-
To note, annual trends are shaded grey. ↩
-
See the accompanying technical guide for more information. ↩
-
The Children and Family Court Advisory and Support Service (Cafcass) also publishes (England only) data on the number of private law cases. A comparison of Cafcass and MoJ data and further information can be found in the accompanying guide. ↩
-
Please see the accompanying guide for further details. ↩
-
Removal of Legal Aid was a result of the Legal Aid, Sentencing & Punishment of Offenders Act 2012 (LASPO). ↩